Scaling form of zero-field-cooled and field-cooled susceptibility in superparamagnet

Masatsugu Suzuki, Sharbani I. Fullem, and Itsuko S. Suzuki Department of Physics, State University of New York at Binghamton, Binghamton, New York 13902-6000
Abstract

The scaling form of the normalized ZFC and FC susceptibility of superparamagnets (SPM’s) is presented as a function of the normalized temperature y𝑦y (=kB​T/Kuβ€‹βŸ¨V⟩absentsubscriptπ‘˜π΅π‘‡subscript𝐾𝑒delimited-βŸ¨βŸ©π‘‰=k_{B}T/K_{u}\langle V\rangle), normalized magnetic field hβ„Žh (=H/HKabsent𝐻subscript𝐻𝐾=H/H_{K}), and the width ΟƒπœŽ\sigma of the log-normal distribution of the volumes of nanoparticles, based on the superparamagnetic blocking model with no interaction between the nanoparticles. Here ⟨V⟩delimited-βŸ¨βŸ©π‘‰\langle V\rangle is the average volume, Kusubscript𝐾𝑒K_{u} is the anisotropy energy, and HKsubscript𝐻𝐾H_{K} is the anisotropy field. Main features of the experimental results reported in many SPM’s can be well explained in terms of the present model. The normalized FC susceptibility increases monotonically increases as the normalized temperature y𝑦y decreases. The normalized ZFC susceptibility exhibits a peak at the normalized blocking temperature ybsubscript𝑦𝑏y_{b} (=kB​Tb/Kuβ€‹βŸ¨V⟩absentsubscriptπ‘˜π΅subscript𝑇𝑏subscript𝐾𝑒delimited-βŸ¨βŸ©π‘‰=k_{B}T_{b}/K_{u}\langle V\rangle), forming the ybsubscript𝑦𝑏y_{b} vs hβ„Žh diagram. For large ΟƒπœŽ\sigma (Οƒ>0.4𝜎0.4\sigma>0.4), ybsubscript𝑦𝑏y_{b} starts to increase with increasing hβ„Žh, showing a peak at h=hbβ„Žsubscriptβ„Žπ‘h=h_{b}, and decreases with further increasing hβ„Žh. The maximum of ybsubscript𝑦𝑏y_{b} at h=hbβ„Žsubscriptβ„Žπ‘h=h_{b} is due to the nonlinearity of the Langevin function. For small ΟƒπœŽ\sigma, ybsubscript𝑦𝑏y_{b} monotonically decreases with increasing hβ„Žh. The derivative of the normalized FC magnetization with respect to hβ„Žh shows a peak at hβ„Žh = 0 for small y𝑦y. This is closely related to the pinched form of MF​Csubscript𝑀𝐹𝐢M_{FC} vs H𝐻H curve around H𝐻H = 0 observed in SPM’s.

keywords:
superparamagnet , blocked state
PACS:
75.10.Nr , 75.30.Cr , 75.50.Tt
††journal: Journal of Magnetism and Magnetic Materials

1 Introduction

It is well known that the magnetic susceptibility of superparamagnets (SPM’s) and spin glasses (SG’s) strongly depends on the way how the cooling of the system is done before or during the measurement [1]. Typically there are two types of susceptibility, zero-field-cooled (ZFC) susceptibility and field-cooled (FC) susceptibility. In the case of the ZFC susceptibility (Ο‡Z​F​Csubscriptπœ’π‘πΉπΆ\chi_{ZFC}), the system is cooled in the absence of an external magnetic field (H𝐻H) from high temperatures well above a freezing temperature Tfsubscript𝑇𝑓T_{f} (a blocking temperature Tbsubscript𝑇𝑏T_{b} for the SPM’s and a spin freezing temperature Tgsubscript𝑇𝑔T_{g} for the SG’s) to the lowest temperature well below Tfsubscript𝑇𝑓T_{f} (the ZFC cooling protocol). After H𝐻H is applied at the lowest temperature, the ZFC susceptibility is measured with increasing temperature (T𝑇T). In contrast, the FC susceptibility (Ο‡F​Csubscriptπœ’πΉπΆ\chi_{FC}) is measured in the presence of H𝐻H with decreasing T𝑇T from high temperatures well above Tfsubscript𝑇𝑓T_{f} to the lowest temperature well below Tfsubscript𝑇𝑓T_{f} (the FC cooling protocol).

It has been experimentally confirmed that the T𝑇T dependence of the susceptibility for the SPM’s is essentially different from that for the SG’s [2, 3, 4, 5, 6, 7, 8, 9, 10, 11, 12]. For SPM’s [3], the ZFC susceptibility exhibits a peak at the blocking temperature Tbsubscript𝑇𝑏T_{b}, while the FC susceptibility monotonically increases with decreasing T𝑇T, showing no anomaly at Tbsubscript𝑇𝑏T_{b}. The difference between the FC and ZFC susceptibility appears well above Tbsubscript𝑇𝑏T_{b}. For SG’s [3], the ZFC susceptibility also exhibits a peak at the spin freezing temperature Tgsubscript𝑇𝑔T_{g}, while the FC susceptibility increases with decreasing T𝑇T above Tgsubscript𝑇𝑔T_{g} and starts to decrease or to saturate below Tgsubscript𝑇𝑔T_{g}, indicating the evidence of glass transition. The difference between the FC and ZFC susceptibility appears just at Tgsubscript𝑇𝑔T_{g}.

The purpose of the present paper is to explain the peculiar features on the T𝑇T and H𝐻H dependence of the ZFC susceptibility, which were reported in many SPM’s [2, 3, 4, 5, 6, 7, 8, 9, 10, 11, 12]. The first feature is as follows. The ZFC susceptibility shows a peak at the blocking temperature Tbsubscript𝑇𝑏T_{b}. The blocking temperature Tbsubscript𝑇𝑏T_{b} changes with H𝐻H in two different ways, depending on the nature of SPM’s. (i) Tbsubscript𝑇𝑏T_{b} first increases with increasing H𝐻H, reaching a peak and then decreases with further increasing H𝐻H (unusual type). (ii) Tbsubscript𝑇𝑏T_{b} monotonically decreases with increasing H𝐻H (conventional type). The feature (i) is observed for SPM’s such as Fe3O4 nanoparticles (Luo et al. [2]), natural horse-spleen (Friedman et al. [7]), γ𝛾\gamma-Fe2O3 nanoparticles with diameter 7 nm and ferritin (Sappey et al. [8]), and a diluted magnetic fluid composed of FePt nanoparticles (Zheng et al. [12]). These two different features are observed even in the same SPM, depending on the conditions of samples (such as dilute and concentrated samples). For γ𝛾\gamma-Fe2O3 nanoparticles in dispersed polymer show that the feature (i) is observed for dilute samples and that the feature (ii) is observed for concentrated samples (Kachkachi et al. [11]). The second feature is the H𝐻H dependence of the FC magnetization MF​Csubscript𝑀𝐹𝐢M_{FC} near H𝐻H = 0. The derivative of MF​Csubscript𝑀𝐹𝐢M_{FC} with respect to H𝐻H has a sharp peak at H𝐻H = 0 for ferritin (Tejada et al. [9]) and for CoFe2O4 nanoparticles embedded in potassium silicate (Zhang et al. [5]). For natural horse-spleen the magnetic hysteresis shows an anomalous pinched hysteresis loop near zero field (Friedman et al. [7]).

Here we present our numerical analysis of FC and ZFC susceptibility, based on the superparamagnetic blocking model with no interaction between the nanoparticles. The theory used here is the same as that used by Bitto et al. [3], and is essentially the same as the NΓ©el-Brown model [13, 14]. We show that the main features of the experimental results of the ZFC and FC susceptibility for SPM’s can be well explained in terms of the present model. The peculiar features of the susceptibility is due to the Langevin function of the magnetization. Our numerical results will be compared with those predicted by Sappey et al. [8]. We show that the blocking temperature Tbsubscript𝑇𝑏T_{b} is extremely sensitive to the width ΟƒπœŽ\sigma in the log-norm distribution for volumes of nanoparticles. Resonant tunneling is one of the models to explain the shift of Tbsubscript𝑇𝑏T_{b} with H𝐻H [6, 15]. For example, Tbsubscript𝑇𝑏T_{b} is 65 K for γ𝛾\gamma-Fe2O3 (Sappy et al. [8]) and is too high for the quantum tunneling by which the magnetic moment of the particles can flip. So this possibility may be ruled out.

2 Scaling form of Ο‡Z​F​Csubscriptπœ’π‘πΉπΆ\chi_{ZFC} and Ο‡F​Csubscriptπœ’πΉπΆ\chi_{FC}

2.1 Magnetization in the SPM state

We consider a single-domain particle (nanoparticle) with volume V𝑉V and the anisotropy having uniaxial symmetry. We assume that there is no interaction between these domains. The simplest form of the anisotropy energy is given by Ku​V​sin2⁑ϕsubscript𝐾𝑒𝑉superscript2italic-Ο•K_{u}V\sin^{2}\phi, where Ο•italic-Ο•\phi is the angle between the magnetization direction and the easy axis, and Kusubscript𝐾𝑒K_{u} is the anisotropy energy per unit volume. The two states [Ο•=0italic-Ο•0\phi=0 (partallel) and Ο•=Ο€italic-Ο•πœ‹\phi=\pi (antiparallel)] as the ground state, are energetically degenerate and separated by a energy-barrier height Δ​Ea​(V)=Ku​VΞ”subscriptπΈπ‘Žπ‘‰subscript𝐾𝑒𝑉\Delta E_{a}(V)=K_{u}V. At temperatures well above Tbsubscript𝑇𝑏T_{b}, the magnetization of the single-domain fluctuate due to the thermal activation energy (kB​Tsubscriptπ‘˜π΅π‘‡k_{B}T) in a paramagnetic way (SPM state). The definition of Tbsubscript𝑇𝑏T_{b} will be given in Sec.Β 2.3. The magnetization (the magnetic moment per unit volume) in the SPM state is described by [3]

Ms​p​m=Msβ€‹βŸ¨cos⁑θ⟩,superscriptπ‘€π‘ π‘π‘šsubscript𝑀𝑠delimited-βŸ¨βŸ©πœƒM^{spm}=M_{s}\langle\cos\theta\rangle, (1)

with

⟨cos⁑θ⟩delimited-βŸ¨βŸ©πœƒ\displaystyle\langle\cos\theta\rangle =\displaystyle= ∫eβˆ’UkB​T​cos⁑θ​dβ€‹Ξ©βˆ«eβˆ’UkB​T​𝑑Ωsuperscriptπ‘’π‘ˆsubscriptπ‘˜π΅π‘‡πœƒπ‘‘Ξ©superscriptπ‘’π‘ˆsubscriptπ‘˜π΅π‘‡differential-dΞ©\displaystyle\frac{\int e^{-\frac{U}{k_{B}T}}\cos\theta d\Omega}{\int e^{-\frac{U}{k_{B}T}}d\Omega} (2)
=\displaystyle= ∫0Ο€eMs​V​H​cos⁑θkB​T​cos⁑θ​(2​π​sin⁑θ​d​θ)∫0Ο€eMs​V​H​cos⁑θkB​T​(2​π​sin⁑θ​d​θ)superscriptsubscript0πœ‹superscript𝑒subscriptπ‘€π‘ π‘‰π»πœƒsubscriptπ‘˜π΅π‘‡πœƒ2πœ‹πœƒπ‘‘πœƒsuperscriptsubscript0πœ‹superscript𝑒subscriptπ‘€π‘ π‘‰π»πœƒsubscriptπ‘˜π΅π‘‡2πœ‹πœƒπ‘‘πœƒ\displaystyle\frac{\int\limits_{0}^{\pi}e^{\frac{M_{s}VH\cos\theta}{k_{B}T}}\cos\theta(2\pi\sin\theta d\theta)}{\int\limits_{0}^{\pi}e^{\frac{M_{s}VH\cos\theta}{k_{B}T}}(2\pi\sin\theta d\theta)}
=\displaystyle= L​(Ms​V​HkB​T)𝐿subscript𝑀𝑠𝑉𝐻subscriptπ‘˜π΅π‘‡\displaystyle L(\frac{M_{s}VH}{k_{B}T})

where ΞΌπœ‡\mu (=Ms​Vabsentsubscript𝑀𝑠𝑉=M_{s}V) is the magnetic moment of the single domain with the volume V𝑉V, Mssubscript𝑀𝑠M_{s} is the saturation magnetization (the magnetic moment per unit volume), ΞΈπœƒ\theta (0≀θ≀π0πœƒπœ‹0\leq\theta\leq\pi) is the angle between 𝝁𝝁\boldsymbol{\mu} and H𝐻H (the z𝑧z axis), ΩΩ\Omega is the solid angle, d​Ω=2​π​sin⁑θ​d​θ𝑑Ω2πœ‹πœƒπ‘‘πœƒd\Omega=2\pi\sin\theta d\theta, kBsubscriptπ‘˜π΅k_{B} is the Boltzmann constant, Uπ‘ˆU is the Zeeman energy defined by

U=βˆ’πβ‹…π‡=βˆ’Ms​V​H​cosβ‘ΞΈπ‘ˆβ‹…ππ‡subscriptπ‘€π‘ π‘‰π»πœƒU=-{\boldsymbol{\mu}}\cdot{\bf H}=-M_{s}VH\cos\theta (3)

and L​(ΞΆ)𝐿𝜁L(\zeta) is the Langevin function of ΢𝜁\zeta;

L​(ΞΆ)=coth⁑(ΞΆ)βˆ’1ΞΆ.𝐿𝜁hyperbolic-cotangent𝜁1𝜁L(\zeta)=\coth(\zeta)-\frac{1}{\zeta}. (4)

2.2 Magnetization in the blocked state

At temperatures well below Tbsubscript𝑇𝑏T_{b}, this themal activation energy is too small to cause the barrier hopping between the two states (Ο•=0italic-Ο•0\phi=0 and Ο€πœ‹\pi). Then the direction of the magnetization in the single domain is frozen to one of the two states (Ο•=0italic-Ο•0\phi=0 and Ο•=Ο€italic-Ο•πœ‹\phi=\pi).

2.2.1 Hβˆ₯H\parallel easy axis

Here we evaluate the ZFC susceptibility below Tbsubscript𝑇𝑏T_{b} in the system where the single domains are randomly oriented [16, 17, 18, 19]. First, we consider the case when an external magnetic field H𝐻H is applied along the easy axis. The system is in thermal equilibrium. The total energy Fβˆ₯subscript𝐹parallel-toF_{\parallel} consists of the anisotropy energy and the Zeeman energy;

Fβˆ₯=V​(Ku​sin2β‘Ο•βˆ’H​Ms​cos⁑ϕ)=Ku​V​(sin2β‘Ο•βˆ’2​h​cos⁑ϕ),subscript𝐹parallel-to𝑉subscript𝐾𝑒superscript2italic-ϕ𝐻subscript𝑀𝑠italic-Ο•subscript𝐾𝑒𝑉superscript2italic-Ο•2β„Žitalic-Ο•F_{\parallel}=V(K_{u}\sin^{2}\phi-HM_{s}\cos\phi)=K_{u}V(\sin^{2}\phi-2h\cos\phi), (5)

and the derivative is given by

d​Fβˆ₯d​ϕ=2​Ku​V​(cos⁑ϕ+h)​sin⁑ϕ,𝑑subscript𝐹parallel-to𝑑italic-Ο•2subscript𝐾𝑒𝑉italic-Ο•β„Žitalic-Ο•\frac{dF_{\parallel}}{d\phi}=2K_{u}V(\cos\phi+h)\sin\phi, (6)

where Ο•italic-Ο•\phi is the angle between the easy axis and the magnetization direction. The normalized field hβ„Žh is defined by h=H/HKβ„Žπ»subscript𝐻𝐾h=H/H_{K}, where HKsubscript𝐻𝐾H_{K} is the anisotropy field and is defined by

HK=2​Ku/Ms.subscript𝐻𝐾2subscript𝐾𝑒subscript𝑀𝑠H_{K}=2K_{u}/M_{s}. (7)

The free energy Fβˆ₯subscript𝐹parallel-toF_{\parallel} has a minimum at Ο•=0italic-Ο•0\phi=0, and Ο€πœ‹\pi, and a maximum at cos⁑ϕ=βˆ’hitalic-Ο•β„Ž\cos\phi=-h. The minimum of the free energy Fβˆ₯subscript𝐹parallel-toF_{\parallel} is given by

Fβˆ₯min=Ku​V​(βˆ’2​h),superscriptsubscript𝐹parallel-tosubscript𝐾𝑒𝑉2β„ŽF_{\parallel}^{\min}=K_{u}V(-2h), (8)

at Ο•=0italic-Ο•0\phi=0 and Ο€πœ‹\pi, while the maximum of the free energy is given by

Fβˆ₯max=Ku​V​(h2+1).superscriptsubscript𝐹parallel-tosubscript𝐾𝑒𝑉superscriptβ„Ž21F_{\parallel}^{\max}=K_{u}V(h^{2}+1). (9)

at cos⁑ϕ=βˆ’hitalic-Ο•β„Ž\cos\phi=-h. The energy-height barrier between two states (Ο•=0italic-Ο•0\phi=0 and Ο€πœ‹\pi) is obtained as

Δ​Fβˆ₯=Fβˆ₯maxβˆ’Fβˆ₯min=Ku​V​(1+h)2.Ξ”subscript𝐹parallel-tosuperscriptsubscript𝐹parallel-tosuperscriptsubscript𝐹parallel-tosubscript𝐾𝑒𝑉superscript1β„Ž2\Delta F_{\parallel}=F_{\parallel}^{\max}-F_{\parallel}^{\min}=K_{u}V(1+h)^{2}. (10)

This means that the energy-barrier height increases with increasing hβ„Žh. Then the magnetization along the easy axis (Ο•italic-Ο•\phi = 0 state) is simply given by

Mβˆ₯=Ms.subscript𝑀parallel-tosubscript𝑀𝑠M_{\parallel}=M_{s}. (11)

The appearance of magnetization along the easy axis below Tbsubscript𝑇𝑏T_{b} is indicative of the freezing of the direction of the magneization along the easy axis. This is one of the important features for the blocked state. The susceptibility along the easy direction is equal to zero;

Ο‡βˆ₯=0.subscriptπœ’parallel-to0\chi_{\parallel}=0. (12)

2.2.2 HβŸ‚perpendicular-to𝐻absentH\perp easy axis

Next we consider the case when the magnetic field is applied to the hard axis (perpendicular to the easy axis). The total free energy FβŸ‚subscript𝐹perpendicular-toF_{\perp} is given by

FβŸ‚=V​(Ku​sin2β‘Ο•βˆ’H​Ms​sin⁑ϕ)=Ku​V​(sin2β‘Ο•βˆ’2​h​sin⁑ϕ),subscript𝐹perpendicular-to𝑉subscript𝐾𝑒superscript2italic-ϕ𝐻subscript𝑀𝑠italic-Ο•subscript𝐾𝑒𝑉superscript2italic-Ο•2β„Žitalic-Ο•F_{\perp}=V(K_{u}\sin^{2}\phi-HM_{s}\sin\phi)=K_{u}V(\sin^{2}\phi-2h\sin\phi), (13)

and the derivative is given by

βˆ‚FβŠ₯βˆ‚Ο•=2​Ku​V​cos⁑ϕ​(sinβ‘Ο•βˆ’h),subscript𝐹bottomitalic-Ο•2subscript𝐾𝑒𝑉italic-Ο•italic-Ο•β„Ž\frac{\partial F_{\bot}}{\partial\phi}=2K_{u}V\cos\phi(\sin\phi-h), (14)

where Ο•italic-Ο•\phi is the angle between the easy axis and the magnetization direction, and hβ„Žh is smaller than 1. The free energy FβŸ‚subscript𝐹perpendicular-toF_{\perp} has a minimum at sinΟ•=hitalic-Ο•β„Ž\phi=h. Then the magnetization along the hard axis (the field direction) of the single domain is obtained as

MβŸ‚=Ms​sin⁑ϕ=Ms​h=MsHK​H,subscript𝑀perpendicular-tosubscript𝑀𝑠italic-Ο•subscriptπ‘€π‘ β„Žsubscript𝑀𝑠subscript𝐻𝐾𝐻M_{\perp}=M_{s}\sin\phi=M_{s}h=\frac{M_{s}}{H_{K}}H, (15)

while the susceptibility along the hard axis (the field direction) is

Ο‡βŸ‚=MβŸ‚H=MsHK=Ms22​Ku.subscriptπœ’perpendicular-tosubscript𝑀perpendicular-to𝐻subscript𝑀𝑠subscript𝐻𝐾superscriptsubscript𝑀𝑠22subscript𝐾𝑒\chi_{\perp}=\frac{M_{\perp}}{H}=\frac{M_{s}}{H_{K}}=\frac{M_{s}^{2}}{2K_{u}}. (16)

The minimum value of FβŸ‚subscript𝐹perpendicular-toF_{\perp} is given by

FβŸ‚min=βˆ’Ku​V​h2,superscriptsubscript𝐹perpendicular-tosubscript𝐾𝑒𝑉superscriptβ„Ž2F_{\perp}^{\min}=-K_{u}Vh^{2}, (17)

at sin⁑ϕ=hitalic-Ο•β„Ž\sin\phi=h, while the maximum value of FβŸ‚subscript𝐹perpendicular-toF_{\perp} is given by

FβŸ‚max=Ku​V​(1βˆ’2​h),superscriptsubscript𝐹perpendicular-tosubscript𝐾𝑒𝑉12β„ŽF_{\perp}^{\max}=K_{u}V(1-2h), (18)

at Ο•=Ο€/2italic-Ο•πœ‹2\phi=\pi/2. Then the energy-barrier height between two states denoted by sin⁑θ=hπœƒβ„Ž\sin\theta=h, is given by the energy difference Δ​FβŸ‚Ξ”subscript𝐹perpendicular-to\Delta F_{\perp} defined by

Δ​FβŸ‚=FβŸ‚maxβˆ’FβŸ‚min=Δ​Ea​(V,h)=Ku​V​(1βˆ’h)2,Ξ”subscript𝐹perpendicular-tosuperscriptsubscript𝐹perpendicular-tosuperscriptsubscript𝐹perpendicular-toΞ”subscriptπΈπ‘Žπ‘‰β„Žsubscript𝐾𝑒𝑉superscript1β„Ž2\Delta F_{\perp}=F_{\perp}^{\max}-F_{\perp}^{\min}=\Delta E_{a}(V,h)=K_{u}V(1-h)^{2}, (19)

indicating that the energy-barrier height Δ​Ea​(V,h)Ξ”subscriptπΈπ‘Žπ‘‰β„Ž\Delta E_{a}(V,h) decreases with the increase of hβ„Žh or with the decrease of V𝑉V.

Refer to caption
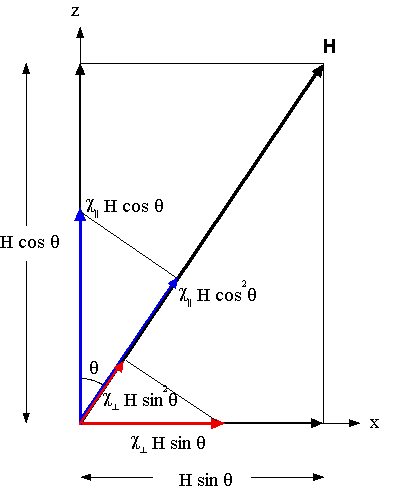
Figure 1: (Color online) The schematic diagram of the easy axis (the z𝑧z axis) of the single domain and the external magnetic field 𝐇𝐇{\bf H} in the z𝑧z-xπ‘₯x plane. The angle between 𝐇𝐇{\bf H} and the z𝑧z axis is ΞΈπœƒ\theta. The z𝑧z and xπ‘₯x components of 𝐇𝐇{\bf H} are H​cosβ‘ΞΈπ»πœƒH\cos\theta and H​sinβ‘ΞΈπ»πœƒH\sin\theta, respectively. Correspondingly, the z𝑧z and xπ‘₯x components of the magnetization induced by the field 𝐇𝐇{\bf H} are Ο‡βˆ₯​H​cos⁑θsubscriptπœ’parallel-toπ»πœƒ\chi_{\parallel}H\cos\theta and Ο‡βŸ‚β€‹H​sin⁑θsubscriptπœ’perpendicular-toπ»πœƒ\chi_{\perp}H\sin\theta. From the symmetry, only the component of the resultant susceptibility along the direction of 𝐇𝐇{\bf H} is not equal to zero, and is given by Ο‡βˆ₯​cos2⁑θ+Ο‡βŸ‚β€‹sin2⁑θsubscriptπœ’parallel-tosuperscript2πœƒsubscriptπœ’perpendicular-tosuperscript2πœƒ\chi_{\parallel}\cos^{2}\theta+\chi_{\perp}\sin^{2}\theta.

In a system where the direction of the easy axes for single domains is randomly oriented, the average susceptibility (so-called powder susceptibility) can be evaluated as

Ο‡a​vsubscriptπœ’π‘Žπ‘£\displaystyle\chi_{av} =\displaystyle= Ο‡βˆ₯β€‹βŸ¨cos2⁑θ⟩+Ο‡βŸ‚β€‹βŸ¨sin2⁑θ⟩subscriptπœ’parallel-todelimited-⟨⟩superscript2πœƒsubscriptπœ’perpendicular-todelimited-⟨⟩superscript2πœƒ\displaystyle\chi_{\parallel}\langle\cos^{2}\theta\rangle+\chi_{\perp}\langle\sin^{2}\theta\rangle (20)
=\displaystyle= ∫(Ο‡βˆ₯​cos2⁑θ+Ο‡βŸ‚β€‹sin2⁑θ)β€‹π‘‘Ξ©βˆ«π‘‘Ξ©subscriptπœ’parallel-tosuperscript2πœƒsubscriptπœ’perpendicular-tosuperscript2πœƒdifferential-dΞ©differential-dΞ©\displaystyle\frac{\int(\chi_{\parallel}\cos^{2}\theta+\chi_{\perp}\sin^{2}\theta)d\Omega}{\int d\Omega}
=\displaystyle= 13​χβˆ₯+23β€‹Ο‡βŸ‚13subscriptπœ’parallel-to23subscriptπœ’perpendicular-to\displaystyle\frac{1}{3}\chi_{\parallel}+\frac{2}{3}\chi_{\perp}
=\displaystyle= Ms23​Ku,superscriptsubscript𝑀𝑠23subscript𝐾𝑒\displaystyle\frac{M_{s}^{2}}{3K_{u}},

using Eqs.(12) and (16), where d​Ω=2​π​sin⁑θ​d​θ𝑑Ω2πœ‹πœƒπ‘‘πœƒd\Omega=2\pi\sin\theta d\theta, ΞΈπœƒ\theta (0≀θ≀π0πœƒπœ‹0\leq\theta\leq\pi) is the polar angle between the easy axis (the z𝑧z axis) and the magnetic-field direction, see Fig.Β 1 and the caption for the detail of calculation. When the average susceptibility is expressed by Eq.(20), we refer to the system as being in the blocked state. This susceptibility is the ZFC susceptibility of the single-domain with volume V𝑉V below Tbsubscript𝑇𝑏T_{b}.

2.3 Blocking temperature Tbsubscript𝑇𝑏T_{b}

The relaxation time of the magnetization between two states (Ο•italic-Ο•\phi = 0 and Ο€πœ‹\pi states) is given by thermal activation (Arrehenius law). In the NΓ©el-Brown relaxation process [13, 14], the relaxation time of the magnetization between the two states is given by,

Ο„=Ο„0​exp⁑[Δ​Ea​(V)kB​T],𝜏subscript𝜏0Ξ”subscriptπΈπ‘Žπ‘‰subscriptπ‘˜π΅π‘‡\tau=\tau_{0}\exp[\frac{\Delta E_{a}(V)}{k_{B}T}], (21)

where Ο„0subscript𝜏0\tau_{0} is a microscopic limiting relaxation time (usually Ο„0β‰ˆ10βˆ’9subscript𝜏0superscript109\tau_{0}\approx 10^{-9} sec). The measurement time Ο„msubscriptπœπ‘š\tau_{m} is typically of the order of 102superscript10210^{2} sec for the DC magnetization measurement. In Eq.Β (21) with Ο„=Ο„m𝜏subscriptπœπ‘š\tau=\tau_{m} and T=Tb​(V)𝑇subscript𝑇𝑏𝑉T=T_{b}(V), the blocking temperature Tb​(V)subscript𝑇𝑏𝑉T_{b}(V) is derived as

Tb​(V)=Δ​Ea​(V)kB​ln⁑(Ο„m/Ο„0).subscript𝑇𝑏𝑉ΔsubscriptπΈπ‘Žπ‘‰subscriptπ‘˜π΅subscriptπœπ‘šsubscript𝜏0T_{b}(V)=\frac{\Delta E_{a}(V)}{k_{B}\ln(\tau_{m}/\tau_{0})}. (22)

In the presence of H𝐻H, it is assumed that the energy-barrier Δ​Ea​(V,h)Ξ”subscriptπΈπ‘Žπ‘‰β„Ž\Delta E_{a}(V,h) is described by

Δ​Ea​(V,h)=Ku​V​(1βˆ’h)Ξ±,Ξ”subscriptπΈπ‘Žπ‘‰β„Žsubscript𝐾𝑒𝑉superscript1β„Žπ›Ό\Delta E_{a}(V,h)=K_{u}V(1-h)^{\alpha}, (23)

where Ξ±=2𝛼2\alpha=2 in the present case. Note that Ξ±=1.5𝛼1.5\alpha=1.5 when the orientational order is taken into account [8]. The blocking temperature Tb​(V,h)subscriptπ‘‡π‘π‘‰β„ŽT_{b}(V,h) is given by

Tb​(V,h)=Ku​VkB​ln⁑(Ο„m/Ο„0)​(1βˆ’h)Ξ±.subscriptπ‘‡π‘π‘‰β„Žsubscript𝐾𝑒𝑉subscriptπ‘˜π΅subscriptπœπ‘šsubscript𝜏0superscript1β„Žπ›ΌT_{b}(V,h)=\frac{K_{u}V}{k_{B}\ln(\tau_{m}/\tau_{0})}(1-h)^{\alpha}. (24)

2.4 Form of magnetization in the superparamagnetic state and blocked state

Before discussing the general case, first we consider a simple case where all nanoparticles have the same volume. Above the blocking temperature Tb​(V,h)subscriptπ‘‡π‘π‘‰β„ŽT_{b}(V,h), the system is in the SPM state. The magnetization Ms​p​msuperscriptπ‘€π‘ π‘π‘šM^{spm} (per unit volume) for the SPM state is given by [3]

MZ​F​Cs​p​m​(V)=MF​Cs​p​m​(V)=ϡ​Ms​L​(Ms​V​HkB​T),superscriptsubscriptπ‘€π‘πΉπΆπ‘ π‘π‘šπ‘‰superscriptsubscriptπ‘€πΉπΆπ‘ π‘π‘šπ‘‰italic-Ο΅subscript𝑀𝑠𝐿subscript𝑀𝑠𝑉𝐻subscriptπ‘˜π΅π‘‡M_{ZFC}^{spm}(V)=M_{FC}^{spm}(V)=\epsilon M_{s}L(\frac{M_{s}VH}{k_{B}T}), (25)

where Ο΅italic-Ο΅\epsilon is the volume fraction occupied by ferromagnetic nanoparticles.

Below Tb​(V,h)subscriptπ‘‡π‘π‘‰β„ŽT_{b}(V,h), the system is in a blocked state. The magnetization Mb​lsuperscript𝑀𝑏𝑙M^{bl} (per unit volume) of the blocked state is given by

MZ​F​Cb​l​(V)=ϡ​Ms2​H3​Ku,superscriptsubscript𝑀𝑍𝐹𝐢𝑏𝑙𝑉italic-Ο΅superscriptsubscript𝑀𝑠2𝐻3subscript𝐾𝑒M_{ZFC}^{bl}(V)=\frac{\epsilon M_{s}^{2}H}{3K_{u}}, (26)

and

MF​Cb​l​(V)=ϡ​Ms​L​(Ms​V​HkB​Tb​(V,h)).superscriptsubscript𝑀𝐹𝐢𝑏𝑙𝑉italic-Ο΅subscript𝑀𝑠𝐿subscript𝑀𝑠𝑉𝐻subscriptπ‘˜π΅subscriptπ‘‡π‘π‘‰β„ŽM_{FC}^{bl}(V)=\epsilon M_{s}L(\frac{M_{s}VH}{k_{B}T_{b}(V,h)}). (27)

2.5 Scaling form of normalized ZFC and FC susceptibility
Refer to caption
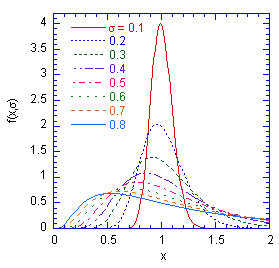
Figure 2: (Color online) Plot of f​(x,Οƒ)𝑓π‘₯𝜎f(x,\sigma) as a function of xπ‘₯x at various ΟƒπœŽ\sigma (Οƒ=0.1βˆ’0.8𝜎0.10.8\sigma=0.1-0.8). f​(x,Οƒ)𝑓π‘₯𝜎f(x,\sigma) is a log-normal distribution function and is defined by Eq. (34).

Using Eqs.Β (25)-(27), we derive the general expression for the magnetization. We consider a system of ferromagnetic nanoparticles having a wide distribution of volume sizes and let ⟨V⟩delimited-βŸ¨βŸ©π‘‰\langle V\rangle be their average volume. We also define a characteristic volume Vm​(T,h)subscriptπ‘‰π‘šπ‘‡β„ŽV_{m}(T,h) given by

Vm​(T,h)=kB​TKu​(1βˆ’h)α​ln⁑(Ο„m/Ο„0),subscriptπ‘‰π‘šπ‘‡β„Žsubscriptπ‘˜π΅π‘‡subscript𝐾𝑒superscript1β„Žπ›Όsubscriptπœπ‘šsubscript𝜏0V_{m}(T,h)=\frac{k_{B}T}{K_{u}(1-h)^{\alpha}}\ln(\tau_{m}/\tau_{0}), (28)

which is derived from the condition

Δ​Ea​(Vm,h)kB​T=ln⁑(Ο„m/Ο„0).Ξ”subscriptπΈπ‘Žsubscriptπ‘‰π‘šβ„Žsubscriptπ‘˜π΅π‘‡subscriptπœπ‘šsubscript𝜏0\frac{\Delta E_{a}(V_{m},h)}{k_{B}T}=\ln(\tau_{m}/\tau_{0}). (29)

For simplicity we introduce a volume ratio xπ‘₯x (=V/⟨V⟩absent𝑉delimited-βŸ¨βŸ©π‘‰=V/\langle V\rangle). The characteristic volume ratio xmsubscriptπ‘₯π‘šx_{m} is then defined by

xmsubscriptπ‘₯π‘š\displaystyle x_{m} =\displaystyle= Vm​(T,h)⟨V⟩=kB​TKuβ€‹βŸ¨VβŸ©β€‹(1βˆ’h)α​ln⁑(Ο„m/Ο„0)subscriptπ‘‰π‘šπ‘‡β„Ždelimited-βŸ¨βŸ©π‘‰subscriptπ‘˜π΅π‘‡subscript𝐾𝑒delimited-βŸ¨βŸ©π‘‰superscript1β„Žπ›Όsubscriptπœπ‘šsubscript𝜏0\displaystyle\frac{V_{m}(T,h)}{\langle V\rangle}=\frac{k_{B}T}{K_{u}\langle V\rangle(1-h)^{\alpha}}\ln(\tau_{m}/\tau_{0}) (30)
=\displaystyle= y(1βˆ’h)α​ln⁑(Ο„m/Ο„0),𝑦superscript1β„Žπ›Όsubscriptπœπ‘šsubscript𝜏0\displaystyle\frac{y}{(1-h)^{\alpha}}\ln(\tau_{m}/\tau_{0}),

where y𝑦y is the reduced temperature and is defined by y=kB​T/(Kuβ€‹βŸ¨V⟩)𝑦subscriptπ‘˜π΅π‘‡subscript𝐾𝑒delimited-βŸ¨βŸ©π‘‰y=k_{B}T/(K_{u}\langle V\rangle). For x<xmπ‘₯subscriptπ‘₯π‘šx<x_{m}, the system is in a SPM state, and for x>xmπ‘₯subscriptπ‘₯π‘šx>x_{m}, the system is in a blocked state. For the SPM state, the ZFC and FC magnetizations shown in Eq.Β (25) can be rewritten as

MZ​F​Cs​p​m​(x,y,h)=MF​Cs​p​m​(x,y,h)=ϡ​Ms​L​(2​h​xy),superscriptsubscriptπ‘€π‘πΉπΆπ‘ π‘π‘šπ‘₯π‘¦β„Žsuperscriptsubscriptπ‘€πΉπΆπ‘ π‘π‘šπ‘₯π‘¦β„Žitalic-Ο΅subscript𝑀𝑠𝐿2β„Žπ‘₯𝑦M_{ZFC}^{spm}(x,y,h)=M_{FC}^{spm}(x,y,h)=\epsilon M_{s}L(\frac{2hx}{y}), (31)

while for the blocked state Eqs.Β (26) and (27) are rewritten as

MZ​F​Cb​l​(x,y,h)=ϡ​Ms​2​h3,superscriptsubscript𝑀𝑍𝐹𝐢𝑏𝑙π‘₯π‘¦β„Žitalic-Ο΅subscript𝑀𝑠2β„Ž3M_{ZFC}^{bl}(x,y,h)=\epsilon M_{s}\frac{2h}{3}, (32)

and

MF​Cb​l​(x,y,h)=ϡ​Ms​L​(2​h(1βˆ’h)α​ln⁑(Ο„m/Ο„0)),superscriptsubscript𝑀𝐹𝐢𝑏𝑙π‘₯π‘¦β„Žitalic-Ο΅subscript𝑀𝑠𝐿2β„Žsuperscript1β„Žπ›Όsubscriptπœπ‘šsubscript𝜏0M_{FC}^{bl}(x,y,h)=\epsilon M_{s}L(\frac{2h}{(1-h)^{\alpha}}\ln(\tau_{m}/\tau_{0})), (33)

respectively.

We assume that volume distribution of the nanoparticles, f​(x,Οƒ)𝑓π‘₯𝜎f(x,\sigma), is expressed by the log-normal function [3]

f​(x,Οƒ)=12​π​σ​x​exp⁑[βˆ’(ln⁑x)22​σ2],𝑓π‘₯𝜎12πœ‹πœŽπ‘₯superscriptπ‘₯22superscript𝜎2f(x,\sigma)=\frac{1}{\sqrt{2\pi}\sigma x}\exp[-\frac{(\ln x)^{2}}{2\sigma^{2}}], (34)

where

∫0∞f​(x,Οƒ)​𝑑x=1,Β and ​xa​v=∫0∞x​f​(x,Οƒ)​𝑑x=exp⁑(Οƒ2/2).formulae-sequencesuperscriptsubscript0𝑓π‘₯𝜎differential-dπ‘₯1Β andΒ subscriptπ‘₯π‘Žπ‘£superscriptsubscript0π‘₯𝑓π‘₯𝜎differential-dπ‘₯superscript𝜎22\int\limits_{0}^{\infty}f(x,\sigma)dx=1,\textrm{ and }x_{av}=\int\limits_{0}^{\infty}xf(x,\sigma)dx=\exp(\sigma^{2}/2).

Here xa​vsubscriptπ‘₯π‘Žπ‘£x_{av} is the average of xπ‘₯x and ΟƒπœŽ\sigma is the width of the distribution. Figure 2 shows a plot of f​(x,Οƒ)𝑓π‘₯𝜎f(x,\sigma) as a function of xπ‘₯x at various ΟƒπœŽ\sigma. The log-normal distribution function f​(x,Οƒ)𝑓π‘₯𝜎f(x,\sigma) has a maximum at x=xm​a​x=exp⁑(βˆ’Οƒ2)π‘₯subscriptπ‘₯π‘šπ‘Žπ‘₯superscript𝜎2x=x_{max}=\exp(-\sigma^{2}). The value of xm​a​xsubscriptπ‘₯π‘šπ‘Žπ‘₯x_{max} decreases with increasing ΟƒπœŽ\sigma, while the value of xa​vsubscriptπ‘₯π‘Žπ‘£x_{av} increases with increasing ΟƒπœŽ\sigma. In the limit of Οƒβ†’0β†’πœŽ0\sigma\rightarrow 0, f​(x,Οƒ)𝑓π‘₯𝜎f(x,\sigma) becomes a Dirac delta function δ​(xβˆ’1)𝛿π‘₯1\delta(x-1) which has a sharp peak at xπ‘₯x = 1. Using Eqs.Β (31)–(34), the scaling forms of the normalized ZFC and FC susceptibility are given by

Ο‡Z​F​C​(y,h,Οƒ)Ο‡0subscriptπœ’π‘πΉπΆπ‘¦β„ŽπœŽsubscriptπœ’0\displaystyle\frac{\chi_{ZFC}(y,h,\sigma)}{\chi_{0}} =\displaystyle= 1h∫0∞[L(2​h​xy)Uβˆ’1(xmβˆ’x)\displaystyle\frac{1}{h}\int\nolimits_{0}^{\infty}[L(\frac{2hx}{y})U_{-1}(x_{m}-x) (35)
+\displaystyle+ 2​h3Uβˆ’1(xβˆ’xm)]f(x,Οƒ)dx,\displaystyle\frac{2h}{3}U_{-1}(x-x_{m})]f(x,\sigma)dx,

and

Ο‡F​C​(y,h,Οƒ)Ο‡0subscriptπœ’πΉπΆπ‘¦β„ŽπœŽsubscriptπœ’0\displaystyle\frac{\chi_{FC}(y,h,\sigma)}{\chi_{0}} =\displaystyle= 1h∫0∞[L(2​h​xy)Uβˆ’1(xmβˆ’x)\displaystyle\frac{1}{h}\int\nolimits_{0}^{\infty}[L(\frac{2hx}{y})U_{-1}(x_{m}-x)
+\displaystyle+ L(2hln⁑(Ο„m/Ο„0)(1βˆ’h)Ξ±)Uβˆ’1(xβˆ’xm)]f(x,Οƒ)dx,\displaystyle L(2h\frac{\ln(\tau_{m}/\tau_{0})}{(1-h)^{\alpha}})U_{-1}(x-x_{m})]f(x,\sigma)dx,

where Uβˆ’1subscriptπ‘ˆ1U_{-1} is a step function [Uβˆ’1​(x)=1subscriptπ‘ˆ1π‘₯1U_{-1}(x)=1 for xβ‰₯0π‘₯0x\geq 0 and 0 for x<0π‘₯0x<0]. Ο‡0subscriptπœ’0\chi_{0} [=ϡ​Ms2/(2​Ku)absentitalic-Ο΅superscriptsubscript𝑀𝑠22subscript𝐾𝑒=\epsilon M_{s}^{2}/(2K_{u})] is a constant susceptibility and xmsubscriptπ‘₯π‘šx_{m} given by Eq.Β (30) is a function of y𝑦y, hβ„Žh, and Ο„m/Ο„0subscriptπœπ‘šsubscript𝜏0\tau_{m}/\tau_{0}. The normalized ZFC and FC susceptibilities depend only on y𝑦y, hβ„Žh, Ο„m/Ο„0subscriptπœπ‘šsubscript𝜏0\tau_{m}/\tau_{0}, and ΟƒπœŽ\sigma. They are independent of the values of Ο΅italic-Ο΅\epsilon, Mssubscript𝑀𝑠M_{s}, Kusubscript𝐾𝑒K_{u}, and ⟨V⟩delimited-βŸ¨βŸ©π‘‰\langle V\rangle. Hereafter, we assume ln⁑(Ο„m/Ο„0)=ln⁑(102/10βˆ’9)=25.328subscriptπœπ‘šsubscript𝜏0superscript102superscript10925.328\ln(\tau_{m}/\tau_{0})=\ln(10^{2}/10^{-9})=25.328 for simplicity. In this case, Ο‡Z​F​C/Ο‡0subscriptπœ’π‘πΉπΆsubscriptπœ’0\chi_{ZFC}/\chi_{0} and Ο‡F​C/Ο‡0subscriptπœ’πΉπΆsubscriptπœ’0\chi_{FC}/\chi_{0} are described by scaling functions of y𝑦y, hβ„Žh, and ΟƒπœŽ\sigma.

3 Numerical calculation

Refer to caption
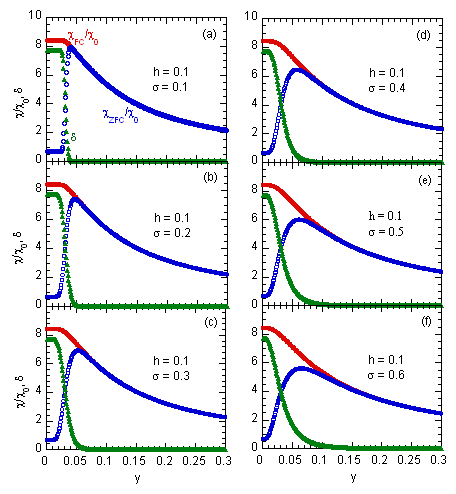
Figure 3: (Color online) Plot of Ο‡Z​F​C/Ο‡0subscriptπœ’π‘πΉπΆsubscriptπœ’0\chi_{ZFC}/\chi_{0}, Ο‡F​C/Ο‡0subscriptπœ’πΉπΆsubscriptπœ’0\chi_{FC}/\chi_{0}, and Ξ΄=(Ο‡F​Cβˆ’Ο‡Z​F​C)/Ο‡0𝛿subscriptπœ’πΉπΆsubscriptπœ’π‘πΉπΆsubscriptπœ’0\delta=(\chi_{FC}-\chi_{ZFC})/\chi_{0} as a function of reduced temperature y𝑦y. hβ„Žh = 0.1. The width ΟƒπœŽ\sigma is varied from 0.1 to 0.6 as a parameter. Ξ±=2.0𝛼2.0\alpha=2.0. ln⁑(Ο„m/Ο„0)=25.328subscriptπœπ‘šsubscript𝜏025.328\ln(\tau_{m}/\tau_{0})=25.328. Ο‡0=Ρ​Ms2/(2​Ku)subscriptπœ’0πœ€superscriptsubscript𝑀𝑠22subscript𝐾𝑒\chi_{0}=\varepsilon M_{s}^{2}/(2K_{u}), y=kB​T/(Kuβ€‹βŸ¨V⟩)𝑦subscriptπ‘˜π΅π‘‡subscript𝐾𝑒delimited-βŸ¨βŸ©π‘‰y=k_{B}T/(K_{u}\langle V\rangle), and h=H/HKβ„Žπ»subscript𝐻𝐾h=H/H_{K}.
Refer to caption
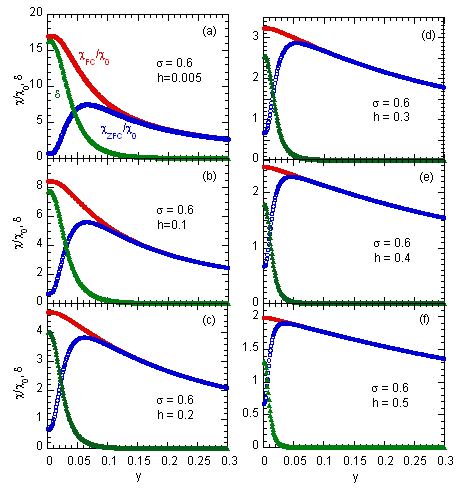
Figure 4: (Color online) Plot of Ο‡Z​F​C/Ο‡0subscriptπœ’π‘πΉπΆsubscriptπœ’0\chi_{ZFC}/\chi_{0}, Ο‡F​C/Ο‡0subscriptπœ’πΉπΆsubscriptπœ’0\chi_{FC}/\chi_{0}, and Ξ΄=(Ο‡F​Cβˆ’Ο‡Z​F​C)/Ο‡0𝛿subscriptπœ’πΉπΆsubscriptπœ’π‘πΉπΆsubscriptπœ’0\delta=(\chi_{FC}-\chi_{ZFC})/\chi_{0} as a function of reduced temperature y𝑦y. ΟƒπœŽ\sigma = 0.6. The reduced field hβ„Žh is changed as a parameter: h=0.005βˆ’0.5β„Ž0.0050.5h=0.005-0.5. Ξ±=2.0𝛼2.0\alpha=2.0

Figures 3(a)-(f) show typical plots of Ο‡Z​F​C/Ο‡0subscriptπœ’π‘πΉπΆsubscriptπœ’0\chi_{ZFC}/\chi_{0}, Ο‡F​C/Ο‡0subscriptπœ’πΉπΆsubscriptπœ’0\chi_{FC}/\chi_{0} and the difference δ𝛿\delta defined by Ξ΄=(Ο‡Z​F​Cβˆ’Ο‡F​C)/Ο‡0𝛿subscriptπœ’π‘πΉπΆsubscriptπœ’πΉπΆsubscriptπœ’0\delta=(\chi_{ZFC}-\chi_{FC})/\chi_{0} as a function of the normalized temperature (y=kB​T/Kuβ€‹βŸ¨V⟩)𝑦subscriptπ‘˜π΅π‘‡subscript𝐾𝑒delimited-βŸ¨βŸ©π‘‰(y=k_{B}T/K_{u}\langle V\rangle) , where Ξ±=2.0𝛼2.0\alpha=2.0 and ln⁑(Ο„m/Ο„0)=25.328subscriptπœπ‘šsubscript𝜏025.328\ln(\tau_{m}/\tau_{0})=25.328. The reduced field hβ„Žh (=H/HK)=H/H_{K}) is kept constant at hβ„Žh = 0.1, and the width of the log-normal volume distribution function (ΟƒπœŽ\sigma) is varied as a parameter (ΟƒπœŽ\sigma = 0.1 to 0.6). The normalized ZFC susceptibility Ο‡Z​F​C/Ο‡0subscriptπœ’π‘πΉπΆsubscriptπœ’0\chi_{ZFC}/\chi_{0} for ΟƒπœŽ\sigma = 0.1 exhibits a peak at the normalized blocking temperature ybsubscript𝑦𝑏y_{b}. The difference δ𝛿\delta starts to appear at the onset normalized temperature of irreversibility yi​r​rsubscriptπ‘¦π‘–π‘Ÿπ‘Ÿy_{irr} (just above ybsubscript𝑦𝑏y_{b}) and increases with decreasing y𝑦y. The irreversible effect of susceptibility occurs below yi​r​rsubscriptπ‘¦π‘–π‘Ÿπ‘Ÿy_{irr}. The normalized FC susceptibility Ο‡F​C/Ο‡0subscriptπœ’πΉπΆsubscriptπœ’0\chi_{FC}/\chi_{0} for ΟƒπœŽ\sigma = 0.1 is nearly independent of y𝑦y below ybsubscript𝑦𝑏y_{b}. These features are common to those observed in real SG systems [3]. Here, the system behaves like a superspin glass (SSG), where the large magnetic moment of the nanoparticle plays the same role as an atomic spin in a SG system [20]. As ΟƒπœŽ\sigma increases, the peak of Ο‡Z​F​C/Ο‡0subscriptπœ’π‘πΉπΆsubscriptπœ’0\chi_{ZFC}/\chi_{0} becomes broad and shifts to the large y𝑦y-side. The normalized FC susceptibility Ο‡F​C/Ο‡0subscriptπœ’πΉπΆsubscriptπœ’0\chi_{FC}/\chi_{0} for large ΟƒπœŽ\sigma (typically ΟƒπœŽ\sigma = 0.6) tends to increase with decreasing y𝑦y in the small-y𝑦y region (at low temperatures).

Similar numerical calculations are carried out for the different α𝛼\alpha (=1.5βˆ’2.0absent1.52.0=1.5-2.0). We find that the essential points of numerical results are not so different for different α𝛼\alpha. So here we show only the result for α𝛼\alpha = 2.0. Note that α𝛼\alpha = 1.5 is used in the paper of Sappey et al. [8].

Figures 4 (a)-(f) show typical plots of Ο‡Z​F​C/Ο‡0subscriptπœ’π‘πΉπΆsubscriptπœ’0\chi_{ZFC}/\chi_{0}, Ο‡F​C/Ο‡0subscriptπœ’πΉπΆsubscriptπœ’0\chi_{FC}/\chi_{0} and δ𝛿\delta as a function of y𝑦y for Οƒ=0.6𝜎0.6\sigma=0.6, where hβ„Žh is changed as a parameter (h=0.005βˆ’0.5β„Ž0.0050.5h=0.005-0.5). The normalized susceptibility Ο‡F​C/Ο‡0subscriptπœ’πΉπΆsubscriptπœ’0\chi_{FC}/\chi_{0} at each hβ„Žh increases with decreasing y𝑦y below ybsubscript𝑦𝑏y_{b}. The normalized susceptibility Ο‡Z​F​C/Ο‡0subscriptπœ’π‘πΉπΆsubscriptπœ’0\chi_{ZFC}/\chi_{0} exhibits a broad peak at ybsubscript𝑦𝑏y_{b}, which shifts to the low-y𝑦y side with increasing hβ„Žh.

Refer to caption
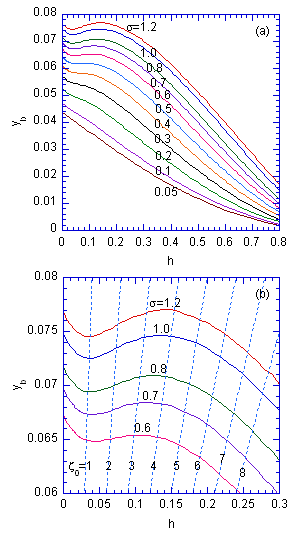
Figure 5: (Color online) (a) ybsubscript𝑦𝑏y_{b} vs hβ„Žh diagram at various ΟƒπœŽ\sigma (= 0.05 - 1.2). ybsubscript𝑦𝑏y_{b} is the normalized blocking temperature, and hβ„Žh is the normalized field. Ξ±=2.0𝛼2.0\alpha=2.0. ln⁑(Ο„m/Ο„0)=25.328subscriptπœπ‘šsubscript𝜏025.328\ln(\tau_{m}/\tau_{0})=25.328. ΟƒπœŽ\sigma is the width of the log-norm distribution. (b) Detail of the ybsubscript𝑦𝑏y_{b} vs hβ„Žh diagram at ΟƒπœŽ\sigma = 0.6, 0.7, 0.8, 1.0, and 1.2. The dotted lines are denoted by yb=2​h/ΞΆ0subscript𝑦𝑏2β„Žsubscript𝜁0y_{b}=2h/\zeta_{0} with ΞΆ0subscript𝜁0\zeta_{0} = 1, 2, β‹―β‹―\cdots, 8.

Figures 5(a) and (b) show a plot of ybsubscript𝑦𝑏y_{b} as a function of hβ„Žh (ybsubscript𝑦𝑏y_{b} vs hβ„Žh diagram) at various width ΟƒπœŽ\sigma. For small ΟƒπœŽ\sigma (typically σ≀0.11𝜎0.11\sigma\leq 0.11), ybsubscript𝑦𝑏y_{b} monotonically decreases with increasing hβ„Žh. At a larger ΟƒπœŽ\sigma (typically 0.6≀σ≀1.20.6𝜎1.20.6\leq\sigma\leq 1.2), ybsubscript𝑦𝑏y_{b} decreases with increase in hβ„Žh for very low hβ„Žh, and shows a local minimum around h=0.05β„Ž0.05h=0.05. With further increasing hβ„Žh, ybsubscript𝑦𝑏y_{b} increases with increasing hβ„Žh, showing a local maximum around h=0.10βˆ’0.15β„Ž0.100.15h=0.10-0.15, and decreases with further increasing hβ„Žh. The local maximum position shifts to high-hβ„Žh side with increasing ΟƒπœŽ\sigma. The origin of the local maximum in the ybsubscript𝑦𝑏y_{b} vs hβ„Žh curves arises mainly due to the nonlinearity of the Langevin function in Eq.Β (35), as will be discussed in Sec.Β 4. It should be noted that this diagram of ybsubscript𝑦𝑏y_{b} vs hβ„Žh may be a feature common to any SPM’s, since it depends only on the scaled variables hβ„Žh and y𝑦y.

Refer to caption
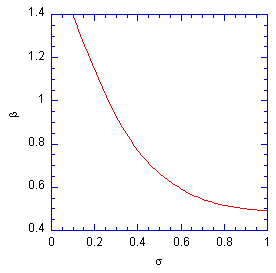
Figure 6: (Color online) Exponent β𝛽\beta vs ΟƒπœŽ\sigma. The exponent β𝛽\beta is derived from the least-squares fit of the ybsubscript𝑦𝑏y_{b} vs hβ„Žh curves for 0.1≲h≲0.6less-than-or-similar-to0.1β„Žless-than-or-similar-to0.60.1\lesssim h\lesssim 0.6 to Eq.Β (37). Ξ±=2.0𝛼2.0\alpha=2.0.

As shown in Fig.Β 5(a), the curvature of ybsubscript𝑦𝑏y_{b} vs hβ„Žh diagram drastically changes with varying ΟƒπœŽ\sigma. We assume that the hβ„Žh dependence of ybsubscript𝑦𝑏y_{b} is expressed by a power law form

h=h0​(1βˆ’yby0)Ξ²,β„Žsubscriptβ„Ž0superscript1subscript𝑦𝑏subscript𝑦0𝛽h=h_{0}(1-\frac{y_{b}}{y_{0}})^{\beta}, (37)

for 0.1≀h≀0.60.1β„Ž0.60.1\leq h\leq 0.6, where β𝛽\beta is an exponent and h0subscriptβ„Ž0h_{0} and y0subscript𝑦0y_{0} are constants. The least-squares fit of the numerical result of hβ„Žh vs ybsubscript𝑦𝑏y_{b} for each ΟƒπœŽ\sigma to Eq.Β (37) yields the parameters β𝛽\beta, y0subscript𝑦0y_{0}, and h0subscriptβ„Ž0h_{0}. In Fig.Β 6, we show the value of β𝛽\beta thus obtained, as a function of ΟƒπœŽ\sigma. We find that the exponent β𝛽\beta is strongly dependent on the width ΟƒπœŽ\sigma: β𝛽\beta increases with decrease in ΟƒπœŽ\sigma. The exponent β𝛽\beta is nearly equal to 0.5 at ΟƒπœŽ\sigma = 1.2. It increases with decreasing ΟƒπœŽ\sigma and is nearly equal to 1.5 at ΟƒπœŽ\sigma = 0.01. Note that Ξ²=3/2𝛽32\beta=3/2 is an exponent predicted for the de Almeida-Thouless (AT) line [21] for the H𝐻H-T𝑇T diagram in Ising SG systems.

Refer to caption
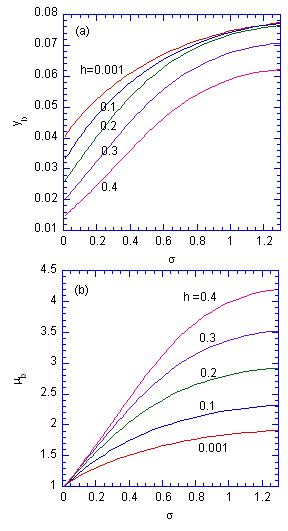
Figure 7: (Color online) (a) yb​(Οƒ,h)subscriptπ‘¦π‘πœŽβ„Žy_{b}(\sigma,h) vs ΟƒπœŽ\sigma at hβ„Žh = 0.001, 0.1, 0.2, 0.3, and 0.4. α𝛼\alpha = 2.0. (b) Plot of ΞΌb=yb​(Οƒ,h)/yb​(Οƒβ†’0,h)subscriptπœ‡π‘subscriptπ‘¦π‘πœŽβ„Žsubscriptπ‘¦π‘β†’πœŽ0β„Ž\mu_{b}=y_{b}(\sigma,h)/y_{b}(\sigma\rightarrow 0,h) vs ΟƒπœŽ\sigma at various hβ„Žh. yb​(Οƒ,h)subscriptπ‘¦π‘πœŽβ„Žy_{b}(\sigma,h) is the normalized blocking temperature at fixed hβ„Žh and ΟƒπœŽ\sigma.

Figure 7(a) shows the plot of yb​(Οƒ,h)subscriptπ‘¦π‘πœŽβ„Žy_{b}(\sigma,h) as a function of ΟƒπœŽ\sigma for a fixed hβ„Žh (=0.001βˆ’0.4absent0.0010.4=0.001-0.4). The value of ybsubscript𝑦𝑏y_{b} increases with increasing ΟƒπœŽ\sigma at each hβ„Žh. Figure 7(b) shows the ratio ΞΌbsubscriptπœ‡π‘\mu_{b} defined as ΞΌb=yb​(Οƒ,h)/yb​(Οƒβ†’0,h)subscriptπœ‡π‘subscriptπ‘¦π‘πœŽβ„Žsubscriptπ‘¦π‘β†’πœŽ0β„Ž\mu_{b}=y_{b}(\sigma,h)/y_{b}(\sigma\rightarrow 0,h) as a function of ΟƒπœŽ\sigma at various hβ„Žh, where yb​(Οƒβ†’0,h)subscriptπ‘¦π‘β†’πœŽ0β„Žy_{b}(\sigma\rightarrow 0,h) is obtained from the extrapolation of yb​(Οƒ,h)subscriptπ‘¦π‘πœŽβ„Žy_{b}(\sigma,h) in the limit of Οƒβ†’0β†’πœŽ0\sigma\rightarrow 0. We find that the ratio ΞΌbsubscriptπœ‡π‘\mu_{b} is proportional to ΟƒπœŽ\sigma at small ΟƒπœŽ\sigma and tends to saturate at large ΟƒπœŽ\sigma. Our result is rather different from the prediction by Sappey et al. [8] above ΟƒπœŽ\sigma = 0.8. Their value of ΞΌbsubscriptπœ‡π‘\mu_{b} tends to diverge with increasing ΟƒπœŽ\sigma above ΟƒπœŽ\sigma = 0.8, while that of ours tends to saturate. The reason for such a difference in ΞΌbsubscriptπœ‡π‘\mu_{b} at large ΟƒπœŽ\sigma is that the nonlinearity of the Langevin function with y𝑦y and hβ„Žh is not taken into account in the paper by Sappey et al. [8].
Refer to caption
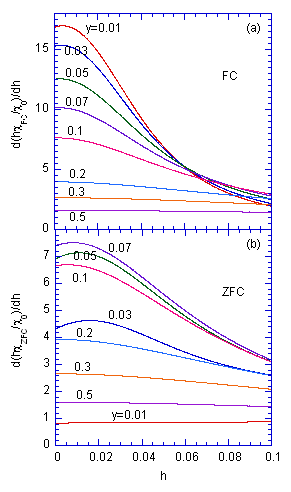
Figure 8: (Color online) hβ„Žh-dependence of (a) d(h​χF​C/Ο‡0)β„Žsubscriptπœ’πΉπΆsubscriptπœ’0(h\chi_{FC}/\chi_{0})/dhβ„Žh and (b) d(h​χZ​F​C/Ο‡0)β„Žsubscriptπœ’π‘πΉπΆsubscriptπœ’0(h\chi_{ZFC}/\chi_{0})/dhβ„Žh at various y𝑦y (= 0.01 - 0.5). ΟƒπœŽ\sigma = 0.6. α𝛼\alpha = 2.0. ybsubscript𝑦𝑏y_{b} is nearly constant (β‰ˆ0.065absent0.065\approx 0.065) for 0.02≀h≀0.120.02β„Ž0.120.02\leq h\leq 0.12 (see Fig.Β 5).
Refer to caption
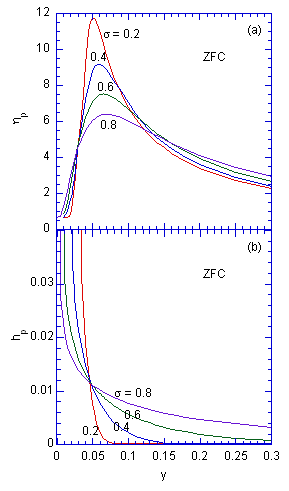
Figure 9: (Color online) (a) The peak height Ξ·psubscriptπœ‚π‘\eta_{p} and (b) the peak field hpsubscriptβ„Žπ‘h_{p} as a function of y𝑦y at various ΟƒπœŽ\sigma, where d(h​χZ​F​C/Ο‡0)β„Žsubscriptπœ’π‘πΉπΆsubscriptπœ’0(h\chi_{ZFC}/\chi_{0})/dhβ„Žh vs hβ„Žh curve exhibits a peak height Ξ·psubscriptπœ‚π‘\eta_{p} at a peak field hpsubscriptβ„Žπ‘h_{p} for each y𝑦y. Ξ±=2.0𝛼2.0\alpha=2.0.

Figure 8(a) shows the hβ„Žh dependence of the derivative d(h​χF​C/Ο‡0)β„Žsubscriptπœ’πΉπΆsubscriptπœ’0(h\chi_{FC}/\chi_{0})/dhβ„Žh at various y𝑦y, where Οƒ=0.6𝜎0.6\sigma=0.6, Ξ±=2.0𝛼2.0\alpha=2.0, and (h​χF​C/Ο‡0)β„Žsubscriptπœ’πΉπΆsubscriptπœ’0(h\chi_{FC}/\chi_{0}) is proportional to MF​Csubscript𝑀𝐹𝐢M_{FC}. The value of ybsubscript𝑦𝑏y_{b} is nealy constant (β‰ˆ0.065absent0.065\approx 0.065) for 0.02≀h≀0.120.02β„Ž0.120.02\leq h\leq 0.12 (see Fig.Β 5). For y<yb𝑦subscript𝑦𝑏y<y_{b}, it shows a sharp peak around h=0β„Ž0h=0. For y>yb𝑦subscript𝑦𝑏y>y_{b}, d(h​χF​C/Ο‡0)β„Žsubscriptπœ’πΉπΆsubscriptπœ’0(h\chi_{FC}/\chi_{0})/dhβ„Žh becomes flat around h=0β„Ž0h=0. The pinched hysteresis form for MF​Csubscript𝑀𝐹𝐢M_{FC} vs H𝐻H near H=0𝐻0H=0 observed for SPM’s [5, 7, 9] implies that the derivative of MF​Csubscript𝑀𝐹𝐢M_{FC} with respect to H𝐻H exhibits a sharp peak. Thus these experimental results can be explained by the present model. Figure 8(b) shows the hβ„Žh dependence of the derivative d(h​χZ​F​C/Ο‡0)β„Žsubscriptπœ’π‘πΉπΆsubscriptπœ’0(h\chi_{ZFC}/\chi_{0})/dhβ„Žh at various y𝑦y, where Οƒ=0.6𝜎0.6\sigma=0.6 and (h​χZ​F​C/Ο‡0)β„Žsubscriptπœ’π‘πΉπΆsubscriptπœ’0(h\chi_{ZFC}/\chi_{0}) is proportional to MZ​F​Csubscript𝑀𝑍𝐹𝐢M_{ZFC}. It shows a broad peak at h=hpβ„Žsubscriptβ„Žπ‘h=h_{p} (= 0.0159) for y=0.03𝑦0.03y=0.03. This peak field hpsubscriptβ„Žπ‘h_{p} shifts to the lower-hβ„Žh side with increasing y𝑦y, while the peak height Ξ·psubscriptπœ‚π‘\eta_{p} increases with increasing y𝑦y, showing a local maximum at hp=0.0089subscriptβ„Žπ‘0.0089h_{p}=0.0089 for yβ‰ˆ0.065𝑦0.065y\approx 0.065. We note that these values of y𝑦y and hpsubscriptβ„Žπ‘h_{p} for the local maximum are located on the ybsubscript𝑦𝑏y_{b} vs hβ„Žh diagram (h≃0)similar-to-or-equalsβ„Ž0(h\simeq 0) for ΟƒπœŽ\sigma = 0.6 (see Fig.Β 5(b)). Figures 9(a) and (b) show the peak height Ξ·psubscriptπœ‚π‘\eta_{p} and the peak field hpsubscriptβ„Žπ‘h_{p} as a function of y𝑦y at various ΟƒπœŽ\sigma for d(h​χZ​F​C/Ο‡0)β„Žsubscriptπœ’π‘πΉπΆsubscriptπœ’0(h\chi_{ZFC}/\chi_{0})/dhβ„Žh vs hβ„Žh, respectively. The peak height Ξ·psubscriptπœ‚π‘\eta_{p} shows a local maximum around y=0.05βˆ’0.06𝑦0.050.06y=0.05-0.06. The peak field Ξ·psubscriptπœ‚π‘\eta_{p} decreases with increasing y𝑦y. These features are independent of ΟƒπœŽ\sigma.

In summary, we obtain the following important features from the above numerical calculations. (i) The normalized ZFC susceptibility Ο‡Z​F​C/Ο‡0subscriptπœ’π‘πΉπΆsubscriptπœ’0\chi_{ZFC}/\chi_{0} vs y𝑦y has a broad peak at y=yb𝑦subscript𝑦𝑏y=y_{b}, forming the ybsubscript𝑦𝑏y_{b} vs hβ„Žh diagram. The value of ybsubscript𝑦𝑏y_{b} exhibits a local minimum and a local maximum for large ΟƒπœŽ\sigma (Οƒ>0.4𝜎0.4\sigma>0.4). (ii) The derivative d(h​χF​C/Ο‡0)β„Žsubscriptπœ’πΉπΆsubscriptπœ’0(h\chi_{FC}/\chi_{0})/dhβ„Žh vs hβ„Žh shows a very sharp peak around hβ„Žh = 0 at low y𝑦y. (iii) The derivative d(h​χZ​F​C/Ο‡0)β„Žsubscriptπœ’π‘πΉπΆsubscriptπœ’0(h\chi_{ZFC}/\chi_{0})/dhβ„Žh vs hβ„Žh shows a peak at the boundary of the ybsubscript𝑦𝑏y_{b} vs hβ„Žh diagram (h≃0similar-to-or-equalsβ„Ž0h\simeq 0). (iv) The monotonic increase of Ο‡F​C/Ο‡0subscriptπœ’πΉπΆsubscriptπœ’0\chi_{FC}/\chi_{0} with decreasing y𝑦y is seen below ybsubscript𝑦𝑏y_{b} for relatively large ΟƒπœŽ\sigma. With decreasing ΟƒπœŽ\sigma, Ο‡F​C/Ο‡0subscriptπœ’πΉπΆsubscriptπœ’0\chi_{FC}/\chi_{0} becomes flat below ybsubscript𝑦𝑏y_{b} like SG’s.

4 Discussion

Both the non-monotonic H𝐻H dependence for the ZFC-peak temperature Tbsubscript𝑇𝑏T_{b} [2, 7, 8, 11, 12] and the sharp peak of the derivative dM𝑀M/dH𝐻H have been observed in many SPM’s [5, 7, 9]. Several theories have been presented for the explanation of the maximum of Tbsubscript𝑇𝑏T_{b} at low H𝐻H [8, 11, 15] including the theories based on the NΓ©el-Brown model [13, 14] and the resonant spin tunneling theory [6, 15]. The peak of Tbsubscript𝑇𝑏T_{b} at small H𝐻H in Mn12O12(CH3COO)16(H2O)4 (denoted as Mn12) [6] and ferritin [9] may be explained in terms of thermally assisted, field-tuned resonant tunneling between particles. However, this model may not be valid for the explanation of similar behaviors in SPM’s with Tbsubscript𝑇𝑏T_{b} which is too high for the quantum effect to appear.

In Sec.Β 3 we show that these features can be well explained in terms of the scaling form of Ο‡Z​F​C/Ο‡0subscriptπœ’π‘πΉπΆsubscriptπœ’0\chi_{ZFC}/\chi_{0} and Ο‡F​C/Ο‡0subscriptπœ’πΉπΆsubscriptπœ’0\chi_{FC}/\chi_{0}. The local minimum and local maximum of ybsubscript𝑦𝑏y_{b} vs hβ„Žh tends to disappear as ΟƒπœŽ\sigma becomes smaller. The non-monotonic behavior of ybsubscript𝑦𝑏y_{b} vs hβ„Žh is mainly due to the non-linearity of the Langevin function. The curvature of ybsubscript𝑦𝑏y_{b} vs hβ„Žh is strongly dependent on ΟƒπœŽ\sigma. It is interesting to discuss where the nonlinearity of the Langevin function is significant in the ybsubscript𝑦𝑏y_{b} vs hβ„Žh diagram. Note that Ο‡Z​F​C/Ο‡0subscriptπœ’π‘πΉπΆsubscriptπœ’0\chi_{ZFC}/\chi_{0} is given by Eq.Β (35) using the Langevin function which is a function of

ΞΆ=(Ms​V)​H/(kB​T)=2​h​x/y,𝜁subscript𝑀𝑠𝑉𝐻subscriptπ‘˜π΅π‘‡2β„Žπ‘₯𝑦\zeta=(M_{s}V)H/(k_{B}T)=2hx/y, (38)

where x=V/⟨V⟩π‘₯𝑉delimited-βŸ¨βŸ©π‘‰x=V/\langle V\rangle, y=kB​T/(Kuβ€‹βŸ¨V⟩)𝑦subscriptπ‘˜π΅π‘‡subscript𝐾𝑒delimited-βŸ¨βŸ©π‘‰y=k_{B}T/(K_{u}\langle V\rangle), h=H/Hkβ„Žπ»subscriptπ»π‘˜h=H/H_{k}, and Hk=2​Ku/Mssubscriptπ»π‘˜2subscript𝐾𝑒subscript𝑀𝑠H_{k}=2K_{u}/M_{s}. Ms​Vsubscript𝑀𝑠𝑉M_{s}V is the magnetic moment of the particle of volume V𝑉V and Mssubscript𝑀𝑠M_{s} is its magnetization per unit volume. The nonlinearity is considered to appear when ΞΆ>1𝜁1\zeta>1. For convenience, we assume that x=1π‘₯1x=1, which means V=⟨VβŸ©π‘‰delimited-βŸ¨βŸ©π‘‰V=\langle V\rangle. Then ΢𝜁\zeta is approximated as ΞΆ=ΞΆ0=2​h/y𝜁subscript𝜁02β„Žπ‘¦\zeta=\zeta_{0}=2h/y. In Fig.Β 5(a), we make a plot of the straight lines denoted by the relation ΞΆ0=2​h/ysubscript𝜁02β„Žπ‘¦\zeta_{0}=2h/y, where ΞΆ0=1βˆ’8subscript𝜁018\zeta_{0}=1-8. It is clear that the local maximum and local minimum for each ΟƒπœŽ\sigma are located on the lines with ΞΆ0=1subscript𝜁01\zeta_{0}=1 and ΞΆ0=3βˆ’4subscript𝜁034\zeta_{0}=3-4, respectively. This implies that the nonlinearity of the Langevin function is crucial to the occurrence of the local maximum and local minimum. In the numerical calculation, Sappey et al. [8] have used the approximation of the Langevin function for ΞΆβ‰ͺ1much-less-than𝜁1\zeta\ll 1, which may lead to results inconsistent with our numerical results. We note that ybsubscript𝑦𝑏y_{b} with Οƒ>0.4𝜎0.4\sigma>0.4 exhibits a local minimum around h=0β„Ž0h=0 as shown in Fig.Β 5(a). This local minimum is located around the line given by ΞΆ0=1subscript𝜁01\zeta_{0}=1 in the ybsubscript𝑦𝑏y_{b} vs hβ„Žh curve with each ΟƒπœŽ\sigma. Experimentally Luis et al. [10] have reported that in natural horse-spleen ferritin the curve of Tbsubscript𝑇𝑏T_{b} vs H𝐻H exhibits a local minimum at H𝐻H = 0.5 kOe and a maximum at H𝐻H = 3 kOe. This result is qualitatively consistent with the results of our numerical calculation.

5 Conclusion

We show that remarkable features in the T𝑇T and H𝐻H dependence of the ZFC and FC susceptibility for SPM’s (nanopraticles) can be well explained by the present model. These behaviors arises mainly from the nonlinearity of Langevin function, but not due to the quantum tunneling effect.


Acknowledgments

We are grateful to Prof. C. J. Zhong and Dr. L. Wang for useful discussion on the structures of nanoparticles in SPM’s.

References

  • [1] J. A. Mydosh, Spin Glasses: An Experimental Introduction (Taylor & Francis, 1993, London).
  • [2] W. Luo, S. R. Nagel, T. F. Rosenbaum, and R. E. Rosensweig, Phys. Rev. Lett. 67, 2721 (1991).
  • [3] T. Bitoh, K. Ohba, M. Takamatsu, T. Shirane, and S. Chikazawa, J. Phys. Jpn. 64, 1305 (1995).
  • [4] S. Gider, D. D. Awschalom, T. Douglas, K. Wong, S. Mann, and G. Cain, J. Appl. Phys. 79, 5324 (1996).
  • [5] X. X. Zhang, J. M. Hemandez, J. Tejada, and R. F. Ziolo, Phys. Rev. B 54, 4101 (1996).
  • [6] J. R. Friedman, M. P. Sarachik, J. Tejada, and R. Ziolo, Phys. Rev. Lett. 76, 3830 (1996).
  • [7] J. R. Friedman, U. Voskoboynik, and M. P. Sarachik, Phys. Rev. B 56, 10793 (1997).
  • [8] R. Sappey, E. Vincent, N. Hadacek, F. Chaput, J. P. Boilot, and D. Zins, Phys. Rev. B 56 14551 (1997).
  • [9] J. Tejada, X. X. Zhang, D. del Barco, J. M. HernΓ‘ndez, and E. M. Chudnovsky, Phys. Rev. Lett. 79, 1754 (1997).
  • [10] F. Luis, E. del Barco, J. M. HernΓ‘ndez, E. Remiro, J. BartolomΓ©, and J. Tejada, Phys. Rev. B 59, 11837 (1999).
  • [11] H. Kachkachi, W. T. Coffey, D. S. F. Crothers, A. Ezzir, E. C. Kennedy, M. Nogues, and E. Tronc, J. Phys.: Condens. Matter 12, 3077 (2000).
  • [12] R. K. Zheng, H. Gu, B. Xu, X. X. Zhang, J. Phys.: Condens. Matter 18, 5905 (2006).
  • [13] L. NΓ©el, Compt Rend. (Paris) 228, 604 (1949).
  • [14] W. F. Brown Jr, Phys. Rev. 130, 1677 (1963).
  • [15] E. M. Chudnovsky, J. Mag. Mag. Mater. 185, L267 (1998).
  • [16] I.S. Jacobs and C.P. Bean, Magnetism Vol 3, p.271, edited by Rado and Suhl (Acadmic Press, Inc., New York, 1963).
  • [17] E. P. Wohlfarth, Phys. Lett. 70 A 489 (1979).
  • [18] E. P. Wohlfarth, Physica 86-88 B, 852 (1977).
  • [19] M. Knobel, W.C. Nunes, L.M. Socolovsky, E. De Biasi, J.M. Vargas, and J.C. Denardin, J. Nanoscience and Nanotechnology 8, 2836 (2008). See also references therein.
  • [20] M. Suzuki, S. I. Fullem, and I. S. Suzuki, Phys. Rev. B 79, 024418 (2009).
  • [21] J. R. L. de Almeida and D. J. Thouless, J. Phys. A 11, 983 (1978).