Multi-Wavelength View of Flare Events on November 20, 2003
Abstract
We analyze two flare events which occurred in active region NOAA 501 on November 20, 2003. The H and magnetogram measurements show interaction between two filaments which produced a slowly rising flare event, corresponding to two stages of magnetic reconnection. The relative clockwise rotation between the two sunspot systems caused filament destabilization. The cusp-shaped magnetic field in the main phase of the second flare and its evolution in correlation with ribbon separation provide evidence for the cause of the CME eruption. The propagation and orientation of the CME with respect to the ecliptic plane is illustrated by IPS images.
1 Flare events on November 20, 2003
The period of October–November 2003 is well known for its extreme solar activity, corresponding to ARs 484, 486 and 488 (Uddin et al. (2006)). The continuous emergence of magnetic flux in and around AR 501 (return of AR484, in the next rotation) also caused several intense flares. Here, we report two flare events (1N/M1.4 and 2B/M9.6) that occurred near N00 W05 on November 20, 2003. GOES soft X-ray measurements at 0.5–4 Å and 1–8 Å bands (Fig. 1) show a broad profile of gradual rise and decline for the event at 02:12 UT. However, the second event (peak at 07:47 UT) showed a quick rise in intensity and a gradual decrease. Before the start of the latter event, an impulsive flare (C3.8) was observed at 07:25 UT.

2 Re-organization of magnetic structures
H images were recorded at ARIES, Nainital, with a cadence of about 15–20 s (details in Joshi et al. (2007)). The high sampling rate allows us to follow the evolution of the complex twisted field structures in the chromosphere in relataion to the magnetic configuration in the photoshere seen on MDI images (Fig. 2). Before the onset of the first flare, a system of two filaments goes through a gradual evolution (Fig. 2 a-c, indicated by arrows) while they also approach each other at a speed of about 10 km s-1 (Fig. 3). The interaction between them triggers the energy release, during 01:50–02:10 UT and leads to field merging seen in the H images. The change in filament orientation after the energy release indicates a relaxed state of the magnetic configuration.


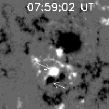

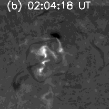
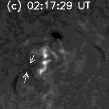


During 02:40–07:30 UT there was no significant activity at the flare site (Fig. 1). However, the energy buildup from 01:30 to 08:00 UT is revealed by the rotation of two sunspots of opposite polarity (the northern spot moving clockwise, the southern one anticlockwise) at the flare site (see arrows in the MDI images). During the onset of the second event at about 07:35 UT, the twisted filament system, with one footpoint attached to the sunspot group, goes through heavy destabilization and the filaments approach each other similarly as in the first event. The associated brightening, observed near the filament, suggests that reconnection occurred between twisted field lines and nearby small-scale fields. Furthermore, as the merging of the filaments progresses (Fig. 2 d–h), the flare brightness rose to maximum intensity (Fig. 1). The H images also revealed restructuring of the system after the flare maximum.


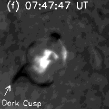
A dark cusp-shaped structure formed after the flare maximum (Fig. 2 f) and started to move upward. Its speed component in the plane of the disk was about 5–6 km s-1 during 07:45–07:50 UT (Fig. 3). At 07:51 UT, the cusp erupted and some part of it fell back. The interesting point is that the brightening observed along the flare ribbons and the rate of separation between the ribbons correlate well with the eruption rate of the cusp (Fig. 3). The high correlation (about 93%) suggests that the magnetic reconnection and the rise of the filament system played a prime role in the initiation of the coronal mass ejection (CME). After the flare, the filament system returned to its original, relaxed state.
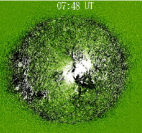
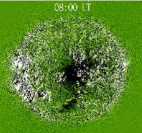
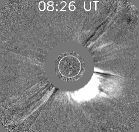
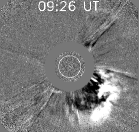
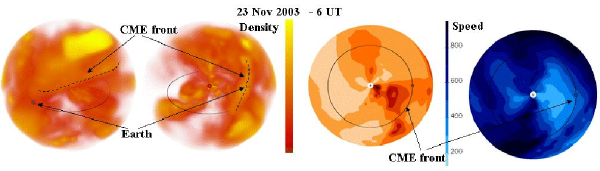
Fig. 4 shows EIT and LASCO images taken at the time of the CME onset. The CME was tracked further out using the interplanetary scintillation (IPS) technique, which shows the geometry of the CME while crossing the Earth’s magnetosphere.
3 Results and discussion
This multi-wavelength study provides evidence that opposite rotation of opposite polarity regions plays a crucial role in building the magnetic energy required for the flare process. Sunspot rotation is the primary driver of helicity production and injection into the corona (Tian et al. (2006), van Driel-Gesztelyi et al. (2002)). Newly emerging flux plays a major role in the destabilization of filaments. The cusp shape suggests the formation of a magnetic null point in the high corona (Manoharan et al. (2003)). The correlation between the separation of flare ribbons and the expansion of the cusp structure indicates that large-scale reconnection and particle acceleration occurred during the cusp eruption. The IPS technique shows that the flux rope is oriented about 70∘ with respect to the ecliptic plane. Therefore, in spite of a strong shock, the Earth-directed CME caused only a moderate storm (Dst -85 nT) at the Earth.
Acknowledgements.
SOHO (EIT, LASCO, and MDI images) is a project of international cooperation between ESA and NASA. PKM acknowledges the partial support for this study by CAWSES-India Program, which is sponsored by ISRO.References
- Joshi et al. (2007) Joshi, B., Manoharan, P. K., Veronig, A. M., Pant, P., Pandey, K. 2007, Solar Phys., 242, 143
- Manoharan et al. (2003) Manoharan, P. K., Kundu, M. R. 2003, ApJ, 592, 597
- Tian et al. (2006) Tian, L., Alexander, D. 2006, Solar Phys., 233, 29
- Uddin et al. (2006) Uddin, W., Chandra, R., Ali, S. S. 2006, JAA, 27, 255
- van Driel-Gesztelyi et al. (2002) van Driel-Gesztelyi, L., Schmieder, B., Poedts, S. 2002, ESA SP-477, 47