Accessing the Néel phase of ultracold fermionic atoms in a simple-cubic optical lattice
Abstract
We examine the phase diagram of a simple-cubic optical lattice half-filled by two species of fermionic atoms with a repulsive -wave contact interaction. We use the Hartree approximation in the regime of weaker interactions, and a Hubbard model approximation in the Mott insulating phase. The regime where the Néel phase of this system is likely to be most accessible to experiments is at intermediate lattice strengths and interactions, and our two approximations agree fairly well in this regime. We discuss the various issues that may determine where in this phase diagram the Néel phase is first produced and detected experimentally, and analyze the quantum phases that occur in the intermediate lattice strength regime.
pacs:
71.10.Ca, 71.10.Fd, 71.10.Hf,37.10.JkOne of the next notable milestones in the production of new strongly-correlated states of ultracold atoms is expected to be the antiferromagnetic Néel phase of two hyperfine species of fermionic atoms in an optical lattice duan ; bloch . Important progress towards this goal includes the recent realization of the Mott insulating phase with fermions jordens ; schn , and the demonstration of controllable superexchange interactions in an optical lattice, albeit with bosonic atoms trotsky . The interest in experimentally realizing this Néel phase is partly because it is a natural next step in developing an ultracold-atom quantum “simulator” of the fermionic Hubbard model with repulsive interactions, which is one of the prototypical models in strongly-correlated quantum condensed-matter physics. As we will argue, if the objective is to access a phase with antiferromagnetic order, then it may be favorable to explore the regime of an optical lattice of intermediate depth, where the effective Hamiltonian is more than just the standard one-band Hubbard model. The low temperature phase diagram in this regime is worth exploring in its own right, as a new, interesting, and hopefully experimentally accessible quantum many-body system.
An outline of our paper is as follows: first we review the physics of two-species fermions in an optical lattice, with the interactions tuned by a nearby Feshbach resonance. We then describe the Hartree approximation which captures the ground-state phase diagram, and use this calculation to estimate the line in the phase diagram along which antiferromagnetic interactions are strongest. For another approach to parts of the same phase diagram, we map the system onto a lattice Hubbard model, which is appropriate for a strong lattice potential, and study which terms dominate the Hamiltonian as one weakens the lattice away from the strong lattice regime. We also estimate the Néel temperature in this strong-lattice approach, and show that it is maximized along a line in the phase diagram that agrees well with the line of maximal exchange interactions estimated using the Hartree approximation. Finally, we discuss experimental issues such as equilibration, Feshbach molecule formation, and the size of the Mott phase in a trap.
I The model
We consider the model that experimentalists are focusing on, which consists of two hyperfine species of fermionic atoms of mass in a simple-cubic optical lattice with lattice spacing and a single-atom optical potential of the standard form bloch :
| (1) |
Atoms of opposite species interact repulsively with a contact (-wave) interaction, whose strength can be adjusted by tuning the applied magnetic field relative to a nearby Feshbach resonance, and can be quantified by the atom-atom scattering length in the absence of the lattice. We call these two states “up” and “down” and treat them as the two states of a spin-1/2 degree of freedom. The -wave repulsive interaction is only between atoms of opposite spin. To lowest order in , this 2-atom interaction is the standard regularized contact potential Huang ,
| (2) |
where is the distance between the two atoms. We will work in the thermodynamic limit of this model at half filling, and we are particularly interested in the Mott insulating phase.
This system is appealing because it behaves effectively like a one-band Hubbard model at large , with on-site repulsive interaction and nearest-neighbor hopping matrix element , so that experiments may eventually resolve long-standing questions about the Hubbard model. However, as is lowered one eventually reaches an intermediate lattice-strength regime where higher bands can no longer be neglected. To address this portion of the phase diagram, we use the self-consistent Hartree approximation, which includes admixtures of the single-atom states in higher bands.
II Hartree approximation
When considering the regularized contact potential in mean-field theory, there is no exchange term, implying that the Hartree and Hartree-Fock approximations are identical here. The total effective potential “seen” by the atoms with in the Hartree approximation is thus
| (3) |
where is the number density of atoms with at position .
For each point in the ground-state phase diagram, specified by the lattice intensity and the interaction , we solve the Hartree equations numerically by discretizing them in momentum space, and iteratively achieving self-consistency. We obtain up to 3 different low energy self-consistent Hartree many-body states at density one atom per lattice site, and determine which state is of the lowest energy and thus is the Hartree ground state. In the paramagnetic state we impose the constraints at all , where is any nearest neighbor vector of the simple cubic lattice. This paramagnetic Hartree state exists for all values of and , since this constraint is preserved by the iterations. In this state the lowest Hartree bands are always partially occupied, so there are Fermi surfaces. For the Néel antiferromagnetic state we impose only the constraints , thus permitting two-sublattice Néel order. At weak enough lattice and interactions, the only self-consistent Hartree state is in fact a paramagnetic state, i.e. it has no magnetic order. When an ordered Néel state exists, it can be either Mott insulating, with the lowest Hartree bands full and a Mott-Hubbard gap to the next bands, or the two lowest Hartree bands for each species can overlap in energy and each be partially occupied, with Fermi surfaces. We also look at ferromagnetic states that have different densities of and atoms but do not break the discrete translational symmetries of the lattice. Again, there is a portion of the phase diagram where there is no self-consistent ferromagnetic state. And when there is such a state, it can be either a band insulator or have Fermi surface(s), and it can be either fully or partially spin-polarized. In the latter case (PPF in Fig. 1) there are 3 partially occupied Hartree bands. In these candidate Hartree ground states, the fermions occupy only the lowest Hartree bands, but in terms of free noninteracting fermions, we have included states extending out to many Brillouin zones and thus the Hartree states are admixtures of multiple bands of the noninteracting system. Specifically, for the parameters in Fig. 1, a grid of momentum points in each Brillouin zone and a grid of zones was enough to achieve convergence everywhere.
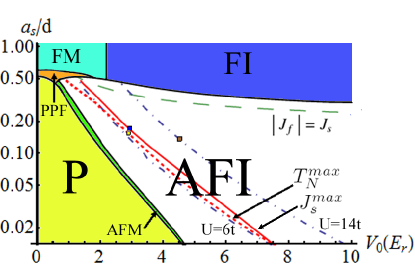
The resulting ground-state Hartree phase diagram of this system is presented in Fig. 1. At any lattice strength, the paramagnetic Fermi liquid phase exists at weak enough interaction. At strong interaction, the Hartree approximation always produces a ferromagnetic ground state, due to the classic Stoner instability. The ferromagnetic phase is a band insulator for , with a band gap above the filled lowest fully spin-polarized band. For the lowest two bands for the majority-spin atoms overlap and there is instead a ferromagnetic Fermi liquid. We show this ferromagnetic part of the phase diagram for completeness, but it is important to emphasize both that the Hartree approximation is not to be trusted at such strong interactions, and that systems of ultracold fermionic atoms are likely to be highly unstable to Feshbach molecule formation when brought this close to the Feshbach resonance. Thus we do not expect such a ferromagnetic phase to be experimentally accessible for these systems, even if it does exist in a model that ignores the instability towards Feshbach molecules. Finally, for lattices above a certain minimum strength there is a Néel-ordered ground state at intermediate values of the repulsive interaction. This Néel state is a Mott insulator over most of the phase diagram, and becomes an antiferromagnetic Fermi liquid over a small sliver of the phase diagram at weak lattice and weak interaction between the paramagnetic and Mott insulating phases. It is in this lower (smaller ) portion of the phase diagram where we believe the Hartree approximation is qualitatively correct, producing the paramagnetic and antiferromagnetic Fermi liquid phases and the Mott insulating Néel phase.
To quantify the energy scale associated with Néel ordering in the antiferromagnetic phase, we (crudely) estimate the nearest-neighbor antiferromagnetic exchange by taking to be the energy difference per bond between the Hartree antiferromagnet and ferromagnet (at low and/or , the ferromagnet has zero magnetization, so is really the paramagnet). For each given interaction , we locate the lattice intensity where this Hartree estimate of has its maximum, and indicate these maxima by the red (full) line marked in Fig. 1. It is somewhere near this line that antiferromagnetic interactions are strongest, and the Néel phase survives to the highest temperature. The overall global maximum in this estimate of occurs at and , where is the “recoil energy”. This point is marked with a small square on the full red line in Fig. 1.
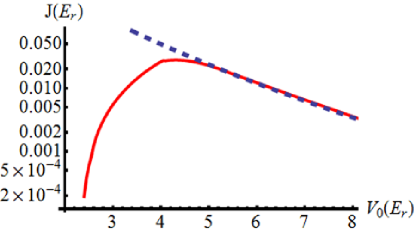
As an example, in Fig. 2 we show our Hartree estimate of vs. at , which is the largest interaction explored experimentally in the study of ref. jordens , although these experiments only reached temperatures far above those of the Néel phase. In Fig. 2 we also plot the estimate of from a strong lattice expansion which we discuss in the next section, and it coincides well with the Hartree estimate for .
The line in Fig. 1 where the Hartree estimate of is maximal not only indicates roughly where is maximized, but it also occurs at the location of a crossover in the nature of the antiferromagnetic state. In the regime of larger and , the system is a “local moment” magnet: almost every well of the optical lattice is occupied by a single atom with a “spin”, with very few wells either empty or multiply-occupied. Here we can make a Hartree ferromagnet as well as an antiferromagnet and compare their energies to obtain our estimate of . In fact we could make many other metastable magnetic Hartree states with ordering at essentially any momentum in the Brillouin zone. Here is primarily a superexchange interaction , and it increases as the lattice depth is reduced (see Fig. 2), since this increases the hopping between wells and reduces the interaction between two unlike atoms in the same well.
In contrast, the regime of the antiferromagnetic phase that is at lower and near the paramagnet is not a local-moment regime, but instead is a spin density wave (SDW). Here one can make a magnetically-ordered Hartree state only at momenta near those that cause substantial Fermi-surface nesting, which is initially only near the corners of the first Brillouin zone. In this regime we do not have a ferromagnetic Hartree state and our estimate of is obtained by subtracting the energy of the Néel state from the paramagnet, so this should not be interpreted simply as a spin-spin interaction. We now understand why this estimate of increases with increasing (see Fig. 2), since this increases the interaction that causes the magnetic ordering, and decreases the hopping that favors the paramagnetic Fermi liquid. The effective is maximized at the crossover between the SDW and local moment regimes. This crossover shows up in the metastable ferromagnetic Hartree state as two closely-spaced phase transitions between un-, partially-, and fully-polarized.
III Strong lattice expansion
We now proceed to mapping our system onto a lattice Hubbard model, which is an appropriate description at deep lattice. This mapping uses the single-atom Wannier orbitals as the basis states kohn ; duan ; werner . The standard one-band Hubbard model includes only the lowest-energy Wannier orbital at each lattice site as its Hilbert space, and neglects all terms in the Hamiltonian except for nearest-neighbor hopping and on-site interaction between different hyperfine states in the lowest band.
The single-atom optical-lattice potential (1) that we consider is a separable potential, so the energy eigenstates of a single atom in this potential can be chosen to be the product of one-dimensional (1D) eigenstates along each direction. We solve for these 1D bands, and use the gauge degree of freedom in the definition of Wannier states to minimize the spatial variance of their probability distributions. Thus we obtain the normalized wavefunctions of the maximally-localized 1D Wannier orbitals for each band () kohn . The 3D Wannier orbitals are then .
Since our focus here is on the Mott insulator with density one atom per lattice site, low temperature and fairly strong lattice , the atoms will primarily be in the lowest band, . The nearest-neighbor hopping matrix element in this noninteracting single-atom band is a strongly decreasing function of , the lattice strength, behaving as for large werner . The wavefunction of the lowest Wannier orbital at a given lattice site has its maximum amplitude at , the center of that well of the optical lattice, while its amplitude changes sign and is of smaller magnitude in the nearest-neighbor wells.
The antiferromagnetic Mott insulator occurs in the regime where the on-site repulsive interaction is stronger than the hopping . The expectation value of this interaction energy for two atoms of opposite spin occupying the same lowest Wannier orbital is our first estimate of the strength of the on-site interaction in the corresponding one-band Hubbard model:
| (4) |
In the Hubbard model, when adjacent sites and are each singly-occupied by atoms with the same spin, then the hopping between those two sites is Pauli-blocked. When these adjacent sites are each singly-occupied by opposite spins, then virtual hopping between these sites, treated in second-order perturbation theory, allows them to lower their energy and thus generates the antiferromagnetic superexchange interaction with .
The leading corrections to the Hubbard model approximation to our system in the regime of interest are due to the interactions between atoms of opposite spin occupying lowest Wannier orbitals on nearest-neighbor sites and . By expanding fully the interaction term in the Wannier basis, and evaluating all the terms, one can show that the most important term in limiting the Néel phase is the “direct” interaction trotsky
| (5) |
between atoms of opposite spin in adjacent orbitals. This term is due to the overlap of the probability distributions of adjacent Wannier orbitals. It raises the energy of the Néel state, and thus produces a direct ferromagnetic exchange interaction with that partially cancels the antiferromagnetic superexchange that occurs in the Hubbard model. It is primarily this ferromagnetic interaction that stops and reverses the increase in the net antiferromagnetic interaction as one moves towards stronger interaction and a weaker lattice while staying near the values of the lattice strength that maximize . At the global maximum of , indicated in Fig. 1, we find . Another (small) effect of that we include is that it changes the effective on-site Coulomb interaction in the antiferromagnetic Mott phase, leading to an effective interaction .
For large enough this direct ferromagnetic exchange is stronger than the superexchange and thus we have the ground-state phase transition to the ferromagnetic phase, as indicated in Fig. 1. We see in Fig. 1 that the line where is close to the line where the Hartree calculation also signals this phase transition. If this transition is real, further-neighbor interactions might cause other magnetically-ordered phases to occur near it in the phase diagram, but this is an issue that we do not explore here, since we expect that this portion of the phase diagram will not be accessible to cold-atom experiments, as discussed above.
The next leading correction to the Hubbard model is an additional hopping term of the same sign as , sometimes called correlated hopping in the literature werner ,
| (6) |
when the two sites are each singly-occupied by opposite spins. The effective hopping that enters in the superexchange process at this level of approximation is thus . More generally, the hopping matrix element for an atom with hopping between nearest-neighbor sites and is , where here is the total number of atoms with on sites and .
Summarizing, once we include these leading effects due to the nearest-neighbor interaction, the effective Hamiltonian in the vicinity of the antiferromagnetic ground state of the half-filled Mott insulator has hopping , an effective on-site interaction , and an additional ferromagnetic nearest-neighbor exchange interaction when both sites are singly-occupied. [We note in passing that there are other condensed matter systems which behave effectively like a Hubbard model with ferromagnetic interactions, such as Kotliar .] We can use this approximation to produce an estimate of for each point in the Mott insulating regime of our phase diagram, and we indicate in Fig. 1 the lines along which and .
Now that we have our effective model, we use it to determine which values of the parameters will maximize the robustness of the antiferromagnetic Mott phase. To that end, we start by looking at the Quantum Monte Carlo simulations staudt of the simple-cubic fermionic Hubbard model, which show that for a given , the critical temperature for the Néel phase is maximized near . From Fig. 1, we learn that the line along which , as estimated from the Hubbard-model approximation is in reasonably good agreement with the location of the maximum as estimated in the Hartree approximation. Thus we can hope to start from the QMC result for , and study perturbative corrections to it using the strong-lattice expansion, to obtain a reasonable approximation to four our model.
To estimate the Néel temperature of our system we propose the following approximation: For the Hubbard model without , we have estimates of its Néel temperature from quantum Monte Carlo simulations staudt . In the regime of interest, this Néel ordering is due to the antiferromagnetic superexchange interaction between neighboring singly-occupied sites. When we include the magnetic interaction is reduced, and we will approximate the resulting reduction of as being simply in proportion to the reduction of the total nearest-neighbor exchange interaction:
| (7) |
This approximation is certainly accurate for large , where the system is well-approximated by the Heisenberg antiferromagnet. By using this approximation at the maximum of near , we are assuming that the reduction there by roughly a factor of 2 of from its Heisenberg value staudt is mostly due to the dilution of the Heisenberg antiferromagnet by nonmagnetic empty and doubly-occupied sites and not due to a large change in the superexchange interaction between singly-occupied sites.
Using eq. (7), we can maximize as a function of for each value of . The resulting “optimal” values of are indicated by the dashed red line in Fig. 1. The line of maximal we obtain this way is quite close to the full red line along which the Hartree estimate of is maximized. The global maximum of this estimate of (marked by a small square on the line in Fig. 1) also coincides well with the global maximum of the Hartree . Thus we see that in this regime these two approximations agree rather well, suggesting that these estimates are indeed to be trusted. We also show the line along which ; this is near where DMFT calculation show the critical entropy to be maximal werner . Along this line the maximum in also occurs near .
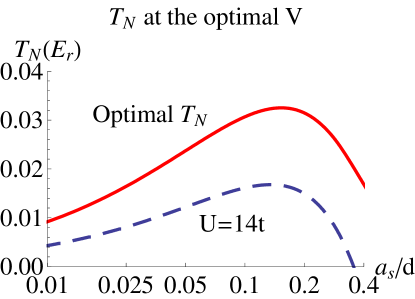
In Fig. 3 we show as a function of at the value of that maximizes our estimate of , as well as at the value of that gives and thus is near the maximum of as estimated in DMFT werner . Note that in Fig. 3 the horizontal scale for is logarithmic, so drops rather weakly as is reduced. This means that if the optimal value of can not be reached due to Feshbach molecule formation, this may not “cost” very much in terms of the suppression of . On the other hand, increasing can produce a substantial decrease in : it drops by about a factor of two between its maximum at and . For 6Li and nm, the overall maximum of is a temperature of about 40 nK.
The strong lattice approximations we have used here are those appropriate for the antiferromagnetic Mott insulator, and are based on the inequalities on energy scales , where is the expectation value of the single-particle energy in a lowest Wannier orbital. By calculating higher order terms, we can check the reliability of the estimates coming from this strong lattice expansion. We do find that this expansion is beginning to break down in the vicinity of the parameter values that maximize . Thus, although we expect these approximations to give reasonably reliable rough estimates of the maximal values of , there are many higher-order effects that we are ignoring that may alter these estimates (our calculations suggest on the level). At the maximum of , is about 25% of . The correction to due to is also of roughly this size, but its dependence on is much weaker, which is why is the important actor in setting the maximum in .
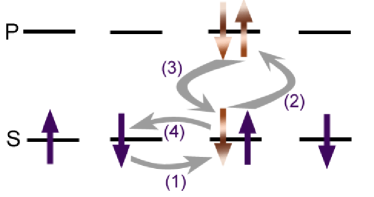
We have analyzed in perturbation theory many corrections beyond those included above. We find that at the maximum of (both the global maximum and the maximum along the line) the strongest next correction is the fourth-order process illustrated in Fig. 4; it alters the effective by about 10%.
| Global maximum | Maximum | |
| of | of at | |
| 4.2 | 5.5 | |
| 0.9 | 1.3 | |
| 0.11 | 0.07 | |
| 0.02 | 0.02 | |
| 0.08 | 0.03 | |
| -0.02 | -0.008 | |
| correction | 0.007 | 0.004 |
We have seen that our two approaches give consistent results in the region of intermediate lattice strength. We now briefly discuss possible improvements on what we report here. Since our perturbatively-based approximations may be breaking down near this regime of interest where is maximized, it would be nice to have a more systematic approach that can obtain more precise and reliable estimates of the phase diagram in this regime. For example, quantum Monte Carlo simulations might be possible at this maximal , although of course the famous fermionic “minus signs” may prevent this from being feasible in the near term. Another approach would be a systematic correction of the Hartree calculation.
Since our calculations are in the thermodynamic limit, we are assuming that finite-size effects do not substantially shift the transition at or alter the ground-state phase diagram. The experiments use clouds of well over atoms jordens , so this should be true unless a trap of extreme aspect ratio is used that reduces a linear dimension of the Mott domain to well under .
IV Experimental consequences
We are now in a position to discuss the experimental consequences of the calculations above. The assumption usually found in the literature is that experiments will be able to evolve the system adiabatically, and that the natural variable is therefore the entropy, instead of the temperature. We would like to point out some caveats to this.
The system must be cooled to low temperature and thus low entropy , and equilibrated at the point in the phase diagram that is being measured. This cooling may be done under some other conditions (e.g., with the lattice turned off and other parameters optimized for cooling), with the “pre-cooled” system then moved adiabatically to the conditions of interest for measurement duan ; werner ; dare ; koetsier ; snoek ; deleo . For this to work, the time scales of the system must be such that this can be done without strongly violating adiabaticity. For the Néel phase of the Mott insulator, this will limit how small the hopping energy and the antiferromagnetic superexchange interaction can be, since the system must be able to remain near equilibrium, adiabatically rearranging the atoms so that there is one atom per lattice site and these atoms are antiferromagnetically correlated. Alternatively, the system might be actively cooled under the conditions of measurement, but this again requires the system to be able to equilibrate under those conditions. Thus, either way, this constraint limits equilibrium access to the strong-lattice portion of the phase diagram, where the exchange and/or hopping are too slow to allow equilibration and adiabaticity. Thus the Néel phase is going to be most accessible to experiment in some regime of intermediate lattice strength . These considerations may also limit how large the interaction can be made, since strong repulsion suppresses the superexchange rates and thus can limit spin equilibration in the Mott insulating phase.
Another constraining issue is that as one approaches the Feshbach resonance from the repulsive side, two atoms will interact repulsively only as long as they scatter in a way that is orthogonal to the molecular bound states. Thus the atoms must remain metastable against forming Feshbach molecules. In the absence of the lattice, the rate of molecule formation grows as as the Feshbach resonance is approached petrov . This will limit how large the interaction can be made, in a way that is presumably less of a constraint as the lattice is made stronger so that it keeps the atoms apart.
As we mentioned earlier, the DMFT estimate of the maximum of is near werner . In fact, the maximum in is rather weak, being only a little higher than that of the Heisenberg limit . Thus one might more usefully say that the critical entropy is nearly maximized for any . As we can infer from Fig. 1, occurs at relatively large and , and the issues raised above may force experiments away from the maximal entropy line, and towards the line where the exchange interactions and are maximized.
So far we have assumed an homogeneous system, but the trapping potential is actually nonuniform, which leads to inhomogeneity of the local equilibrium state in the trap. The spatial size of the region occupied by the antiferromagnetic Mott phase will increase with increasing , since increases the Mott “charge” gap. This effect means larger should favor detection of the Néel phase; of course the optimal will be some compromise between this and the other issues discussed above. Using our Hartree calculation to obtain the charge gap in the Mott phase, we find within the local-density approximation (LDA) that at the point in the phase diagram where is maximized, the Mott phase should occupy about half of the linear size of the trap. This is encouraging, but the Hartree approximation likely overestimates the Mott gap, as the true gap should be renormalized downwards by spin fluctuations.
Finally, we come to novel experimental predictions that result from our calculations. The Hartree calculation predicts that there is interesting and as yet unexplored physics at low to intermediate lattice strength, and weak coupling. We mentioned already that the effective model at around optimal values of and is that of a Hubbard model with ferromagnetic correlations, which is interesting in its own right. The different phase boundaries that we uncovered may also be worth exploring. For example, the quantum phase transitions between the Mott and metallic Néel phases and the paramagnet occur in parameter regimes that are quite accessible to the experiments, although it may not be possible to see their effects at accessible temperatures, since decreases strongly as this weak-coupling regime is approached.
V Conclusion
We have shown that to maximize antiferromagnetic interactions for fermionic atoms in an optical lattice one must explore the regime of intermediate lattice depths, where the system has significant deviations from the standard one-band Hubbard model. We have found that the nearest-neighbor direct ferromagnetic exchange is the most important correction to the Hubbard model that limits the maximal exchange , and therefore the maximal Néel temperature .
There are also higher-order corrections to the Hubbard model: virtual hopping into higher bands and other higher-order processes. The relative contribution of the higher-order corrections in the vicinity of the optimal drops exponentially as one goes to smaller interaction and thus a larger . Thus our perturbative calculation should yield accurate results in the large (strong lattice) regime.
We included a subset of all higher-order corrections via a Hartree calculation, and used it to find an estimate of the line where the exchange is maximized. This line coincides well with the line where our estimate of is maximized, obtained by using quantum Monte Carlo results and the strong lattice expansion.
For quantitatively more accurate results in the intermediate lattice depth regime, one needs to resort to more systematic quantum calculations. Of course this is a system of many fermions, so it is not clear whether this regime can be accurately treated in some form of quantum Monte Carlo simulations.
Experiments on these systems still need to reduce the temperature by a substantial factor before they are able to access magnetically ordered phases of fermions in optical lattices. Once they bridge this gap, our results above suggest that the Néel phase will be most accessible in the intermediate lattice strength regime. If that is the case, then this “quantum simulator” should be able teach us about more than just the standard one-band Hubbard model.
VI Acknowledgements
We thank Randy Hulet for many discussions, and Meera Parish for helpful suggestions. We also thank Roberto Car and Xifan Wu for advice on setting up the Hartree calculation. Part of this paper has been posted earlier as arXiv:0805.1507. This work was supported under ARO Award W911NF-07-1-0464 with funds from the DARPA OLE Program.
References
- (1) W. Hofstetter, J. I. Cirac, P. Zoller, E. Demler, and M. D. Lukin, Phys. Rev. Lett. 89, 220407 (2002); L.-M. Duan, E. Demler, M. D. Lukin, Phys. Rev. Lett. 91, 090402 (2003).
- (2) For a recent review, see I. Bloch, J. Dalibard and W. Zwerger, Rev. Mod. Phys. [in press]; arXiv:0704.3011.
- (3) R. Jördens, N. Strohmaier, K. Günter, H. Moritz and T. Esslinger, Nature 455, 204 (2008).
- (4) U. Schneider, L. Hackermuller, S. Will, Th. Best, I. Bloch, T. A. Costi, R. W. Helmes, D. Rasch and A. Rosch, Science, 322, 1520 (2008).
- (5) S. Trotzky, P. Cheinet, S. Folling, M. Feld, U. Schnorrberger, A. M. Rey, A. Polkovnikov, E. A. Demler, M. D. Lukin and I. Bloch, Science 319, 295 (2008).
- (6) F. Werner, O. Parcollet, A. Georges and S. R. Hassan, Phys. Rev. Lett. 95, 056401 (2005); A. Georges, arXiv:cond-mat/0702122.
- (7) A.-M. Dare, L. Raymond, G. Albinet and A.-M. S. Tremblay, Phys. Rev. B 76, 064402 (2007).
- (8) A. Koetsier, R. A. Duine, I. Bloch and H. T. C. Stoof, Phys. Rev. A 77, 023623 (2008).
- (9) M. Snoek, I. Titvinidze, C. Toke, K. Byczuk and W. Hofstetter, New J. Phys. 10, 093008 (2008).
- (10) L. De Leo, C. Kollath, A. Georges, M. Ferrero and O. Parcollet, arXiv:0807.0790.
- (11) D. S. Petrov, Phys. Rev. A 67, 010703(R) (2003).
- (12) K. Huang and C.N. Yang, Phys. Rev. 105, 767 (1957).
- (13) W. Kohn, Phys. Rev. 115, 809 (1959).
- (14) R. Staudt, M. Dzierzawa and A. Muramatsu, Eur. Phys. J. B 17, 411 (2000).
- (15) R. Chitra and G. Kotliar, Phys. Rev. Lett. 83, 2386-2389 (1999).