Scaling of the Strain Hardening Modulus of Glassy Polymers with the Flow Stress
Mark O. Robbins
Department of Physics and Astronomy, Johns Hopkins University, Baltimore, MD 21218
Robert S. Hoy
Materials Research Laboratory, University of California, Santa Barbara, CA 93106
Dated: April 20, 2009
ABSTRACT: In a recent letter, Govaert et al. examined the relationship between strain hardening modulus and flow stress for five different glassy polymers. In each case, results for at different strain rates or different temperatures were linearly related to the flow stress. They suggested that this linear relation was inconsistent with simulations. Data from previous publications and new results are presented to show that simulations also yield a linear relation between modulus and flow stress. Possible explanations for the change in the ratio of modulus to flow stress with temperature and strain rate are discussed.
Keywords: amorphous; glassy polymers; mechanical properties; strain hardening; thermoplastics; yielding
INTRODUCTION
The response of polymers to large strains plays a key role in determining their failure mode and mechanical performance. Strain hardening, an increase in stress with increasing strain, makes it more difficult to deform regions that have already yielded. This spreads deformation to new regions, preventing the localization of strain that would lead to brittle fracture.
Many experimental measurements of strain hardening have been interpreted in terms of an entropic network model 1 based on rubber elasticity theories.2 The idea is that the entanglements between chains act like chemical crosslinks. The increase in stress is attributed to the decrease in entropy as the chain segments between these effective crosslinks are stretched. While this theory describes the functional form of stress-strain curves, the magnitude of the rate of stress increase, or hardening modulus , is hard to understand from this model.3, 4 Assuming that the entanglement density is comparable to that in the melt, the hardening modulus should be comparable to the melt plateau modulus near , and decrease with decreasing temperature. Instead is typically two orders of magnitude larger than and increases with decreasing .
In a series of recent papers,5, 6, 7 we have used molecular simulations to probe the origins of strain hardening. The microscopic behavior is not consistent with the entropic network model. Instead, strain hardening is directly related to the rate of plastic rearrangements needed to maintain chain connectivity. The scale of the hardening modulus is thus set by the flow stress rather than entropic stresses. In both these simulations 5, 6, 7 and experiments, 3, 8, 9 the values of and are of the same order of magnitude and both increase with decreasing temperature. Our simulations used a coarse-grained bead-spring model,10 but qualitatively similar behavior is observed with more realistic potentials.11 A recent microscopic theory of glassy polymers also leads to similar scaling of plastic flow and hardening stresses.12
Motivated by these studies, Govaert et al.13 examined the hardening modulus and flow stress of five different glassy polymers over a range of rates and temperatures. They found a very interesting linear relationship between and
| (1) |
for all the polymers studied. Unfortunately they took our statement that the yield stress sets the scale of the hardening modulus to mean that the ratio of hardening modulus to yield stress is strictly constant, and thus argued that the observation of a nonzero seemed inconsistent with our results. This is not the case, but their work has inspired us to re-examine the relation between and .
In this paper we compare previously published simulation results 5, 6, 7 and new data to the experimental data shown by Govaert et al..13 All simulations are consistent with Eq. 1, and is not in general zero. The implications of Eq. 1 as the temperature approaches the glass transition temperature are discussed, as well as possible origins for due to variations in thermal activation with strain.
SIMULATION METHODS
The simulations follow the methodology described in our previous papers.5, 6, 7 A generic bead-spring model 10 that describes the coarse-grained behavior of polymers is used. Each polymer contains spherical beads that interact with a truncated and shifted Lennard-Jones (LJ) potential . The binding energy and molecular diameter are used to define our units. The unit of time , where is the bead mass.
Adjacent beads along the chain are coupled with the finitely extensible nonlinear elastic (FENE) potential, , which prevents chain crossing and scission. The standard 10 values and are employed, giving an equilibrium bond length . The entanglement density is varied by adding a bending potential to change the chain stiffness. This potential, , where is the angle between consecutive covalent bond vectors. Increasing from 0 to changes the number of monomers per entanglement length from about 70 to 20.14, 15
Cubic samples with chains and periodic boundary conditions are equilibrated using the double-bridging-MD hybrid (DBH) algorithm.16 A uniaxial compression is applied along the axis while maintaining zero stress along the transverse directions.17 The stretch , where is the period along the direction and is the initial value. A constant true strain rate is applied. The stress along the compressive axis is plotted against the Green-Lagrange strain , since the slope of this curve corresponds to the hardening modulus in entropic models and experimental analysis: .
The strain rates used here range from to . Over this range we find no qualitative change in behavior, just a roughly logarithmic shift in stress with rate that is also seen in many experiments18 and is consistent with activated models20 for flow stress. Since mappings of the bead-spring model to real systems give in the picosecond to nanosecond range (e. g. 66ps for PE10), the slowest rates used here overlap with the highest rates accessible in experiments ( to ).19, 21
In both simulations and experiments, the initial yield behavior is sensitive to the age and preparation of the glassy system.1, 22 Shear rejuvenates the system and the behavior for is fairly independent of past history. Experimental data typically show a large initial yield stress followed by strain softening. There is then a minimum stress before strain hardening sets in. Govaert et al. associated this minimum stress with the flow stress.13 The value of at the minimum varies between about 0.5 and 1 with polymer and temperature, and the stress is fairly constant over this range of . In our simulations, the glass has not generally been aged long enough to produce significant strain softening. There is an initial elastic increase in stress followed by a nearly constant plateau. We identified the stress at a point near the end of this plateau with the flow stress. This is close to the minimum in the stress for simulations that do show strain softening.
Since the experiments and simulations deal with compression, the stress along the compressive axis is negative. Following Govaert et al. we will take as a positive number equal to the magnitude of the stress. As in Ref. 5, the value of was obtained from a linear fit to as a function of from to -3.
RESULTS AND DISCUSSION
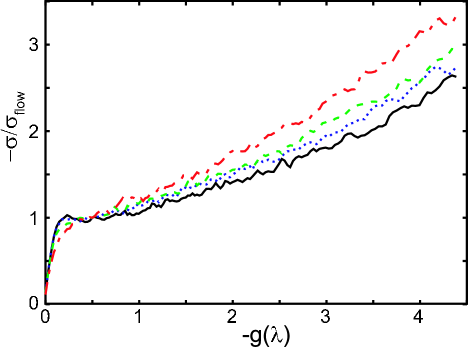
Figure 1 shows plots of for several temperatures and a fixed . Note that these normalized curves show an increase in slope with increasing , implying that the ratio increases with increasing temperature. Using a value of other than 0.5 to define the flow stress would not change this trend. Govaert et al. found a similar increase for poly(ethylene terphthalate)-glycol (PETG) and a smaller increase for polystyrene (PS).13 The trend with temperature had the opposite sign for polycarbonate (PC) and poly(methyl methacrylate) (PMMA).
Given the observed change in , Govaert et al. examined the functional relation between the two quantities in more detail and discovered that results for all polymers could be fit to Eq. 1. Figure 2 shows that our simulation results follow the same linear relation. Results for the temperature dependence at two values of chain stiffness are shown by solid symbols. The two have very different slopes, but similar positive offsets. We found that decreasing the strain rate by a factor of 30 only changed the offset by about 40%. As expected from entropic models, and our picture of hardening through plastic rearrangements, the slope is always steeper for more entangled polymers (bigger ). Note that the unit of stress 23 is of order 50MPa so that the simulation results for and are quite comparable to the experimental values (5 to 40MPa and 15 to 120MPa, respectively).
The data at fixed shear rate shown in Fig. 2 (circles) was included in Table 2 of Ref. 5. This table also quoted values of , which systematically increased by 50% with increasing . Given this, it is surprising that Govaert et. al. concluded that our simulations gave a constant . Note that the ratio between and the entropic prediction changes by a factor of 50 for the same data. This is one reason for our conclusion that the scale of is set by rather than the entropic stress.
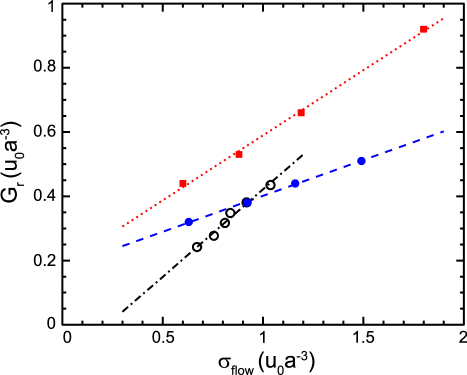
The linear relation between and leads to interesting behavior as increases to the glass transition temperature where . In Fig. 2, the results for varying have , implying that hardening would still be observed in the absence of a flow stress. While a hardening modulus of order the melt plateau modulus would be expected in this limit, the values of in our simulations and for PETG and PS are substantially larger than .
One possible explanation of the large was mentioned in the discussion of changes in in Ref. 5. Strain hardening is correlated with an increase in the size of regions that must be plastically deformed to shear the system while retaining chain connectivity. This is evidenced by an increase in the magnitude of non-affine deformations5 and in the number of Lennard Jones bonds broken6, 7 as increases. The flow stress goes to zero when is high enough to activate local segment-scale rearrangements at the given strain rate. This temperature will not in general be high enough to activate the larger, correlated rearrangements needed to maintain chain connectivity at higher strains, leading to a nonzero as goes to zero.
Govaert et al. also found cases where fits to the temperature dependent hardening gave negative . This implies that the hardening modulus vanishes and then becomes negative as approaches . This behavior seems counterintuitive, but the only case where the fit clearly indicates a negative is PC, and the data for it show a systematic curvature towards the origin. It would be interesting to extend the experimental data for all these systems toward . One possibility is that the strain softening contribution to is still important at the minimum in the stress that was used to define experimental values of . Indeed, the minimum occurs where the strain softening and straing hardening terms balance. The strain softening term in the experimental data varies in magnitude and extent with temperature, as does the value of at the stress minimum.
The rate dependence of is also of interest. In Ref. 5 we found that plots of for different strain rates and fixed temperature collapsed fairly well onto a single curve, implying a small . Govaert et al. found fairly good collapses in similar plots for PS and PMMA, but a clear change in normalized stress curves for PETG, PC and poly(phenylene ether) (PPE). All but PETG had a negative . Inspired by the experiments, we have extended our results to strain rates that are thirty times lower than in Ref. 5. As shown by the open symbols in Fig. 2, results for vs. fall on a straight line with a negative offset. Ref. 5 only included the four highest rates (and thus highest ). While the ratio of changes relatively little for these four points, even these data are consistent with a negative .
Rate dependence is often discussed in terms of Eyring-like models 20, 9 where the stress rises with rate as . Here is called the activation volume and represents the derivative of the activation energy barrier with respect to stress. Both experiments 18, 9 and simulations 24, 7 show a logarithmic dependence of stress on rate, with a strain dependent prefactor that increases (implying decreases) during strain hardening 25. This would be consistent with the complex rearrangements at large strains being harder to activate with a simple compressive stress. The more rapid rate dependence at high strains leads to a drop in strain hardening with decreasing rate, and thus is consistent with negative values of . The only system considered by Govaert et al. that did not have a negative was PETG, which showed little change in either or . Note that a negative is not problematic for the rate dependence since it is not generally possible to bring either or to zero because of the weak logarithmic dependence on rate.
Govaert et al. state that the variation of in experiments represents evidence for a “so-called back-stress, an elastic contribution to the strain-hardening response.” They did not explain this conclusion, but cite other observations that are frequently cited as evidence for a back-stress. For example, polymers exhibit a memory effect, returning to nearly their undeformed shape when heated above . In Ref. 7 we showed that simulations reproduce this effect.26 They also allow the magnitude of the stress driving this recovery to be evaluated directly. We found that the stress is entropic in origin and only of order the melt plateau modulus, rather than the much larger .
Govaert et al. also argue that the Bauschinger effect in oriented polymer glasses implies a back stress. There is an asymmetry in the stress needed to deform the system, with a larger stress required in the direction that would lead to an increase in orientation. This phenomenon is also consistent with our simulations and physical picture. When an oriented system is deformed in a way that reduces orientation, the constraints of chain connectivity can be satisfied in many ways. There is no need for the correlated rearrangements that occurred during orientation and the stress will be smaller.
CONCLUSIONS
Simulations were used to examine the relation between the flow stress and hardening modulus as temperature or strain rate was varied. Contrary to statements in Ref. 13, the results are completely consistent with experiments.13 Results for both simulation and experiments show a linear relation between and . In both cases the slope and intercept depend on whether or is varied and is more positive for varying temperature than varying rate. The observations also seem to be more easily understood in terms of a strain hardening model based on plastic deformation than an entropic model.
A qualitative explanation of the trends with temperature and rate was given based on the previously observed correlation between increases in stress and increases in the rate of plastic rearrangement.5, 6, 7 Since the size and complexity of plastic rearrangements increase with strain, thermal activation may be more effective for the initial flow stress than . This would lead the flow stress to vanish at a lower temperature than , implying a positive for variations with . In contrast, the value of would be negative for rate-dependent data if the simpler activations involved in lead to a stronger rate dependence. The simulations are consistent with these predictions for and most polymers have for rate-dependent data. Larger values of are found in experimental results for temperature dependence, although in some cases they appear to be negative. This may reflect the contribution of strain softening to the measured values of .
Many aspects of strain hardening result from the orientation of molecules that is produced by strain. Any mechanism that depends on this orientation will have memory effects and may exhibit a Bauschinger effect, but different models give very different predictions for the magnitude of these effects. In conventional entropic network models, orientation represents a loss of entropy that leads to a direct entropic stress. This entropic term is much smaller than the hardening modulus, but comparable to the stress driving the shape memory effect.7 Our simulations suggest that the influence of orientation on is indirect. As the orientation increases, larger non-affine displacements and more breaking of van der Waals bonds are required to maintain chain connectivity. The growing constraints of chain connectivity on rearrangements are related to the decreasing entropy. However the magnitude of the stress is much higher than the plateau modulus because the energy dissipated by rearrangements is set by the flow stress rather than .
ACKNOWLEDGMENTS
We thank Michael Wendlandt and Leon Govaert for useful comments. The simulations in this paper were carried out using the LAMMPS molecular dynamics software (http://lammps.sandia.gov). This material is based upon work supported by the National Science Foundation under Grant No. DMR-0454947 and through the MRSEC Program under Award No. DMR05-20415.
References
- Arruda and Boyce 1993 E. M. Arruda and M. C. Boyce, Int. J. Plast. 9, 697 (1993).
- Treloar 1975 L. R. G. Treloar, The Physics of Rubber Elasticity (Clarendon Press (Oxford), 1975).
- van Melick et al. 2003 H. G. H. van Melick, L. E. Govaert, and H. E. H. Meijer, Polymer 44, 2493 (2003).
- Kramer 2005 E. J. Kramer, J. Polym. Sci. Part B - Polym. Phys. 43, 3369 (2005).
- Hoy and Robbins 2006 R. S. Hoy and M. O. Robbins, J. Polym. Sci. Part B - Polymer Phys. 44, 3487 (2006).
- Hoy and Robbins 2007 R. S. Hoy and M. O. Robbins, Phys. Rev. Lett. 99, 117801 (2007).
- Hoy and Robbins 2008 R. S. Hoy and M. O. Robbins, Phys. Rev. E 77, 031801 (2008).
- Dupaix and Boyce 2005 R. B. Dupaix and M. C. Boyce, Polymer 46, 4827 (2005).
- Wendlandt et al. 2005 M. Wendlandt, T. A. Tervoort, and U. W. Suter, Polymer 46, 11786 (2005).
- Kremer and Grest 1990 K. Kremer and G. S. Grest, J. Chem. Phys. 92, 5057 (1990).
- Lyulin et al. 2005 See for example: A. V. Lyulin, B. Vorselaars, M. A. Mazo, N. K. Balabaev, and M. A. J. Michels, Europhys. Lett, 71, 618 (2005). J. Li, T. Mulder, B. Vorselaars, A. V. Lyulin, and M. A. . J. Michels, Macromolecules 39, 7774 (2006).
- Chen et al. 2009 K. Chen, and K. S. Schweizer, Phys. Rev. Lett., 102, 038301 (2009).
- Govaert et al. 2008 L. E. Govaert, T. A. P. Engels, M. Wendlandt, T. A. Tervoort, and U. W. Suter, J. Polym. Sci. Part B - Polym. Phys. 46, 2475 (2008).
- Everaers et al. 2004 R. Everaers, S. K. Sukumaran, G. S. Grest, C. Svaneborg, A. Sivasubramanian, and K. Kremer, Science 303, 823 (2004).
- Sukumaran et al. 2005 S. K. Sukumaran, G. S. Grest, K. Kremer, and R. Everaers, J. Polym. Sci. Part B - Polym. Phys. 43, 917 (2005).
- Auhl et al. 2003 R. Auhl, R. Everarers, G. S. Grest, K. Kremer, and S. J. Plimpton, J. Chem. Phys. 119, 12718 (2003).
- Yang et al. 1997 L. Yang, D. J. Srolovitz, and A. F. Yee, J, Chem. Phys 107, 4396 (1997).
- G’sell and Jonas 1979 See for example C. G’sell and J. J. Jonas, J. Mat. Sci. 14, 583 (1979).
- Mulliken and Boyce 2006 A. D. Mulliken and M. C. Boyce, Int J. Solids and Structures 43, 1331 (2006).
- Ree and Eyring 1955 See for example T. Ree and H. Eyring, J. App. Phys. 26, 793 (1955).
- Sarva et al. 2007 S. Sarva, A. D. Mulliken, and M. C. Boyce, Int. J. Solids Stuctures 44, 2381 (2007).
- Klompen et al. 2005 For a recent discussion of both yield and postyield behavior see E. T. J. Klompen, T. A. P. Engels, L. E. Govaert, and H. E. H. Meijer, Macromolecules 38, 6997 (2005).
- Rottler et al. 2002 J. Rottler, S. Barsky, and M. O. Robbins, Phys. Rev. Lett. 89, 148304 (2002).
- Rottler et al. 2003 J. Rottler, and M. O. Robbins, Phys. Rev. E 68, 011507 (2003).
- foo b A decreasing is not inconsistent with the increasing size of plastically deformed regions, because is not a priori related to the latter. See, for example, Argon, A. S., in Inelastic Deformation and Fracture of Glassy Solids; Materials Science and Technology: a Comprehensive Treatment, vol. 1, p. 462-508: VCH (Weinheim, Germany), 1993
- foo b Govaert et al. stated 13 that the strain in our simulations relaxes completely when stress is removed, but this is not the case. As in experiments, the recovery is only a few percent until the sample is heated to nearly .