Top Physics at the LHC
Abstract
The LHC will be a top quark factory. In this note, the central role of the top quark for LHC physics will be discussed, and an overview will be given of the studies of top quark properties in preparation, with an emphasis on the systematic uncertainties that will dominate most measurements.
I Introduction
The Large Hadron Collider at CERN is scheduled to deliver its first proton-proton collisions in the autumn of 2009. The ATLAS and CMS experiments are in the final phase of installation and commissioning of their detectors, and are preparing for measurements of the first collisions.
The LHC will be a top quark factory, both for top-quark pair production and single top-quark production. In this note, the central role of top quark production for LHC physics will be explained, and an overview will be given of the studies of top quark properties in preparation. Being the only fermion with a Yukawa coupling to the Higgs boson of , the top quark plays a central role in almost all models of new physics. Reviews of top quark physics at hadron colliders can be found in Refs. quadt ; bernreuther ; han .
II Top production
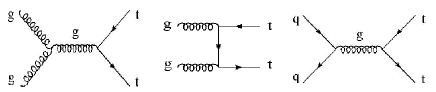
Figure 1 shows the leading order diagrams for top-pair production in QCD. At the LHC, top-quark pair production is dominated by gluon-gluon fusion ( 90%). The cross-section increase with respect to the Tevatron is very large, a factor of almost 150. The backgrounds increase as well, but with a smaller factor (about 10 for W/Z + jets), making the signal to background ratio better at the LHC. On the other hand, there is now considerable phase space for radiation of extra jets.
In the Standard Model (SM), each top quark decay would produce a W and a lighter quark (usually a -quark), and the W can decay either leptonically (to , or plus corresponding neutrino), or to two jets. This leads to an overall branching fraction of top-quark pairs to an all-hadronic final state of 46.2%, to a semi-leptonic final state of 43.5% (29% for only), and to a di-leptonic final state of 10.3% (4.6% for only).
Recently three new calculations of the top-pair production cross-section have been published moch ; cacciari ; kidonakis , each making significant steps towards a future full NNLO calculation. The central values of these calculations at the LHC are in good agreement, even though there is some difference in the treatment of the scale uncertainties. Taking the conservative value of Ref cacciari , the top-quark pair cross-section at TeV, using the CTEQ6.5 parton distribution functions (pdf), is calculated to be: pb, for a top mass of 171 GeV. The difference between the predictions using the MRSTW-06 and CTEQ6.5 pdf’s (53 pb), however, is larger than the pdf uncertainties as evaluated within CTEQ (30 pb) and MRSTW (12 pb) individually. At TeV, the startup centre-of-mass energy of the LHC, pb.
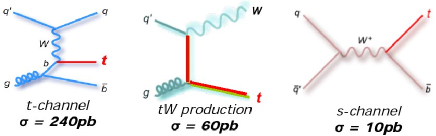
Single top-quark production is an electroweak process, usually divided into three mechanisms: the t-channel mechanism with the largest expected cross-section, associated tW production, and the small s-channel (or W*) production, as shown in Fig. 2.
III Role of the top at the LHC
At the LHC, the top quark has many hats. It is possible to select clean samples of top quarks, which can be used to check and calibrate the detectors, as described in the next subsection. A precise measurement of the top production cross-section is a test of advanced QCD resummation techniques that are also applicable in other calculations. Precise measurements of top properties can give insight into new physics beyond the SM affecting top couplings and decay modes. New physics can also affect top production, for example via top production from decay of heavy resonances. Finally, SM top quark production is often a major background in searches for new phenomena like supersymmetry, and it is important to understand all aspects of top production from data.
III.1 Top as a tool
Pure samples of top-pair events can be used to verify trigger and lepton identification, measure the light and -jet energy scale, check the missing reconstruction, and measure the -tagging efficiency. Furthermore, with these events it is possible to study efficiencies and fake rates in a “busy” environment. The top at the LHC is thus a prime multifunctional tool (yesterday’s sensation, today’s calibration!).
IV Observation and cross-section
Due to this special role of the top quark in detector commissioning, CMS and ATLAS aim for a rapid rediscovery of the top quark in early data. A measurement of the cross-section in fb-1 would provide an interesting early physics result, and is important for searches for new physics.
IV.1 production
Early observation of production is possible both in the semi-leptonic and in the di-leptonic channel. As an example in the semi-leptonic channel, Fig. 3 (left) shows the expected distribution of the number of jets after a few basic cuts in 10 pb-1 of CMS data cmstop ; the presence of a top signal is clear.
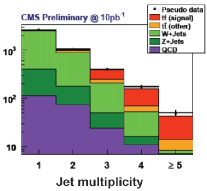
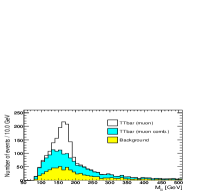
Figure 3 (right) shows for 100 pb-1 of ATLAS data the expected invariant mass of three hadronic jets (the three with the highest vector sum) after simple cuts on one lepton, at least four jets and some missing , even without the use of -tagging, which may be compromised in early data. The main background is W+jets, but the top signal is obvious. The cross-section can be extracted from a fit to the invariant mass shape, or by background subtraction. ATLAS expects in 100 pb-1 a measurement of the cross-section with 3-7% statistical uncertainty and 15% systematic uncertainty, not including the pdf error (3%) and the luminosity error (5%).
The di-leptonic channel has a smaller branching fraction, but less background, and also here a signal in 10 pb-1 seems feasible.
When well-understood -tagging is available, the top signal becomes very clean, and accurate cross-section measurements may be made. Table 1 shows the CMS estimates of uncertainties in the cross-section in the semi-leptonic decay channel (muons only). A major uncertainty is due to the error on the -tagging; 5% is considered conservative and may well be considerably smaller with 10 fb-1 of luminosity.
| 1 fb-1 | 5 fb-1 | 10 fb-1 | |
| Simulation samples | 0.6% | ||
| Pile-up (30% on-off) | 3.2% | ||
| Underlying event | 0.8% | ||
| Jet energy scale (light , 2%) | 1.6% | ||
| Jet energy scale (heavy , 2%) | 1.6% | ||
| Radiation () | 2.6% | ||
| Fragmentation (Lund b, ) | 1.0% | ||
| -tagging (5%) | 7.0% | ||
| Parton density functions | 3.4% | ||
| Background level | 0.9% | ||
| Integrated luminosity | 10% | 5% | 3% |
| Statistical uncertainty | 1.2% | 0.6% | 0.4% |
| Systematic uncertainty | 13.6% | 10.5% | 9.7% |
| Total uncertainty | 13.7% | 10.5% | 9.7% |
IV.2 Single top production
As mentioned, single top production takes place via three mechanisms, each having its own dedicated analysis. The major backgrounds for all three are top-quark pair production, multi-jet QCD and W+jets events. In particular the QCD background can be suppressed by only looking at leptonic decays of the W from the top.
IV.2.1 t-channel
CMS performs a cut-based analysis of this channel, where cuts are optimized with a genetic algorithm. In 10 fb-1, the statistical significance of the t-channel signal is 37, and the cross-section is measured with a 2.7% statistical error and 8% systematic error (excluding the luminosity uncertainty).
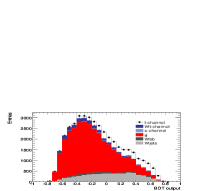
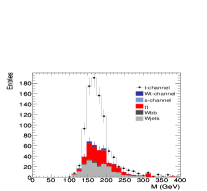
ATLAS uses a cut-based analysis as a baseline for robust observation, but observes that a multivariate analysis using a boosted decision tree (BDT) has a higher sensitivity. Figure 4 (left) shows the output of the BDT, Fig. 4 (right) shows the invariant mass of the top decay products after demanding that the BDT output is larger than 0.6: the top peak is clear.
In 1 fb-1, ATLAS aims to measure the cross-section in the t-channel with 5.7% statistical and 22% systematic error, which would determine to % (stat.+syst.) % (theory). In 10 fb-1, the cross-section would be measured to 2% statistical and 10% systematic errors.
IV.2.2 Associated tW production
Here two final states are considered: the di-leptonic channel , and the semi-leptonic channel .
In 10 fb-1 CMS expects a significance for a signal of in the di-leptonic channel, and in the semi-leptonic channel. Excluding the systematic uncertainty due to limited MC statistics, the cross-section in the di-leptonic channel is measured with a statistical error of 8.8% and a systematic error of 24%; the cross-section in the semi-leptonic channel is measured with a statistical error of 7.5% and a systematic error of 17%. The dominating systematic errors are the jet energy scale, pile-up, and -tagging uncertainties.
ATLAS again uses cut-based and multivariate analyses, with in 10 fb-1 an expected uncertainty on the measured cross-section of 6.6% statistical, and 19.4% systematic.
IV.2.3 s-channel
The s-channel is interesting since other particles like H± can appear in the propagator, but it is a difficult channel due to the low cross-section and large backgrounds.
CMS has studied this channel with a fast detector simulation, and expects to reach a measurement of the cross-section in 10 fb-1 with a 18% statistical error, and a 31% systematic error.
ATLAS has studied likelihood methods with full detector simulation, and expects in 10 fb-1 a statistical error of 20% and a systematic error of 48% on the cross-section.
V Top properties
It is expected that the LHC experiments can make studies of top quark properties to levels exceeding those of the Tevatron. However, for many measurements, in particular the top mass, systematic errors dominate over statistical errors, and the full capabilities of the LHC can only be exploited when those systematic uncertainties are under control.
V.1 Top mass
The mass of the top quark is one of the most important parameters of the Standard Model. It should be realized that, theoretically, the concept of a pole mass for the top quark has an intrinsic uncertainty of order , and a direct translation of the parameter measured by experiments to the pole mass is not so obvious. Perhaps the fairest statement one can make is that what experiments measure is actually the “top mass” parameter in the Monte Carlo generators…
CMS measures the top mass in the semi-leptonic channel using a full kinematic fit to the events, and using the result of this fit in an event-by-event likelihood as a function of the top mass. This likelihood can make optimal use of all information available in the event. In a data sample of 10 fb-1, CMS expects a statistical uncertainty on the top mass of only 200 MeV, and a systematic uncertainty of 1.1 GeV if the dominating uncertainty, the -jet energy scale, is known to 1.5%.
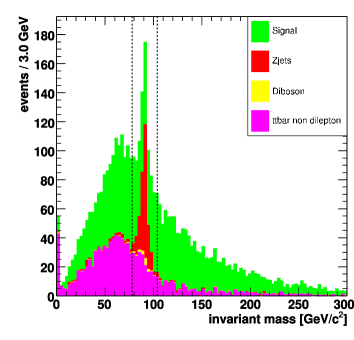
CMS has also studied the extraction of the top mass in the di-lepton channel and the all-hadronic channel. The di-lepton channel is very clean, as shown in Fig. 5. Already in 1 fb-1 a measurement with an error of GeV can be done, improving to GeV (stat.) GeV (syst.) in 10 fb-1. Also the all-hadronic channel contributes to the combined top mass; its dominating systematics are the jet energy scale, radiation of extra jets and the backgrounds.
The ATLAS studies have concentrated on the semi-leptonic decay channel, with electrons and muons. Two algorithms have been studied to choose the two light jets from the hadronically decaying W boson: a minimization method with event-by-event rescaling, and a geometric method choosing the two light jets with smallest . Then the two -tagged jets are assigned to hadronic and leptonic W to form the two top quarks. The top quark mass can be extracted from a fit to the invariant mass peak, or from a full kinematic fit of the event. In the final expected result for 1 fb-1, the systematic uncertainty dominates over the statistical one, and amounts to 0.7 GeV per % of -jet energy scale uncertainty, 0.2 GeV per % of light jet energy scale uncertainty, and GeV due to uncertainties related to radiation of extra jets, either from the initial (ISR) or final state (FSR).
An interesting alternative method to measure the top mass has been studied by CMS, and involves selection of events where a -quark decays into a () and the into two leptons, and where the W from the same top quark also decays leptonically. The invariant mass of the three leptons is sensitive to the top mass; the systematic uncertainties of this method include -decay modelling and the lepton energy scale, but not the -jet energy scale, and it is thus almost orthogonal to the standard methods. In 20 fb-1 the statistical error could reach GeV and the systematic error GeV, dominated by theory systematics that may be further reduced by new calculations.
V.2 Top decay
If the top quark is indeed the , spin , heavy partner of the bottom quark, then the following expression holds for its decay width to a W and a lighter quark ():
| (1) | |||||
In the Standard Model , and the top decay into W dominates far above W and W decays. The decay has the structure of the typical charged weak V-A (vector minus axial vector coupling) form. It is possible to measure by counting the number of -tagged jets in top decays; the precision will be determined by -tagging systematics. Alternatively, can also be determined in single top production.
V.2.1 Top charge
For a decay , it is interesting to study the correlation of W and charge, in order to establish whether indeed is observed as expected in the SM, or whether we are observing an exotic “top-like” quark with decaying as . At the Tevatron, this latter scenario is disfavoured at the 90-95% CL. ATLAS can make a distinction with 1 fb-1 with a -jet charge technique, or using semi-leptonic -decays.
V.2.2 FCNC decays
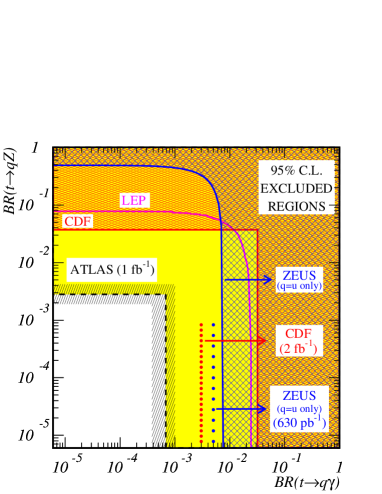
In the SM, flavour-changing neutral current top decays ( X, where and X ,Z,gluon) are strongly suppressed (); in certain models of new physics they can be enhanced to levels of .
CMS has evaluated the sensitivity to X , Z with a cut-based analysis. In 10 fb-1, a discovery of Br and Br could be made. ATLAS has developed a multivariate selection for X , Z and gluon, and quotes the results as 95% CL exclusion limits for 1 fb-1, as shown in Fig. 6.
V.2.3 V-A structure
The V-A structure of top quark decay can be studied in semi-leptonic decays. One measures the polarisation of the leptonically decaying W from the distribution of the angle between the lepton in the W frame, and the W in the top frame. This distribution can be written as
| (2) | |||||
where , and are the fractions of longitudinally, left-handed and right-handed polarized W’s, respectively. By fitting the appropriate -dependent functions to the distribution, the fractions can be extracted, under the constraint .
In 730 pb-1, ATLAS expects to measure, if indeed these fractions are as the Standard Model predicts: , , and , where the first error is statistical and the second systematic.
V.2.4 Anomalous couplings
In a more general way, it is convenient to write an effective Lagrangian for the vertex as follows:
| (3) | |||||
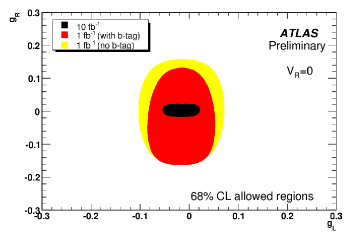
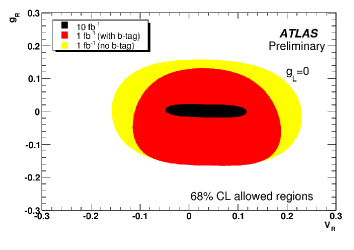
where are the usual right- and left-handed projection operators, and and are top couplings; in the SM only (in fact ), and the other couplings are anomalous.
ATLAS has derived expected limits on the anomalous couplings for 1 and 10 fb-1, as shown in Fig. 7.
V.3 Spin correlations
The top itself is expected to be produced essentially unpolarised, but there are correlations between the spins of the two tops in the same event. This is due to the fact that close to threshold, in gluon-gluon fusion the top-pairs are produced in a state. (In annihilation they would be in a state). The top spin correlations can be studied by looking at the asymmetry between parallel aligned top spins versus oppositely aligned top spins
| (4) |
where stands for the cross-section of producing a with spin up and a with spin down, etc. As a spin-analyzer axis we use the direction of flight of the two tops in their combined center-of-mass frame. Defining as the angle between (or ) decay product in the (or ) rest frame, and the () in the rest frame, the double differential distribution of and , where and are from different top quarks, can be written as:
| (5) | |||||
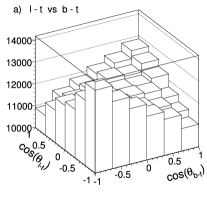
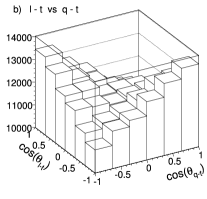
In this equation, is the spin analyzing power of decay product : it is nearly one for a lepton or a -type quark if one could identify such a quark, it is typically for tagged -quark jets or the lowest energy jet. Figure 8 shows the distributions of versus for (left) and (right), for CMS at generator level, before detector simulation. Detector effects do significantly deteriorate the correlations and need to be taken into account, leading to systematic uncertainties. For top-quark production dominated by gluon-gluon fusion, is expected to be depending on exact cuts, whereas for production by quark-antiquark annihilation .
CMS expects to measure in 10 fb-1 with a total relative uncertainty (dominated by systematics) of 20-25%, which would clearly distinguish between production mechanisms. ATLAS expects a measurement with a relative uncertainty of % already in 200 pb-1, evolving to 10-20% in 10 fb-1.
VI Anomalous production
New physics can introduce new production mechanisms for single top quarks or top quark pairs. Flavour-changing neutral current processes can lead to anomalous single top production. Furthermore, top quarks can be produced in the decay of stop quarks in supersymmetry, in charged Higgs decays, or in the decay of resonances that appear in little Higgs or LR-symmetric Higgs models, or in models with extra dimensions containing Kaluza-Klein (KK) states. Apart from a deviation in the overall single-top or top-pair cross-section, a pronounced deviation in the top-pair invariant mass distribution may appear. A general complication in the reconstruction of top quarks produced in the decay of massive particles is the fact that these top quarks are highly boosted, and their decay products are very close. Dedicated reconstruction techniques are under development in both CMS and ATLAS.
VII Conclusion
The LHC will provide a very large sample of top quarks. These top quarks play a central role in many studies, and statistical errors will not be the limiting factor (with the exception of rare decays). Detailed studies of systematic errors, on the other hand, will be very important. On the detector side these include -jet and light jet energy scales, -tagging, and pile-up. On the theory side, the major uncertainties are from radiation of extra jets (ISR/FSR), pdf’s, and hadronization. Hard work will be needed by experimentalists and theorists alike, with the reward of better understanding of a very special quark.
Acknowledgements.
The author wishes to thank everyone in CMS and ATLAS whose work contributed to this talk.References
- (1) A. Quadt, Eur. Phys. J. C48 (2006), 835
- (2) W. Bernreuther, J. Phys. G35 (2008), 083001
- (3) T. Han, Int. J. Mod. Phys. A23 (2008), 4107
- (4) The CMS Collaboration, CMS Physics TDR 2006
- (5) The ATLAS Collaboration, Expected performance of the ATLAS experiment - Detector, Trigger and Physics, arXiv:0901.0512 (2009)
- (6) S. Moch and P. Uwer, Phys. Rev. D78 (2008), 034003
- (7) S. Cacciari et al., JHEP 0809 (2008), 127
- (8) N. Kidonakis and R. Vogt, Phys. Rev. D78 (2008), 074005
- (9) The CMS Collaboration, PAS TOP-08-005 (2008)