Also at ]INAF - Osservatorio Astronomico di Capodimonte, salita Moiariello 16, I-80131 Napoli, Italy
Method to measure off-axis displacements based on the analysis of the intensity distribution of a vortex beam
Abstract
We study the properties of the Fraunhofer diffraction patterns produced by Gaussian beams crossing spiral phase plates. We show, both analytically and numerically, that off-axis displacements of the input beam produce asymmetric diffraction patterns. The intensity profile along the direction of maximum asymmetry shows two different peaks. We find that the intensity ratio between these two peaks decreases exponentially with the off-axis displacement of the incident beam, the decay being steeper for higher strengths of the optical singularity of the spiral phase plate. We analyze how this intensity ratio can be used to measure small misalignments of the input beam with a very high precision.
pacs:
42.25.Bs, 42.25.Gy, 42.90.+m, 42.79.-eI Introduction
Optical vortices (OVs) appear in light beams carrying screw wavefront dislocations (vortex beams) Nye and Berry (1974). The surface of constant phase of a vortex beam has an helical structure and presents phase singularities endowed with topological charge. Beams harboring OVs carry also a quantity of orbital angular momentum (OAM) Allen et al. (1992) associated to the precession of the Poynting vector around the vortex axis Padgett and Allen (1995).
OVs have attracted an increasing interest in applied physics Gahagan and Swartzlander (1996); Molina-Terriza et al. (2001); Curtis and Grier (2003); Grier (2003); Mariyenko et al. (2005); Molina-Terriza et al. (2007) and also for astronomical applications Swartzlander (2001); Harwit (2003); Thidé et al. (2007); Anzolin et al. (2008); Elias (2008); Berkhout and Beijersbergen (2008). In fact, they can be easily produced in light beams with the help of specific optical devices that have a central optical singularity. Among these optical elements, the most efficient ones are fork holograms (FHs) Bazhenov et al. (1990) and spiral phase plates (SPPs) Beijersbergen et al. (1994). Laguerre-Gaussian (L-G) modes have been often used to describe the beams produced with such devices. However, a more precise description of the diffraction patterns produced by an SPP Berry (2004) or a FH Sacks et al. (1998); Bekshaev and Karamoch (2008a) is provided by hypergeometric (Kummer) functions. We shall use this approach in this Paper.
Consider an input beam with an amplitude distribution symmetric about the propagation axis. When such a beam intersects an SPP or a FH perpendicularly and exactly on-axis, it produces a circularly symmetric beam with a central dark region, where the field amplitude is zero. Any misalignment with respect to the central discontinuity would then produce an asymmetry of the observed intensity distribution Vaziri et al. (2002) and the topological charge of the correspondent off-axis OV may have a non-integer value Oemrawsingh et al. (2004a). This changes also the OAM originally carried by the beam Mair et al. (2001), thus producing an OAM spectrum Vasnetsov et al. (2003, 2005).
The sensitivity of a vortex beam to displacements of the input beam has been proposed as an indicator of nanometric shifts in a speckle pattern Wang et al. (2006) or to be used as a non-interferometric method for the correction of small surface deviations on spatial light modulators Jesacher et al. (2007). Similar results could be obtained from the analysis of the mean square value of the resulting OAM spectrum Liu et al. (2008). We also proposed a method to measure very small displacements based on the degree of asymmetry of the intensity pattern of an off-axis vortex beam Tamburini et al. (2006); Anzolin et al. (2008). However, detailed analytical studies of the actual structure of off-axis OV produced with SPPs of FHs were initiated only very recently Bekshaev and Karamoch (2008b). In this Paper, we extend the analysis of the intensity distribution of an off-axis vortex beam generated under Fraunhofer diffraction conditions. We then derive a more convenient formalism of our method for the detection of off-axis displacements, in view of future applications with optical imaging devices.
II Fraunhofer diffraction of a Gaussian beam intersecting a spiral phase plate on-axis
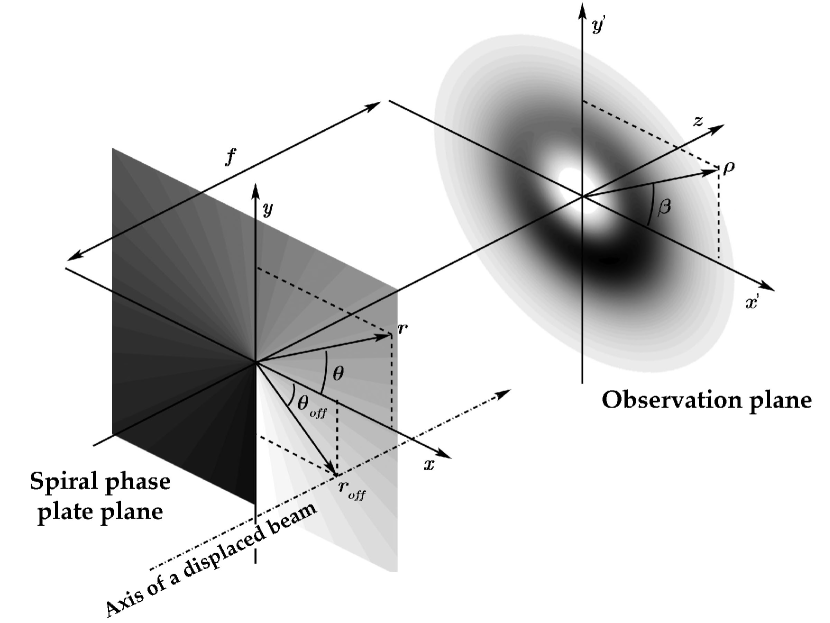
In this Section we revisit the problem of the Fraunhofer diffraction of a monochromatic Gaussian beam intersecting an SPP exactly on-axis 111Similar results can be found also for a FH, provided that the angle subtended by the first diffraction order is small Bekshaev and Karamoch (2008a).. The geometrical configuration adopted here is sketched in Fig. 1. The SPP is placed in the plane and the central optical singularity coincides with the origin of the coordinate system. To take advantage of the circular symmetry of the geometry, in the following we will use the circular coordinates defined by and . Thus, the transmission function of the SPP is a complex function of the azimuthal angle :
| (1) |
where represents the strength of the optical singularity. We consider a Gaussian beam propagating along the axis (that is also its symmetry axis) perpendicular to the SPP plane. This choice is important for practical applications, i.e. laser beams or starlight beams affected by atmospheric turbulence. We then assume that the field amplitude distribution in the SPP plane is
| (2) |
where is a complex factor, eventually dependent on the coordinate, and is related to the beam width. The observation plane is located at a distance beyond the SPP or, better, at the focal plane of a lens placed just behind the SPP (in this case, would coincide with the focal length of the lens). The scalar field of the beam in the observation plane can be obtained from the Fourier transform of the product between the amplitude of the input beam and the SPP transmission function:
| (3) |
where is the wave vector, is the wavelength and are the circular coordinates in the observation plane. To simplify the calculations, the SPP is considered as infinitely extended in the plane. In addition, we use the scaled radial coordinate and introduce the quantities and , the latter containing all the multiplicative constants. In this way, Eq. 3 becomes
| (4) |
The integral involving the angular coordinate can be evaluated by using the definition of the Bessel function of the first kind . Thus, the integral involving the spatial coordinate becomes a particular case of the Weber-Sonine formula Abramowitz and Stegun (1964). The final result of the integration can be expressed in terms of the confluent hypergeometric function of the first kind. However, a more useful expression of the amplitude distribution of the output beam is obtained by using the modified Bessel function of the first kind . By introducing the quantity , the final result is Sacks et al. (1998)
| (5) |
The presence of the phase factor implies that the output beam has an -charged OV nested inside.
Beams of this kind, also known as ‘Kummer beams’ Bekshaev and Karamoch (2008a), are different from the commonly used Laguerre-Gaussian (L-G) beams Turnbull et al. (1996); Arlt et al. (1998). If , the Bessel functions of half-integer index in Eq. 5 can be expressed in terms of the hyperbolic functions and combined together to give an exponential. In this case, the amplitude distribution of the output beam is still Gaussian, i.e. . If , we can derive an useful approximation for by using the series expansion of Abramowitz and Stegun (1964):
| (6) |
We can recognize that, near the axis, the amplitude of an on-axis Kummer beam carrying an OV with topological charge could be represented by a superposition of amplitudes of L-G modes with :
| (7) |
The dominant term is represented by an L-G mode with index , while higher order terms are L-G modes with indices ().
II.1 Properties of the intensity distribution
The intensity distribution of an on-axis Kummer beam is axially symmetric around the axis and is described by:
| (8) |
As for L-G modes, the intensity pattern of a Kummer beam has an annular shape, with a central dark region where the intensity is zero. However, there are some fundamental differences between the two analytical descriptions. For a Kummer beam the behavior of the intensity at large distances from the axis is , while for an L-G mode it decreases exponentially. Moreover, the radius of maximum intensity of an L-G mode is , where the intensity attains the value , while for a Kummer beam is found by numerically solving the transcendental equation
| (9) |
The calculation of the radii of maximum intensity obtained for a set of values of the topological charge (see Fig. 2a) suggests that is linearly dependent on :
| (10) |
A similar result was found also for OVs produced by a plane wave intersecting a finite circular phase mask Curtis and Grier (2003). Fig. 2b shows the intensity calculated at for the same set of topological charges.

II.2 The effects of off-axis displacements
When the input Gaussian beam is displaced off-axis, so that its symmetry axis does not coincide with the axis of Fig. 1, the intensity pattern produced in the observation plane is modified. The misalignment of the input beam can be decomposed into a translation in the plane and an inclination angle with respect to the axis. However, if is small, the modifications induced in the intensity pattern of the output beam are negligible Bekshaev and Karamoch (2008b). For this reason, in our calculations we will consider only lateral displacements of the incident beam. Let us then assume that the Gaussian beam intersects the SPP in the position , as shown in Fig. 1. The field of the output beam resembles that of Eq. 5 obtained under on-axis conditions:
| (11) |
Here, is the scaled radial coordinate obtained from , while the quantities and are defined as Bekshaev and Karamoch (2008b)
| (12) |
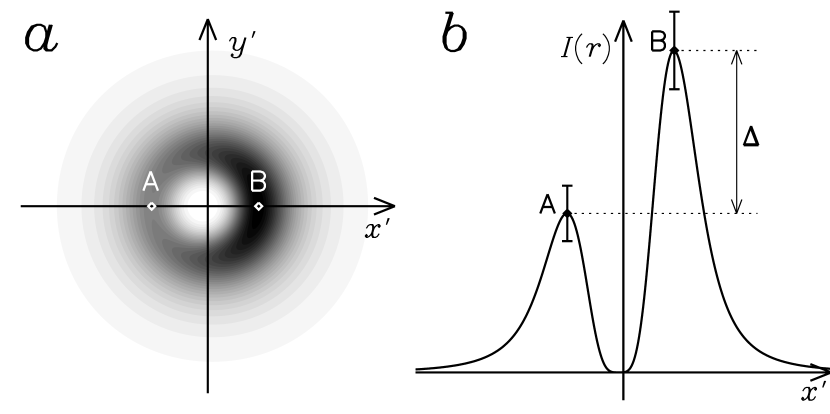
In this case, the additional exponential factor and the complex value of produces a phase singularity which is located neither on the beam axis, nor in the origin of the plane, but shifted in a position . As a result, the intensity distribution of the output beam becomes asymmetric Basistiy et al. (2004), showing two different peaks along the direction of the vortex core in the plane. Fig. 3a shows an example of an off-axis OV produced with an SPP. The lower and the higher peaks are labeled with and , respectively.
Now, since it is difficult to find analytical solutions of Eqs. 11 and 12, we decided to perform numerical simulations. The width of the input Gaussian beam was parametrized in function of the full width at half of the intensity maximum, , such that . We used values of the topological charge induced by the SPP in the range , since with higher values we get misleading results using the two-dimensional Fast Fourier Transform algorithm. For each , we considered a number of off-axis displacements of the input beam ranging from 0 to 1 and computed the intensity patterns of the resulting beams.
We checked the consistency of our numerical simulations by comparing them to the analytical models (Eq. 11) for a number of values of and off-axis positions. To this aim, we previously normalized the intensities of both the simulated and the analytical patterns to the corresponding maximum values. Therefore, the peak always has a normalized intensity equal to one (obviously, both the peaks and will have the same unity intensity if ). The residuals of the subtraction of the theoretical intensity patterns from the simulated ones are typically within for positions close to peaks and . We will then assume this quantity as the intrinsic error of our numerical simulations.
For all the numerically simulated OVs we obtained the intensity values at the two peaks and calculated the quantity defined as the ratio between the intensity of the lower peak and the intensity of the higher peak. We find that rapidly decreases as the off-axis displacement increases for all the topological charges considered. The graphs showing the dependence of on for are plotted in Fig. 4. All the curves are well represented by a simple exponential function:
| (13) |
where parameters and , obtained by best fitting the simulated curves, are listed in Table 1. From these results, it appears that depends on the topological charge as
| (14) |
while seems to remain equal to unity.

III The sensitivity of the method to reveal off-axis displacements
The off-axis displacement of the input Gaussian beam with respect to the central singularity of an SPP results in an asymmetry of the far-field intensity pattern. Eq. 13 reveals that the parameter represents an extremely sensitive tool to detect such very small displacements.
Let us suppose to have an input Gaussian beam which symmetry axis is perpendicular to the surface of an SPP and observe the correspondent far-field image with a photoelectric detector like a CCD. In this way, if the beam is displaced off-axis, we can measure the intensity ratio of the two different peaks, as defined in Sect. II.2. The precision of this measurement is mainly limited by the signal-to-noise ratio (SNR) achieved in the observation, while additional errors might be introduced by construction imperfections of the SPP. The latter issue results in inhomogeneities of the observed intensity distribution. For this reason, efforts are currently made to improve the production quality of SPPs Oemrawsingh et al. (2004b); Watanabe et al. (2004); Sueda et al. (2004). However, here we assume to use an ideal SPP so that the only limitations are due to the SNR. The noise of a CCD detector is mainly represented by the photon shot noise Howell (2006). Assuming a pure Poissonian distribution of the collected photons, the uncertainties associated to the intensities and of the two peaks can be approximated by the square root of the signals, i.e. and . We may then recognize at the confidence level when (see Fig. 3b), that means
| (15) |
If we introduce parameter , this equation can be rewritten as a function of the only SNR associated to the intensity of the highest peak (). We find that the maximum peaks intensity ratio measurable at the confidence level is
| (16) |
As useful examples, in Fig. 4 we draw three horizontal lines corresponding to the maximum values 0.44, 0.81 and 0.98 detectable at the level for , 10 and 100, respectively. By combining Eq. 13 with Eq. 16, we finally obtain the expression for the minimum off-axis displacement detectable at the confidence level:
| (17) |
One general outcome is that, for a fixed , OVs with higher values allow the detection of smaller off-axis displacements. This effect is more significant at low SNR regimes, when the maximum measurable is small and the curves in Fig. 4 are more spatially separated. As increases, the advantage obtained by using high values of the topological charge becomes negligible. In fact, if we assume above 10, we might reveal off-axis displacements for all values. Instead, considering the lowest acceptable value for signal detection, we can detect off-axis displacements of for at the confidence level.
IV Conclusions
In this Paper we have analyzed the properties of the Fraunhofer diffraction pattern produced by a Gaussian light beam crossing an SPP. When the input beam is perfectly aligned with the central singularity of the SPP, the resulting beam is a Kummer beam with a symmetric annular intensity distribution. Instead, an off-axis displacement of the input beam produces an asymmetry in the far-field intensity pattern. In particular, the intensity profile along the direction of maximum asymmetry shows two different peaks. We have found that, for all the values of the topological charge considered, the ratio of their intensities changes exponentially with the off-axis displacement of the input beam. We have quantitatively analyzed how the SNR associated to the highest peak affects the sensitivity of the ratio in revealing very small misalignments of the input beam. In particular, we have found that higher values of the topological charge generally provide better resolutions, especially for low SNR regimes. We suggest that this method could find interesting applications in high-precision positioning systems. Note that similar results can be obtained also by using other spatial properties of transverse laser modes Treps et al. (2003). Finally, the sensitivity of OVs could be used in astrometry, by placing an SPP at the focal plane of a telescope.
Acknowledgements.
We gratefully acknowledge financial support from the CARIPARO foundation.References
- Nye and Berry (1974) J. F. Nye and M. V. Berry, Proc. R. Soc. London A 336, 165 (1974).
- Allen et al. (1992) L. Allen, M. W. Beijersbergen, R. J. C. Spreeuw, and J. P. Woerdman, Phys. Rev. A 45, 8185 (1992).
- Padgett and Allen (1995) M. J. Padgett and L. Allen, Opt. Commun. 121, 36 (1995).
- Gahagan and Swartzlander (1996) K. T. Gahagan and G. A. Swartzlander, Jr., Opt. Lett. 21, 827 (1996).
- Molina-Terriza et al. (2001) G. Molina-Terriza, J. Recolons, J. P. Torres, L. Torner, and E. M. Wright, Phys. Rev. Lett. 87, 023902 (2001).
- Curtis and Grier (2003) J. E. Curtis and D. G. Grier, Phys. Rev. Lett. 90, 133901 (2003).
- Grier (2003) D. G. Grier, Nature 424, 810 (2003).
- Mariyenko et al. (2005) I. G. Mariyenko, J. Strohaber, and C. J. Uiterwaal, Opt. Expr. 13, 7599 (2005).
- Molina-Terriza et al. (2007) G. Molina-Terriza, J. P. Torres, and L. Torner, Nature Phys. 3, 305 (2007).
- Swartzlander (2001) G. A. Swartzlander, Jr., Opt. Lett. 26, 497 (2001).
- Harwit (2003) M. Harwit, Astrophys. J. 597, 1266 (2003).
- Thidé et al. (2007) B. Thidé, H. Then, J. Sjöholm, K. Palmer, J. Bergman, T. D. Carozzi, Y. N. Istomin, N. H. Ibragimov, and R. Khamitova, Phys. Rev. Lett. 99, 087701 (2007).
- Anzolin et al. (2008) G. Anzolin, F. Tamburini, A. Bianchini, G. Umbriaco, and C. Barbieri, Astron. Astrophys. 488, 1159 (2008).
- Elias (2008) N. M. Elias, II, Astron. Astrophys. 492, 883 (2008).
- Berkhout and Beijersbergen (2008) G. C. G. Berkhout and M. W. Beijersbergen, Phys. Rev. Lett. 101, 100801 (2008).
- Bazhenov et al. (1990) V. Y. Bazhenov, M. V. Vasnetsov, and M. S. Soskin, JETP Lett. 52, 429 (1990).
- Beijersbergen et al. (1994) M. W. Beijersbergen, R. P. C. Coerwinkel, M. Kristensen, and J. P. Woerdman, Opt. Commun. 112, 321 (1994).
- Berry (2004) M. V. Berry, J. Opt. A: Pure Appl. Opt. 6, 259 (2004).
- Sacks et al. (1998) Z. S. Sacks, D. Rozas, and G. A. Swartzlander, Jr., J. Opt. Soc. Am. B 15, 2226 (1998).
- Bekshaev and Karamoch (2008a) A. Y. Bekshaev and A. I. Karamoch, Opt. Commun. 281, 1366 (2008a).
- Vaziri et al. (2002) A. Vaziri, G. Weihs, and A. Zeilinger, J. Opt. B: Quantum Semiclass. Opt. 4, 47 (2002).
- Oemrawsingh et al. (2004a) S. S. R. Oemrawsingh, E. R. Eliel, G. Nienhuis, and J. P. Woerdman, J. Opt. Soc. Am. A 21, 2089 (2004a).
- Mair et al. (2001) A. Mair, A. Vaziri, G. Weihs, and A. Zeilinger, Nature 412, 313 (2001).
- Vasnetsov et al. (2003) M. V. Vasnetsov, J. P. Torres, D. V. Petrov, and L. Torner, Opt. Lett. 28, 2285 (2003).
- Vasnetsov et al. (2005) M. V. Vasnetsov, V. A. Pas’ko, and M. S. Soskin, New J. Phys. 7, 46 (2005).
- Wang et al. (2006) W. Wang, T. Yokozeki, R. Ishijima, M. Takeda, and S. G. Hanson, Opt. Expr. 14, 10195 (2006).
- Jesacher et al. (2007) A. Jesacher, A. Schwaighofer, S. Fürhapter, C. Maurer, S. Bernet, and M. Ritsch-Marte, Opt. Expr. 15, 5801 (2007).
- Liu et al. (2008) Y.-D. Liu, C. Gao, X. Qi, and H. Weber, Opt. Expr. 16, 7091 (2008).
- Tamburini et al. (2006) F. Tamburini, G. Anzolin, G. Umbriaco, A. Bianchini, and C. Barbieri, Phys. Rev. Lett. 97, 163903 (2006).
- Bekshaev and Karamoch (2008b) A. Y. Bekshaev and A. I. Karamoch, Opt. Commun. 281, 3597 (2008b).
- Abramowitz and Stegun (1964) M. Abramowitz and I. A. Stegun, Handbook of mathematical functions with formulas, graphs, and mathematical tables (Dover Books on Advanced Mathematics, New York, 1964).
- Turnbull et al. (1996) G. A. Turnbull, D. A. Robertson, G. M. Smith, L. Allen, and M. J. Padgett, Opt. Commun. 127, 183 (1996).
- Arlt et al. (1998) J. Arlt, K. Dholakia, L. Allen, and M. J. Padgett, J. Mod. Opt. 45, 1231 (1998).
- Basistiy et al. (2004) I. V. Basistiy, V. A. Pas’ko, V. V. Slyusar, M. S. Soskin, and M. V. Vasnetsov, J. Opt. A: Pure Appl. Opt. 6, 166 (2004).
- Oemrawsingh et al. (2004b) S. S. R. Oemrawsingh, J. A. W. van Houwelingen, E. R. Eliel, J. P. Woerdman, E. J. K. Verstegen, J. G. Kloosterboer, and G. W. ’t Hooft, Appl. Opt. 43, 688 (2004b).
- Watanabe et al. (2004) T. Watanabe, M. Fujii, Y. Watanabe, N. Toyama, and Y. Iketaki, Rev. Sci. Instr. 75, 5131 (2004).
- Sueda et al. (2004) K. Sueda, G. Miyaji, N. Miyanaga, and M. Nakatsuka, Opt. Expr. 12, 3548 (2004).
- Howell (2006) S. B. Howell, Handbook of CCD astronomy, 2nd ed. (Cambridge observing handbooks for research astronomers, Vol. 5. Cambridge University Press, Cambridge, UK, 2006).
- Treps et al. (2003) N. Treps, N. Grosse, W. P. Bowen, C. Fabre, H.-A. Bachor, and P. K. Lam, Science 301, 940 (2003).