Upper Limit on Dimming of Cosmological Sources by Intergalactic Grey Dust from the Soft X-ray Background
Abstract
Active Galactic Nuclei (AGN) produce a dominant fraction () of the Soft X-ray background (SXB) at photon energies keV. If dust pervaded throughout the intergalactic medium, its scattering opacity would have produced diffuse X-ray halos around AGN. Taking account of known galaxies and galaxy clusters, only a fraction of the SXB can be in the form of diffuse X-ray halos around AGN. We therefore limit the intergalactic opacity to optical/infrared photons from large dust grains (with radii in the range m) to a level to a redshift . Our results are only weakly dependent on the grain size distribution or the redshift evolution of the intergalactic dust. Stacking X-ray images of AGN can be used to improve our constraints and diminish the importance of dust as a source of systematic uncertainty for future supernova surveys which aim to improve the precision on measuring the redshift evolution of the dark energy equation-of-state.
keywords:
cosmology: theory, X-rays: diffuse background, scattering, (ISM:) dust, extinction, (galaxies:) intergalactic medium, (galaxies:) quasars: general1 Introduction
The use of Type Ia supernovae as standardized candles provides a powerful measure of the redshift dependence of the luminosity distance, and therefore of the cosmological parameters that shape our Universe (e.g. Wood-Vasey et al., 2007; Riess et al., 2007, and references therein). Historically, supernova surveys provided the first robust evidence for the existence of a positive cosmological constant (Riess et al., 1998; Schmidt et al., 1998). This inference has been confirmed by other independent probes, such as the location of the acoustic peaks in the Cosmic Microwave Background (Komatsu et al., 2008; Dunkley et al., 2008) and galaxy surveys (Eisenstein et al., 2005; Eisenstein, 2008), and the observed evolution of the mass function of galaxy clusters (Vikhlinin et al., 2008).
Since supernovae measure the luminosity distance at optical/infrared-infrared wavelengths, they suffer from a systematic uncertainty owing to the possible existence of intergalactic dust. In particular, ’grey’ dust which consists of large (m) grains that may preferentially reside in the intergalactic medium (IGM), can suppress the observed flux while producing little reddening (Aguirre, 1999a, b; Bianchi & Ferrara, 2005). Therefore, the presence of intergalactic grey dust could lead to a systematic overestimation of the luminosity distance, which would in turn modify the inferred values of the cosmological parameters. This becomes an important source of systematic uncertainty for future ambitious supernova surveys (performed e.g. on the Large Synoptic Survey Telescope (LSST)111http://www.lsst.org, or by the The Joint Dark Energy Mission (JDEM)222http://jdem.gsfc.nasa.gov/) which are designed to constrain the equation of state parameter of the dark energy, , to an unprecedented (percent level) precision. A systematic suppression of the supernova flux by a small amount of magnitudes due to grey dust would result in a best fit that is systematically offset by (Zhang, 2008).
Probing the grey dust content of the IGM is not only important for the purpose of limiting a source of systematic error for future supernova surveys. It is also related to the fundamental problem of how heavy elements were first produced in galaxies and then and then dispersed through outflows into the intergalactic medium (e.g. Heckman et al., 2000; Aguirre et al., 2001; Furlanetto & Loeb, 2003; Bianchi & Ferrara, 2005; Scannapieco et al., 2006; Davé & Oppenheimer, 2007; Oppenheimer & Davé, 2008). A measurement of the intergalactic dust abundance would serve as an important new constraint on theoretical models of the enrichment process of the IGM (e.g. Loeb & Haiman, 1997; Aguirre & Haiman, 2000; Inoue & Kamaya, 2004; Petric et al., 2006).
In this paper we constrain the abundance of intergalactic grey dust using two facts about the Soft X-ray Background (SXB): (i) Active Galactic Nuclei (AGN) account for of the total SXB (Hickox & Markevitch, 2006, 2007b, also see § 3); and (ii) the unresolved SXB component is partially accounted for by the known population of galaxies and X-ray clusters (Moretti et al., 2003; Hickox & Markevitch, 2007a, and see § 2.1). If large dust grain existed in the IGM, they would have scattered X-rays by sufficiently large angles to create extended X-ray halos around point sources (e.g. Alcock & Hatchett, 1978; Miralda-Escudé, 1999; Petric et al., 2006, and references therein). The lack of such a halo around any particular point source can be used to limit the grey dust abundance along its line-of-sight. Indeed, the absence of an X-ray halo around a quasar allowed Petric et al. (2006) to place an upper limit on the intergalactic abundance of dust grains with a radius of m. In this paper, we apply this pioneering approach to the SXB as a whole. The advantage of our methodology is that it does not require knowledge of the surface brightness profile for individual X-ray halos, which quite strongly depends on the assumed redshift evolution and size distribution of the intergalactic dust grains (see § 4).
In § 2 we describe the model used to place upper limits on the intergalactic opacity in grey dust. In § 3 we present our numerical results, whose implications are further discussed and compared to previous work in § 4. Finally, we summarize our final conclusions in § 5. Throughout our discussion, we adopt the standard set of cosmological parameters for the background cosmology, (Komatsu et al., 2008).
2 Constraints from the SXB
2.1 The Composition of the SXB
The total SXB in the 1–2 keV band amounts to erg cm-2 s-1 deg-2 (e.g. Hickox & Markevitch, 2006, their Fig. 15). As already mentioned, observed AGN account for of this flux (Hickox & Markevitch, 2006, 2007b, also see § 3). Hickox & Markevitch (2007a) showed that starburst and ’normal’ galaxies that are too faint in X-rays to be resolved, account for – of the SXB. Furthermore, as much as may be accounted for by spatially extended X-ray sources such as clusters (e.g. Wu & Xue, 2001; Moretti et al., 2003; Dijkstra et al., 2004, but see Hickox & Markevich 2006). Lastly, 1.0-1.7% of the SXB must consist of Thomson scattered X-rays that were originally emitted by AGN (Sołtan, 2003). Adding up these known contributions could, in principle, account for the full SXB. As a conservative working hypothesis, we therefore assume that X-ray halos – produced by dust scattering around AGN, cannot account for more than a fraction of the total SXB.
We do not simply adopt the unresolved X-ray background that has been derived by others: 333Hickox & Markevitch (2007a) estimate the flux in the unresolved SXB to be erg cm-2 s-1 deg-2, which is of the total. Similarly Moretti et al. (2003) claim that of the SXB in the energy range keV is unresolved. (e.g. Hickox & Markevitch, 2007a). When Hickox & Markevitch (2007a) measure the flux in the ’unresolved’ component they exclude regions around detected X-ray sources of radius , in which arcsec denotes the radius of the region in which of the flux of a point source is detected. X-ray halos that are a result of scattering off intergalactic dust are expected to be arcminutes in diameter (see § 2.2), which can be comparable to the size of the excluded regions. Therefore, a significant fraction of X-rays that were scattered by intergalactic dust would already be excluded from the measurement of the unresolved SXB. On the other hand, when measuring the soft X-ray luminosity from AGN, the X-ray flux from within is used, which contains a negligible fraction of X-rays that were scattered by intergalactic dust.
2.2 The Scattering Cross-Section of Dust Grains
The cross-section for scattering of radiation by a dust grain can be written in the form, , where is the radius of the grain (assumed to be spherical). Here, denotes the scattering efficiency, which is defined as the ratio between the geometric cross-section and the absorption cross-section of the grain, and is given by (Alcock & Hatchett, 1978; Miralda-Escudé, 1999),
| (1) |
The discontinuity at occurs when the electromagnetic phase shift across the grain reaches unity (Alcock & Hatchett, 1978; Miralda-Escudé, 1999). For a fixed grain size, Eq. (1) yields a constant cross-section up to a fixed threshold in photon energy , after which it declines as . All dust grains with radii m are equally likely to scatter all photons of energy less than . This important result allows us to place tight constraints on intergalactic dust. Equation (1) does not apply to arbitrarily low photon energies, and typically decreases drastically below unity at eV for grains of radius (see e.g. Fig 2-4 of Laor & Draine, 1993).
X-ray scattering by large dust grains can be described by a phase function of the form , in which arcmin (Mauche & Gorenstein, 1986). Furthermore, denotes the angle between the propagation direction of the photon before and after scattering (i.e. ). Hence, dust typically scatters X-ray photons forward into a halo around the source of angular size .
2.3 The Fraction of X-rays that is Scattered by Dust
The fraction of X-ray photons observed at energy that is expected to be scattered into X-ray halos by intergalactic dust is given by,
| (2) |
where we have defined the function , in which , and denotes the X-ray volume emissivity (in erg s-1 cMpc-3, see § 2.4).
The total optical depth to X-ray scattering by grey dust between redshift and for an observed photon energy is given by
| (3) |
where is the comoving number density of dust grains at a redshift , each having a cross section with given by Eq. (1). Equation (3) implicitly assumes that all dust grains are of the same size. For a distribution of grain sizes, Eq. (3) is generalized to the form,
| (4) |
where denotes the comoving number density of dust grains with radii in the range .
2.4 The X-ray Volume Emissivity
Since AGN dominate the SXB, we express the X-ray emissivity in terms of an integral over the AGN luminosity function,
| (5) |
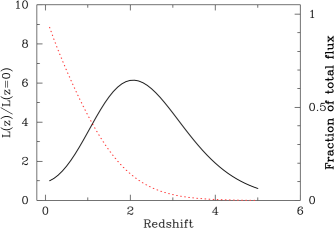
where denotes the comoving number density of AGN with a soft X-ray luminosity (integrated over the photon energy band between – keV) within the interval . For the X-ray luminosity function, , we use the fitting formula of Hopkins et al. (2007) with and =48.0. The redshift evolution of the comoving X-ray emissivity, , is shown in Fig. 1, where we have normalized to the present-day X-ray emissivity at . Figure 1 shows that the comoving emissivity peaks around a redshift . Also shown is the fraction of the total AGN contribution to the soft X-ray background that was emitted at redshifts (red dotted line): for example, we find that () of the total AGN contribution to the soft X-ray background comes from AGN at (). This implies that our method is most sensitive to dust at lower redshift (i.e. ).
The total soft X-ray background in the 0.5–2.0 keV band that one gets by integrating the X-ray emissivity of AGN over redshift is erg s-1 cm-2 deg-2, which accounts for of the total background in the 0.5–2.0 keV band, as calibrated by Moretti et al. (2003).
3 Constraints from the Unresolved SXB
In § 2.1 we argued that only a small fraction, , of the total SXB can be accounted for by X-ray halos around AGN due to scattering by intergalactic dust. AGN account for of the total SXB, and so we require that , where is given by Eq. (2) and where denotes the spectral energy density of the SXB. For simplicity, we take , but point out that our final results depend only very weakly on this choice. The constraint translates to a constraint on either (through Eq. 3, for a fixed grain size), or on (through Eq. 4 for a broad grain size distribution). Once these quantities have been constrained, we apply Eq. (3) and Eq. (4) to constrain the optical depth of the IGM to optical/infrared photons of observed energy eV (Å), which characterise supernova surveys. In this last calculation, we do not use just the scattering efficiency factor but rather the total efficiency for both scattering and absorption, . At the wavelengths of interest, the total efficiency for optical/infrared photons is regardless of the grain composition (provided that m; see Fig. 2-4 of Laor & Draine, 1993).
We focus on four different models, in which we assume either a single grain radius of m, or a continuous size distribution of the form with m and m, as implied by interstellar extinction within the Milky-Way galaxy(Mathis et al., 1977). Our constraints are most effective for m, since the scattering efficiency drops rapidly for smaller grains at X-ray energies keV (for which in Eq. 1). On the other hand, grains larger than m scatter X-rays into compact halos with angular sizes much smaller than arcmin. Especially photons with an observed energy of 2 keV that were scattered by these grains at higher redshift (say ) would be scattered into halos of radius arcsec. Hence, a significant fraction of the flux in these scattered X-ray halos may have already been included in the measurement of the AGN flux. In addition, we consider either a constant comoving dust density, or a comoving dust density that decreases with increasing redshift. In the evolving case, we assume that the comoving dust density traces the stellar mass density in the Universe, since dust is a by-product of star formation. In this case, the comoving dust density is proportional to the integrated star formation rate density, , where we use the fitting formula for that was derived by Hernquist & Springel (2003, their Eq. 51). Below we discuss our four models individually:
-
•
Model I: m and =constant. Figure 2 shows our upper limit on the opacity of the IGM to optical/infrared photons of observed energy eV (Å) out to a redshift , . The solid line shows our upper limit for , while the blue dashed lines (red dotted line) corresponds to (). Figure 2 implies that and . Our upper limit on the IGM opacity can be also expressed as an upper limit on the density parameter in dust (in units of the critical mass density g cm-3) of , where denotes the material density within the dust grains444This upper limit on is significantly higher than the upper limit quoted by Petric et al. (2006). However our constraints on are comparable (see § 4). This discrepancy arises because Petric et al. (2006) used for all values of , which significantly boosts the grain opacity per unit mass. (e.g. Ormel, 2008, and references therein).
-
•
Model II: and =constant. The red dotted line in Figure 3 shows the upper limit on obtained by requiring that . Our constraints on this model are weaker because the total opacity is now dominated by the smaller grains which are less efficient in scattering X-rays. Therefore, the overall number density of grains needs to be increased in order to produce the same opacity to X-ray photons; this in turn boosts the allowed opacity to optical/infrared photons. In this case, we get .
Our constraint on is slightly tighter in this model for the following reason. Consider the simplest case in which for all grain sizes of interest. The total mass that is required to produce a given would then scale as (where we assumed that ). Therefore, decreasing decreases the mass in dust that is required to produce a given . In reality, for grain size smaller than some threshold value that depends on the energy of the X-ray photons (Eq.1), which makes the -dependence of our constraint on a bit more complicated.
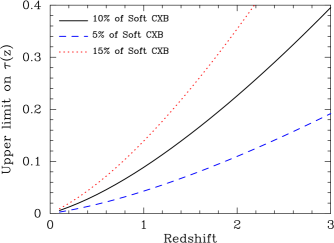
Figure 2: Upper limits on the opacity of the IGM to optical/infrared radiation (in the observer’s frame) out to redshift , , due to intergalactic dust grains with a radius of m. The solid line shows the constraint that is obtained when we assume that a fraction of the total SXB is accounted for by X-ray halos around AGN due to intergalactic dust scattering. Blue dashed (red dotted) lines show the upper limits for (). 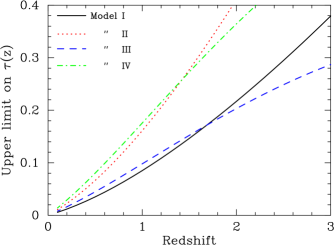
Figure 3: Same as Fig. 2 for and different choices of the grain size distribution or the redshift evolution of the intergalactic dust (see § 3 for a detailed description of each model). Our constraint on the IGM opacity to optical/infrared photons appears to be robust, and exhibits only a mild dependence on the details of the underlying model. -
•
Model III: m and . In this model, the number density of grains decreases with increasing redshift. For example, the number density of grains at (, ) is (, ) times its value at . For this reason, the IGM becomes increasingly transparent with increasing redshift compared to Model I, and increases more moderately towards higher redshifts than in Model I. For this model, we find that . The redshift dependence of our upper limit on scales as .
-
•
Model IV: and . The differences between this model and Model III are similar to the differences between Model I and Model II. We find that .
4 Discussion
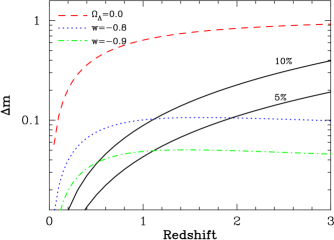
We next translate our upper limits on the opacity of intergalactic dust grains to an upper limit on the increase in the apparent R and I-band magnitude of optical/IR sources, . The black solid lines in Figure 4 show our upper limit on for and , in comparison to the effective dimming of sources as a result of a departure in the value of the luminosity distance from that predicted in the standard CDM cosmology. We compare our upper limit to the difference in the distance modulus (defined as the difference between the apparent and absolute magnitude of a source) for different cosmological models555Our constraint on actually depends weakly on the assumed cosmology. Suppose that the equation of state of dark energy is measured to be , where and denote the statistical and systematic errors, respectively. The systematic error is related to as . We have verified that , and the cosmology dependence of the upper limit on is not important..
The red dashed line shows the extra dimming in the standard CDM cosmology relative to the Einstein-de-Sitter Universe (, ). Clearly, our model upper limits are well below this line. This implies that our upper limit on the intergalactic grey dust abundance rules out the ’Einstein-De-Sitter Universe grey dust’ model for the luminosity distance inferred from supernova at . The blue dotted line (green dot-dashed line) shows the extra dimming that one expects for a Universe with , and or -0.9 relative to the standard CDM. At our upper limit on the intergalactic opacity with is comparable to the difference in the distance modulus for models with and .
Figure 4 suggests that at or the systematic uncertainty that is introduced by grey dust with is smaller than the boost in the distance modulus for a model with or , respectively. At higher redshifts, the possibility that dust mimics the behavior of dark energy with or for a Universe in which , is not ruled out yet. Also shown for completeness is our upper limit on the amount of attenuation by grey dust if , which implies that at .
In § 3 we inferred that for all models, which is comparable to the intergalactic dust density that is predicted for certain models (Aguirre, 1999b; Heckman et al., 2000). Suppose that we can constrain the intergalactic dust abundance down to a level of , then this would allow us to put valuable constraints on models of the enrichment of the IGM. Furthermore, constraints at this level would greatly reduce the systematic uncertainties introduced by grey dust to a level of . One way to get better constraints on the intergalactic grey dust abundance from X-ray observations is to put upper limits on the total X-ray flux in the halos surrounding individual X-ray point sources (as in Petric et al., 2006). Petric et al. (2006) obtained an upper limit on (assuming =constant, and m, which corresponds to our Model I), which is a factor of tighter than our constraint. However, in difference from our constraints, this result depends strongly on the assumed grain size (e.g. Mathis & Lee, 1991): e.g., grains with m () would scatter the X-rays over an area that is four (sixteen) times larger, which would weaken the upper limit by a corresponding factor of (). This technique is nevertheless powerful and can be applied to individual AGN at lower redshifts. For example, the observed flux from an equally luminous X-ray source at is times larger. Therefore, with an equally long X-ray observation one would be able to constrain the surface brightness of the scattering halo to a level that is times lower, thus greatly reducing the upper limit on . Stacking of the X-ray images of luminous nearby sources may reduce this upper limit even further.
We note that scattering of X-rays by smaller dust grains in the halos hosting the X-ray sources can also produce halos around sources (Predehl et al., 1991; Predehl & Schmitt, 1995). Furthermore, X-rays may also be scattered by large dust grains in our own galaxy. However, as long as X-ray halos are not observed, these additional opacities only render our upper limits more conservative. The absence of X-ray halos around individual AGN may therefore also constrain the opacity of the dust in spatially extended (several tens of kpc) winds that may surround quasars. On the other hand, if X-ray halos are detected there might be degeneracies in their interpretation.
Our constraint that is among the tightest in the literature. Aguirre & Haiman (2000) showed that the unresolved fraction of the Far Infrared Background (at m) can be used to constrain the intergalactic grey dust opacity to a level . Their upper limit applies to dust grains with radii m. Mörtsell & Goobar (2003) were able to put an upper limit on the total dimming by grey dust at the level (99% confidence level) by investigating the color evolution in the spectra of quasars at . Furthermore, More et al. (2008) constrained the intergalactic dust opacity to (95% confidence level. Note that the subscript ’D’ emphasises that this constrint refers to dust in general rather than grey dust) by comparing the luminosity distance to the angular diameter distance inferred from baryonic acoustic oscillations. This upper limit is significantly weaker than the upper limit derived in this paper. However, More et al. (2008) anticipate their upper limit to improve by a factor of within the next few years. The advantage of their test is that it works regardless of the composition of intergalactic dust (but this may be a disadvantage if one would like to constrain the physical properties of the intergalactic dust).
5 Conclusions
Scattering by dust grains in the Intergalactic Medium (IGM) produces diffuse X-ray halos around AGN, with a surface brightness that is typically too faint to be detected. Taking account of the X-ray emission by star forming galaxies and galaxy clusters, leaves only a fraction of the Soft X-Ray Background (SXB) to be possibly associated with these diffuse X-ray halos.
The SXB constrains the opacity of the intergalactic ’grey’ dust, which consists of large grains (m) that produce little reddening at optical/infrared wavelengths (Aguirre, 1999a). Thus, grey dust is a source of systematic uncertainty for supernova surveys that aim to improve the precision on measuring the redshift dependence of the luminosity distance, in an attempt to constrain the cosmic evolution of the equation of state of the dark energy.
Our analysis placed an upper limit on the dust opacity of the IGM to optical/infrared photons (with energy eV) of to (and to ; see Fig. 2). Our constraints are most effective for large dust grains with radii in the range –m. Our quoted upper limits are only weakly sensitive to the assumed size distribution of the dust grains within this size range, or to the precise redshift evolution of the overall dust content (see Fig. 3).
Significantly improved constraints may be obtained by stacking X-ray point sources in the redshift interval –. This approach has the potential to eliminate one systematic source of uncertainty for future supernova surveys which aim to determine the redshift dependence of the dark energy equation of state at the percent level of precision. Combining the constraints from X-ray observations with constraints from the unresolved Far Infrared Background (Aguirre & Haiman, 2000), the reddening666After the submission of our paper, Ménard et al. (2009) reported a detection of the reddening of quasars by intergalactic dust out to a few Mpc around galaxies at . The observed reddening implies a slope of the extinction curve, , which is consistent with that of interstellar dust (for which ). For the observed reddening corresponds to a cosmological dust opacity of and . The reported uncertainty on allows for a contribution of a grey dust component to the intergalactic dust opacity of comparable magnitude. (Mörtsell & Goobar, 2003; Ménard et al., 2009) and comparing the luminosity and angular diameter distances (More et al., 2008), may constrain further the properties of intergalactic dust. In addition, these techniques might also be used to search for spatial fluctuations in the intergalactic dust abundance.
Acknowledgments This research was supported in part by Harvard University funds. We thank Zoltán Haiman, Matthew McQuinn, Adam Lidz, and Ryan Hickox for helpful discussions.
References
- Aguirre (1999a) Aguirre, A. N. 1999a, ApJL, 512, L19
- Aguirre (1999b) Aguirre, A. 1999b, ApJ, 525, 583
- Aguirre & Haiman (2000) Aguirre, A., & Haiman, Z. 2000, ApJ, 532, 28
- Aguirre et al. (2001) Aguirre, A., Hernquist, L., Schaye, J., Katz, N., Weinberg, D. H., & Gardner, J. 2001, ApJ, 561, 521
- Alcock & Hatchett (1978) Alcock, C., & Hatchett, S. 1978, ApJ, 222, 456
- Bianchi & Ferrara (2005) Bianchi, S., & Ferrara, A. 2005, MNRAS, 358, 379
- Davé & Oppenheimer (2007) Davé, R., & Oppenheimer, B. D. 2007, MNRAS, 374, 427
- Dijkstra et al. (2004) Dijkstra, M., Haiman, Z., & Loeb, A. 2004, ApJ, 613, 646
- Dunkley et al. (2008) Dunkley, J., et al. 2008, arXiv:0803.0586
- Eisenstein et al. (2005) Eisenstein, D. J., et al. 2005, ApJ, 633, 560
- Eisenstein (2008) Eisenstein, D. J. 2008, Classical and Quantum Gravity, 25, 114001
- Furlanetto & Loeb (2003) Furlanetto, S. R., & Loeb, A. 2003, ApJ, 588, 18
- Goobar et al. (2002) Goobar, A., Bergstrom, L., Mortsell, E. 2002, A&A, 384, 1
- Heckman et al. (2000) Heckman, T. M., Lehnert, M. D., Strickland, D. K., & Armus, L. 2000, ApJS, 129, 493
- Hernquist & Springel (2003) Hernquist, L., & Springel, V. 2003, MNRAS, 341, 1253
- Hickox & Markevitch (2006) Hickox, R. C., & Markevitch, M. 2006, ApJ, 645, 95
- Hickox & Markevitch (2007a) Hickox, R. C., & Markevitch, M. 2007a, ApJL, 661, L117
- Hickox & Markevitch (2007b) Hickox, R. C., & Markevitch, M. 2007b, ApJ, 671, 1523
- Hopkins et al. (2007) Hopkins, P. F., Richards, G. T., & Hernquist, L. 2007, ApJ, 654, 731
- Inoue & Kamaya (2004) Inoue, A. K., & Kamaya, H. 2004, MNRAS, 350, 729
- Laor & Draine (1993) Laor, A., & Draine, B. T. 1993, ApJ, 402, 441
- Loeb & Haiman (1997) Loeb, A., & Haiman, Z. 1997, ApJ, 490, 571
- Mathis et al. (1977) Mathis, J. S., Rumpl, W., & Nordsieck, K. H. 1977, ApJ, 217, 425
- Mathis & Lee (1991) Mathis, J. S., & Lee, C.-W. 1991, ApJ, 376, 490
- Mauche & Gorenstein (1986) Mauche, C. W., & Gorenstein, P. 1986, ApJ, 302, 371
- Ménard et al. (2009) Ménard, B., Scranton, R., Fukugita, M., & Richards, G. 2009, arXiv:0902.4240
- Miralda-Escudé (1999) Miralda-Escudé, J. 1999, ApJ, 512, 21
- More et al. (2008) More, S., Bovy, J., & Hogg, D. W. 2008, arXiv:0810.5553
- Mörtsell & Goobar (2003) Mörtsell, E., & Goobar, A. 2003, Journal of Cosmology and Astro-Particle Physics, 9, 9
- Moretti et al. (2003) Moretti, A., Campana, S., Lazzati, D., & Tagliaferri, G. 2003, ApJ, 588, 696
- Komatsu et al. (2008) Komatsu, E., et al. 2008, arXiv:0803.0547
- Oppenheimer & Davé (2008) Oppenheimer, B. D., & Davé, R. 2008, MNRAS, 387, 577
- Ormel (2008) Ormel, C. W. 2008, Ph.D. Thesis,
- Perlmutter et al. (1999) Perlmutter, S., et al. 1999, ApJ, 517, 565
- Petric et al. (2006) Petric, A., Telis, G. A., Paerels, F., & Helfand, D. J. 2006, ApJ, 651, 41
- Predehl et al. (1991) Predehl, P., Braeuninger, H., Burkert, W., & Schmitt, J. H. M. M. 1991, A&A, 246, L40
- Predehl & Schmitt (1995) Predehl, P., & Schmitt, J. H. M. M. 1995, A&A, 293, 889
- Riess et al. (1998) Riess, A. G., et al. 1998, AJ, 116, 1009
- Riess et al. (2007) Riess, A. G., et al. 2007, ApJ, 659, 98
- Scannapieco et al. (2006) Scannapieco, C., Tissera, P. B., White, S. D. M., & Springel, V. 2006, MNRAS, 371, 1125
- Schmidt et al. (1998) Schmidt, B. P., et al. 1998, ApJ, 507, 46
- Sołtan (2003) Sołtan, A. M. 2003, A&A, 408, 39
- Wood-Vasey et al. (2007) Wood-Vasey, W. M., et al. 2007, ApJ, 666, 694
- Vikhlinin et al. (2008) Vikhlinin, A., et al. 2008, arXiv:0812.2720
- Wu & Xue (2001) Wu, X.-P., & Xue, Y.-J. 2001, ApJ, 560, 544
- Zhang (2008) Zhang, P. 2008, ApJ, 682, 721