GX 9+9: Variability of the X-ray Orbital Modulation
Abstract
Results of observations of the Galactic bulge X-ray source GX 9+9 by the All-Sky Monitor (ASM) and Proportional Counter Array (PCA) onboard the Rossi X-ray Timing Explorer are presented. The ASM results show that the 4.19 hour X-ray periodicity first reported by Hertz and Wood in 1987 was weak or not detected for most of the mission prior to late 2004, but then became strong and remained strong for approximately 2 years after which it weakened considerably. When the modulation at the 4.19 hour period is strong, it appears in folded light curves as an intensity dip over % of a cycle and is distinctly nonsinusoidal. A number of PCA observations of GX 9+9 were performed before the appearance of strong modulation; two were performed in 2006 during the epoch of strong modulation. Data obtained from the earlier PCA observations yield at best limited evidence of the presence of phase-dependent intensity changes, while the data from the later observations confirm the presence of flux minima with depths and phases compatible with those apparent in folded ASM light curves. Light curves from a Chandra observation of GX 9+9 performed in the year 2000 prior to the start of strong modulation show the possible presence of shallow dips at the predicted times. Optical observations performed in 2006 while the X-ray modulation was strong do not show an increase in the degree of modulation at the 4.19 hour period. Implications of the changes in modulation strength in X-rays and other observational results are considered.
Subject headings:
stars: individual — GX 9+9 (catalog ), X-rays : binaries1. Introduction
The bright Galactic X-ray source GX 9+9 has the characteristics of a low-mass X-ray binary (LMXB) system and particularly of the atoll-type LMXB subclass that is defined by the behavior of the source X-ray energy and power density spectra (Mayer, Bradt, & Rappaport, 1970; Schulz et al., 1989; Hasinger & van der Klis, 1989; van der Klis, 2006). A periodicity of hours in its X-ray flux was discovered using HEAO A-1 data by Hertz & Wood (1988). The periodic component was weak; its strength, in terms of the amplitude of the best-fit sinusoid, was approximately of the average flux. Hertz & Wood interpreted the modulation as indicative of the orbital period of the binary system. Under the assumption that the system consists of a 1.4 M☉ neutron star and a Roche-lobe-filling lower-main-sequence star, they inferred that the latter is an early M dwarf with mass 0.2-0.45 M☉ and radius 0.3-0.6 R☉. They used these values to put an upper bound on the orbital inclination of but, as noted by Schaefer (1990), apparently they calculated incorrectly; the correct bound on the inclination is .
Schaefer (1990) found variations of the brightness of the optical counterpart of GX 9+9 at essentially the same period, viz. hours. The modulation amplitude was about 0.19 mag peak to peak in the B band in 1987 and appeared to be somewhat larger in 1988. In the latter observations, the amplitude was roughly the same in each of the and bands.
Kong et al. (2006) carried out nearly simultaneous observations of GX 9+9 in 1999 in the optical at the Radcliffe Telescope of the South African Astronomical Observatory and in X-rays with the Proportional Counter Array (PCA) instrument on the Rossi X-ray Timing Explorer (RXTE). They found that modulation at the presumed orbital period was clearly present in the optical, but no modulation at that period was apparent in either the 2-3.5 keV or the 9.7-16 keV photon energy bands. Kong et al. also reviewed archival data from a 14.4 hour observation of GX 9+9 made with EXOSAT in 1983, a 6.6 hour observation made with ASCA in 1994, and a 6.4 hour observation made with BeppoSAX in 2000, but did not find significant evidence of the 4.19 hour periodicity.
Cornelisse et al. (2007) obtained phase-resolved spectra of the optical counterpart in 2004 May and found emission lines which comprise components with differing radial velocity variations that must originate in different places in the binary system, one of which is likely to be the X-ray-illuminated face of the secondary. The 4.19 hour period is clearly evident in the radial velocity variations. Thus, these observations strongly confirm that this is the orbital period. The phenomenon was most clear in the He II 4686 line but was also evident in the Bowen blend and around H. Following early reports of the detection of the 4.19-h period in the RXTE All-Sky Monitor (ASM) data and variation of the strength of the modulation (Levine, Harris, & Vilhu, 2006; Levine & Corbet, 2006), Cornelisse et al. (2007) used the ASM data to estimate the period and time of X-ray minimum. They were then able to relate the time of X-ray minimum, the phases of the radial velocity variations, and the variation of the brightness of the optical counterpart in the blue continuum to each other. They also derived model-dependent lower and upper limits on the binary mass ratio and on the orbital velocity of the secondary.
Herein we present the evidence that the X-ray photometric signature of the (presumed) binary orbit of GX 9+9 has undergone dramatic changes over the 12 years that the source has been monitored with the ASM. In addition to describing the results of our analysis of ASM data, we present results of analysis of a number of PCA observations, of an observation of GX 9+9 performed in 2000 with the Chandra X-ray Observatory, and of optical observations performed in 2006. In Section 2 we describe the instrumentation, observations, and the results from the observations. In Section 3, we summarize our results, suggest for the first time in the literature, to our knowledge, that the observed modulation is closely related to the dipping seen in other LMXBs, and discuss in general the possible implications of this investigation.
2. Instrumentation, Observations, and Results
2.1. ASM Observations and Results
The ASM consists of three Scanning Shadow Cameras (SSCs) mounted on a rotating Drive Assembly (Levine et al., 1996). Approximately 50,000 measurements of the intensity of GX 9+9, each from a 90-s exposure with a single SSC, were obtained from the beginning of the RXTE mission in early 1996 through 2007. A single exposure yields intensity estimates in each of three spectral bands which nominally correspond to photon energy ranges of 1.5-3, 3-5, and 5-12 keV with sensitivity of a few SSC counts s-1 (the Crab Nebula produces intensities of 27, 23, and 25 SSC counts s-1 in the 3 bands, respectively). For the analyses presented herein, we use observation times that have been adjusted so as to represent times at the barycenter of the Solar System.

The properties of the three SSCs have evolved over the years of operation of the ASM. SSC 1 (of SSCs 1 - 3) has a slow gas leak that has resulted in the photon energy to pulse height conversion gain increasing by about 10% yr-1 or about a factor of three over 12 years. A number of the proportional counter cells in SSCs 2 and 3 have become permanently inoperational at various times since the beginning of the mission because of catastrophic high voltage breakdown events that removed the thin carbon layer on the carbon-coated quartz fiber anodes of those cells. In all three detectors the properties of the carbon coatings of the anodes have gradually changed. These effects are, to first order, removed in the course of the standard analysis procedure of the raw ASM data by the ASM team that produces the light curve files. The procedure is adjusted so that the observed intensities of the Crab Nebula in the four energy bands are more or less stable and close to the intensities seen in SSC 1 in March 1996. The results in the 5-12 keV energy band from SSC 1 at late times are corrected by the largest factors since most events due to photons in this energy range in this SSC are not usable because they are saturated in the amplifiers. Thus, in preparing light curves from GX9+9 for this paper, we compared the results from SSC 1 with those from SSCs 2 and 3. We found that the SSC 1 light curve deviated negligibly from that produced from SSCs 2 and 3 before MJD 54200 and after that time gradually increased up to SSC ct s-1 above the intensities derived from SSCs 2 and 3 by MJD 54600.
The ASM light curve of GX 9+9 is shown in Figure 1. It was made using data from all three SSCs for times prior to MJD 54200 and from only SSCs 2 and 3 for times after MJD 54200. It shows a relatively strong source that varies on time scales of years. The intensity changes include a distinct sinusoidal-like component superimposed on a slowly increasing baseline. No spectral changes are apparent in the ASM light curves beyond small differences that are likely to be of instrumental origin.
To obtain a quantitative description of the long-period sinusoidal-like component, we fit the light curve shown in Figure 1 with the simple function
| (1) |
where is the model 1.5-12 keV X-ray intensity, is the time as a Modified Julian Date, is the to-be-determined period of the sinusoid, and and are also parameters to be determined. The best fit curve, with days, is shown superimposed on the ASM light curve in Figure 1. The fit is not good, i.e., the value of the reduced statistic is much greater than one. Given this fit quality and the small number of cycles of the sinusoid, we cannot confidently conclude that the long-term light curve contains a periodic component that is coherent over more than 3 cycles. Nonetheless, the form of the light curve suggests that some type of quasiperiodic long-term variability may be present.
In the early stages of a search for periodicities in ASM data using advanced analysis techniques, Shivamoggi (2005) applied the first of two primary strategies of improving the sensitivity of the search to high frequency variations, and detected the 4.19 hour periodicity in the ASM light curve of GX 9+9. The first strategy involves the use of appropriate weights such as the reciprocals of the variances in Fourier and other types of analysis since the individual ASM measurements have a wide range of associated uncertainties. The second strategy stems from the fact that the observations of the source are obtained with a low duty cycle, i.e., the window function is sparse (and complex). The properties of the window function, in combination with the presence of slow variations of the source intensity, act to hinder the detection of variations on short time scales. The window function power density spectrum (PDS) has substantial power at high frequencies, e.g., 1 cycle d-1 and 1 cycle per spacecraft orbit ( minute period). Since the data may be regarded as the product of a (hypothetical) continuous set of source intensity measurements with the window function, a Fourier transform of the data is equivalent to the convolution of a transform of a continuous set of intensity measurements with the window function transform. The high frequency structure in the window function transform acts to spread power at low frequencies in the source intensity to high frequencies in the calculated transform (or, equivalently, the PDS). This effectively raises the noise level at high frequencies.
In our analysis, the sensitivity to high frequency variations is enhanced by subtracting a smoothed version of the light curve from the unsmoothed light curve. To perform the smoothing, we do not simply convolve a box function with the binned light curve data since that would not yield any improvement in the noise level at high frequencies. Rather, we ignore bins which do not contain any actual measurements and we use weights based on estimates of the uncertainties in the individual measurements to compute the smoothed light curve. The “box” used in the smoothing had a length of 0.9 day, so the smoothed light curve displayed only that variability with Fourier components at frequencies below day-1. The smoothed light curve was subtracted from the unsmoothed light curve, and the difference light curve was Fourier transformed. The results are illustrated in Figure 2. The center frequency and width (half-width at half-maximum) of the peak correspond to a period of hours ( days).

To investigate the time variability of the orbital modulation, we folded the barycenter-corrected light curves for each of 30 equal time intervals at the 4.19344 hour period; see Figure 3. The figure shows that the modulation of GX 9+9 was weak during the first 5 years of the mission. It then seems to have appeared at a somewhat detectable level for a brief time in late 2001 and/or early 2002 (panel 15). In late 2004 or early 2005 the modulation grew stronger, and it stayed strong until late in 2006 when it began to decrease in strength. In the final two panels the modulation is not present at a significant level. We note that the interval of relatively strong modulation, i.e., approximately from MJD 53300 to MJD 54100, corresponds to a time interval in which the overall intensity is below the levels given by an interpolation from earlier to later times (see Fig. 1).

| Interval | Begin MJDaaModified Julian Date rounded to one decimal place. | Begin DatebbCorresponding to the rounded MJD. |
|---|---|---|
| 1 | 50135.0 | 1996 Feb 22 |
| 2 | 50279.4 | 1996 Jul 15 |
| 3 | 50423.8 | 1996 Dec 6 |
| 4 | 50568.2 | 1997 Apr 30 |
| 5 | 50712.6 | 1997 Sep 21 |
| 6 | 50857.0 | 1998 Feb 13 |
| 7 | 51001.4 | 1998 Jul 7 |
| 8 | 51145.8 | 1998 Nov 28 |
| 9 | 51290.2 | 1999 Apr 22 |
| 10 | 51434.6 | 1999 Sep 13 |
| 11 | 51579.0 | 2000 Feb 5 |
| 12 | 51723.4 | 2000 Jun 28 |
| 13 | 51867.8 | 2000 Nov 19 |
| 14 | 52012.2 | 2001 Apr 13 |
| 15 | 52156.6 | 2001 Sep 4 |
| 16 | 52301.0 | 2002 Jan 27 |
| 17 | 52445.4 | 2002 Jun 20 |
| 18 | 52589.8 | 2002 Nov 11 |
| 19 | 52734.2 | 2003 Apr 5 |
| 20 | 52878.6 | 2003 Aug 27 |
| 21 | 53023.0 | 2004 Jan 19 |
| 22 | 53167.4 | 2004 Jun 11 |
| 23 | 53311.8 | 2004 Nov 2 |
| 24 | 53456.2 | 2005 Mar 27 |
| 25 | 53600.6 | 2005 Aug 18 |
| 26 | 53745.0 | 2006 Jan 10 |
| 27 | 53889.4 | 2006 Jun 3 |
| 28 | 54033.8 | 2006 Oct 25 |
| 29 | 54178.2 | 2007 Mar 19 |
| 30 | 54322.6 | 2007 Aug 10 |
| 31ccThe end of interval 30. | 54467.0 | 2008 Jan 2 |
In Figure 4 we show folded light curves for the 1.5-3, 3-5, and 5-12 keV photon-energy bands as well as for the overall 1.5-12 keV band for the time interval of MJD 53300 through MJD 54075 when the modulation was strongest. The modulation appears to be largely energy-independent and, in particular, the spectrum of GX 9+9 does not significantly change during the dips. This is confirmed by the hardness ratios computed from these folded light curves by taking bin-wise ratios as shown in the right-hand side of Fig. 4.
We have used the folded light curves to determine the epoch of X-ray minimum, i.e., the time corresponding to the centroid of the dip-like feature. The best linear fit to the times of the minima is given by:
| (2) |
where the times are Modified Julian Dates in the UTC time system and apply at the barycenter of the Solar System. One should note that, per Fig. 4, dip activity may occur within cycles ( hours) of the times of minimum. It must be pointed out that this ephemeris is not consistent with that of Cornelisse et al. (2007); their time of minimum occurs at cycles relative to a time of minimum given by this equation.

2.2. PCA Observations and Results
The PCA consists of 5 mechanically-collimated large area Proportional Counter Units (PCUs) and is primarily sensitive to 2-60 keV photons (Jahoda et al., 2006, and references therein). A total of 61 observations of GX 9+9 were carried out with the PCA from 1996 through 2004. Only 29 of these were over one hour in duration; 17 were over 4 hours; the longest was hours. Twelve of the 29 observations were performed in the time period 1996-1999; 17 were performed between 2002 and 2004. In addition, per our request a pointed observation of GX 9+9 was carried out on June 20, 2006. One further observation of the source was carried out on September 1, 2006. GX 9+9 typically produced 500 to 700 cts s-1 PCU-1 in the 2-12 keV energy band in these observations.
For our periodicity search and X-ray “color” analyses using PCA data we have used data accumulated in Standard Mode 2 which provides counts in each of 128 pulse height channels for each PCU for 16 s time intervals. Data accumulated in various event and single-bit modes that provided a time resolution of 500 s or better were used for our fast-timing analyses. Background has been neglected for most of the timing analyses. However, in the analyses involving X-ray colors, the data have been corrected for both the background as well as gain drifts over the course of the mission. The times of the data have been corrected to the Solar System barycenter for all of the analyses presented herein.
In response to the discovery of the strengthening of the orbital modulation in the ASM data (Levine, Harris, & Vilhu, 2006), we searched the pre-2006 archival PCA data for evidence of the 4.19 h periodicity. In our search we used only the 29 observations that were longer than 1 hour. The total exposure obtained during these observations was ks. Since the ASM data show no significant modulation during the times of the observations, we expected to find no evidence of modulation in the PCA data.
We folded the barycenter-corrected data from the 29 observations at each of a grid of closely spaced periods centered on 4.19344 hrs. We did this for the energy bands 2-5, 5-12, and 12-30 keV. For each folded light curve we computed a statistic based on the hypothesis of no variation as a function of phase and plotted the resulting values against folding period. No significant peaks were found. We also found no significant changes in the color of the source that correlated with the phase of the folds.
This search for periodic modulation was done against a background of variability which tends to be stronger at higher than at lower photon energies. On timescales of 256 sec, the RMS variability seen in the PCA light curves, expressed as a fraction of the mean count rate, is in the 2-6 keV band, in the 6-10 keV band, and in the 10-16 keV band. On timescales of 24 min, the RMS is in the 2-6 keV band, in the 6-10 keV band, and in the 10-16 keV band. These results agree roughly with the ASM light curves, which yield a RMS intrinsic variability in each of the A, B, and C bands. This should be compared to the original variability estimate of Hertz & Wood (1988) who calculated a intrinsic source variability in addition to the sinusoidal modulation at the orbital period (4.19 hrs) in the 0.5-20 keV HEAO A-1 lightcurve.
While the folding analysis did not yield any evidence for persistent modulation that was stable in phase, upon examination of the individual pre-2006 PCA observations, dip-like events were evident on rare occasions; they are illustrated in Figures 5 and 6. In the light curve from the observation on 2002 May 1 (Fig. 5), the most well-defined dip-like event is seen near 12.5 hours. A weaker dip-like event is seen near 8.3 hours; it is not much more prominent than some other dip-like events in this observation. In the light curve from the observation on 2002 June 6 (top panel of Fig. 6), narrow dips are evident at about 0.6 and 5.3 hours. The times, orbital phases, and depths of these dips are given in Table 2. Prominent dips are not seen in the light curves from 2002 June 11, merely 5 days later, nor are they evident in the light curves from 2004 April 29. The dips seen on 2002 May 1 and on 2002 June 6 are shorter than the dips seen in the folded ASM light curves. The time of one of these dips is not centered on a time given by eq. (2), but the phases of all four may be consistent with the extent in phase of the dips seen in the folded ASM light curves. We did not find any other particularly noticeable dips in the light curves from any of the other pre-2006 PCA observations that were one or more hours in duration.


Per our request to the RXTE Mission Scientist for new observations, GX 9+9 was observed for 10 h with the PCA (and HEXTE) on 2006 June 20 (MJD 53906). The results are shown in three different energy bands in Figure 7. According to eq. (2); we find that the times of minimum flux should occur at hours and hours (TT) on 2006 June 20. Indeed, prominent dips in the intensity can be seen close to these predicted times in the two lower energy bands and at the earlier of the two times in the 10-18 keV band. Estimates of the times, orbital phases, and depths of these two dips are given in Table 2 wherein the depths are seen to be more or less independent of energy. It is not clear whether the second of these two dips is less prominent in the 10-18 keV band (Fig. 7) because of generally stronger variability at higher than at lower energies or, alternatively, that it actually is less deep and the uncertainty on the depth given in Table 2 is underestimated.
Another pointed observation was done on 2006 September 1 (MJD 53979). Like that on 2006 June 20, this one also took place during an interval (Fig. 3) in which the source exhibited strong modulation. With respect to the time reference used for the right half of Fig. 7, eq. (2) predicts times of minimum flux at and hours. In this observation, dips are evident near 11.7 and 15.9 hours. They are most apparent in the 2-6 keV band. The first dip is hardly evident in the 6-10 and 10-18 keV bands, perhaps because of a flare in which the spectral hardness undergoes a large increase. The dip near 15.9 hours is quite evident in both higher energy bands; times, phases, and fractional depths are given in Table 2. The depths of this dip are, like those seen on 2006 June 20, also more or less independent of energy. We have not determined the depths or phase of the dip near 11.7 hours because of its proximity to the flare.
The two dips seen in the 2006 June observation and the second dip seen in the 2006 September observation are comparable in terms of fractional depth with those seen in the folded ASM light curves (see interval 27 in Fig. 3), and are, as noted immediately above, energy independent to a good approximation. They are narrower ( orbital cycles) than the dips in the folded ASM light curves. The phases of the three dips fall within the extent in phase of the dips in the folded ASM light curves.


| Figure No. | ObsID | Energy Band | Centroid TimeaaTime relative to the origin in the figure. | Centroid TimebbCentroid time as a Modified Julian Date. | Orbital PhaseccComputed according to eq. (2). The uncertainty is the root-sum-squared of the 1-sigma errors in the projection of the ephemeris given in eq. (2) and the time of the dip centroid. The uncertainties in the dip centroid times are small in comparison with the ephemeris uncertainties. | Depth |
|---|---|---|---|---|---|---|
| (keV) | (hours) | (MJD) | (cycles) | (fraction) | ||
| 5 | 70022-02-01-01 | 2-6 | 52395.9195 | |||
| 5 | 70022-02-01-01 | 2-6 | 52396.0939 | |||
| 6 | 70022-02-05-00 | 2-6 | 52431.4034 | |||
| 6 | 70022-02-05-00 | 2-6 | 52431.6014 | |||
| 7(left) | 92415-01-01-00 | 2-6 | 53906.2584 | |||
| 7(left) | 92415-01-01-00 | 6-10 | 53906.2588 | |||
| 7(left) | 92415-01-01-00 | 10-18 | 53906.2585 | |||
| 7(left) | 92415-01-01-00 | 2-6 | 53906.4359 | |||
| 7(left) | 92415-01-01-00 | 6-10 | 53906.4359 | |||
| 7(left) | 92415-01-01-00 | 10-18 | 53906.4351 | |||
| 7(right) | 92415-01-02-00 | 2-6 | 53979.6640 | |||
| 7(right) | 92415-01-02-00 | 6-10 | 53979.6641 | |||
| 7(right) | 92415-01-02-00 | 10-18 | 53979.6642 |
After searching the PCA observations for evidence of persistent modulation, we attempted to determine whether or not the characteristics of the source’s high frequency PDS had changed since the increase of modulation. We also attempted to see if any change in the X-ray color related phenomenology had occurred in tandem with the modulation strength increase. We report on both the fast-timing and color analyses below.
2.3. Fast-Timing Analysis
Quasi-periodic oscillations (QPOs) are often seen in the X-ray intensities of neutron-star LMXBs (see the review by van der Klis 2006 and references therein). Theoretical considerations suggest that these oscillations are generated in the accretion disks, although there is no consensus on the details of the physical mechanisms causing the oscillations. GX 9+9 has never been reported to exhibit such QPOs (see, e.g., Wijnands et al., 1998). In this respect it is like the other bright atoll-type GX sources (van der Klis, 2006). Because of the discovery of the modulation-strength increase in the source, we reviewed all available PCA observations, but did not find statistically significant QPOs. In particular, the source did not exhibit statistically significant QPOs in the frequency range Hz during either the June 2006 or September 2006 observations.
2.4. Color Analysis
GX 9+9, like the other atoll-type GX sources, generally occupies the upper and lower banana regions in a soft color - hard color diagram (Schulz et al., 1989; Wijnands et al., 1998; van der Klis, 2006). We wondered whether the presence of strong modulation would have any impact on the details of the color-color diagram. We used data only from PCU 3 (of PCUs 1-5) for this analysis. The data were corrected for background and gain changes, and then used to make color-color diagrams for both the June 2006 and September 2006 observations. We then compared these with a color-color diagram made from all data from previous PCA observations of GX 9+9. We found no significant differences among the diagrams.
2.5. Chandra Observations
The Chandra X-ray Observatory (CXO) comprises a high angular resolution X-ray telescope and two focal plane cameras along with a pair of transmission diffraction gratings each of which may be placed in the X-ray beam just behind the mirror assembly for spectral observations. The ACIS-S focal plane array, which was used for the observation described below, is composed of 4 front-illuminated (FI) and 2 back-illuminated (BI) CCDs configured in a 6 by 1 array. It provides a field of approximately 8 arcminutes by 48 arcminutes. The on-axis effective area for either the FI or BI CCDs is 340 cm2 at 1 keV, and the spectral resolution is 20-50 (1-6 keV) for the FI CCDs and 9-35 (1-6 keV) for the BI CCDs. See Weisskopf et al. (2002) for further information.

A 20 ks long observation of GX 9+9 was carried out with the Observatory on 2000 August 22 beginning at 05:20:21 UTC (MJD 51778.2225); the ACIS-S instrument was used as the focal plane camera, and the High-Energy Transmission Grating (HETG) was in the X-ray beam. The zero-order image of GX 9+9 was placed on the back-illuminated CCD S3. The count rate of good events in the dispersed spectra, i.e., not including the counts in the zero-order image, is shown in Figure 8. Only small changes in the rate are evident. Among these changes are two shallow minima with depths of approximately 4% of the mean count rate that are approximately 15 ks apart. These times are consistent with the times of X-ray minimum according to eq. (2).
2.6. Optical Observations
We observed the field of GX 9+9 in June 2006 in white light, i.e., with no filter, with the CCD imaging camera on the 1.9 m Radcliffe Telescope of the South African Astronomical Observatory (SAAO). In order to achieve rapid read-out, we only used a 12796 pixel data area, giving a read-out cycle of 6 s. The observing run was seven nights, of which two were clouded out and two partially affected by poor weather. Seeing was variable, but under 1″ for substantial periods of the three good nights.
These observations were performed not long after the PCA observations of GX 9+9 on 2006 June 20 while the orbital modulation in X-rays was strong (see Figs. 3 and 7).

For each image, we subtracted a bias frame and divided by a flat field image prepared for each night. Since GX 9+9 is located between a bright star and two close fainter stars, aperture photometry does not yield reliable results in the presence of seeing variability. We therefore used the DAOphot-II software package (Stetson, 1987; Stetson et al., 1990) to fit a point spread function (PSF) to each stellar image; the image of the brightest star served as the PSF and photometric reference. Another star of similar distance from the reference star and similar brightness to GX 9+9 is used as a test of the photometric systematics. It shows a typical uncertainty of 0.01 mag (1 ) during stable conditions. The photometric results were further selected by rejecting those values which deviated by more than 0.05 mag from a 10 m local average and were then averaged in 1 m time bins. The resulting light curves from the three nights with the best conditions are shown in Figure 9.
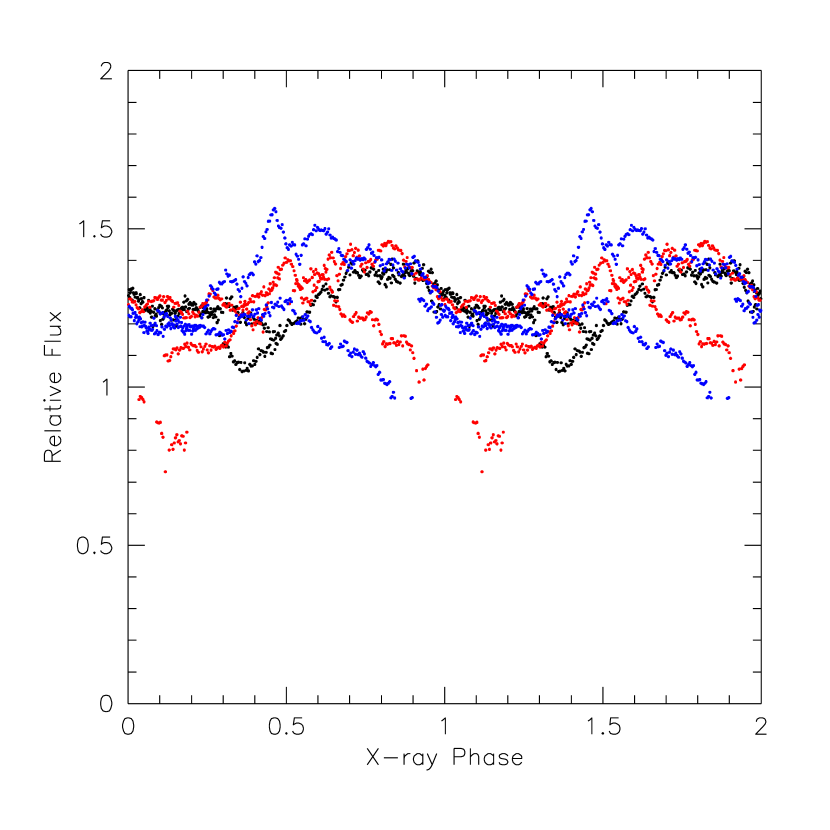
The light curves are plotted as a function of X-ray phase in Fig. 10. A marked decline in the intensity of the counterpart is apparent late in the observations particularly on the nights of June 23-24 and 24-25. Thus the tails of the light curves from these nights (shown in red and blue in Fig. 10) fall significantly below the other measurements at similar phases. This could easily be an atmospheric effect since the counterpart of GX 9+9 has a relatively blue spectrum compared to most stars deep in the Galactic plane and, thus, may have more blue or UV flux than the comparison star. Furthermore, the field was on the meridian at days before UTC during these observations, and was lowest in the sky near the end of the observations, especially on the nights of June 23-24 and 24-25 (cf. Fig. 9). This also suggests that the use of the comparison star to normalize the flux may not have removed other slow variations in the intensity of the counterpart of GX 9+9. If we discount the tails of the red and blue curves where they fall below the other photometric results, we find that the variability has a strong periodic component. The light curves roughly suggest that optical minimum comes near X-ray phase 0.2, but the non-periodic aspects of the light curves do not allow a firm conclusion to be drawn.
From a Lomb-Scargle periodogram of the data, we find the source varies roughly sinusoidally with a period 4.170.11 h, with shorter-term variability superposed. The amplitude of the 4.19 h modulation is roughly %. This is close to or slightly smaller than that seen in previous observations.
3. Discussion
The long-term ASM light curve of GX 9+9 shows that its intensity has changed slowly over the 12 years that it has been observed. The form of the variations suggest the presence of a periodicity with a period of 1400 to 1600 days, but the light curve is not well-fit by a simple linear function plus a sinusoid. Perhaps the variability is quasiperiodic in nature. Possible causes of the changes include 1) variation in the accretion rate due to the donor star being a long-period variable star that is undergoing small changes in size, 2) the presence of a third star in the system in a -day orbit around the center of mass of the other two stars which produces the variation by dynamical effects on the close pair (e.g., Mazeh & Shaham, 1979; Ford et al., 2000; Zdziarski et al., 2007), and 3) the presence of a tilted, precessing accretion disk (although the long period would be hard to understand if this is the correct explanation). In any case, it would certainly be of interest to extend the X-ray light curve by monitoring the intensity for many additional years. It would also be of interest to determine whether similar variation is also manifest in the optical band.
A detailed analysis of the ASM data has revealed significant changes in the amplitude of the orbital (4.19 h) modulation in the X-ray intensity. When strong, the modulation is characterized by energy-independent reductions in intensity that are limited in phase; the light curves are definitely nonsinusoidal in form.
We used the ASM data to determine an ephemeris for the times of X-ray minimum. Our epoch differs from that of Cornelisse et al. (2007); the epoch in the latter report occurs at a phase of cycles according to eq. (2). In response to our query, we were informed (R. Cornelisse, private communication) that the epoch of the time of minimum that is explicitly stated in §3.1 of Cornelisse et al. (2007) is indeed incorrect but the X-ray phases used for the analyses and figures in that paper actually had been calculated using the correct epoch.
While the modulation is strong (MJD 53300-54100), the intensity of GX 9+9 is reduced in comparison to that based on an interpolation from the 2003-2004 time interval to the 2007 time frame. However, the degree of modulation during two similar reduced-intensity time intervals (MJD 50300-51100 and MJD 51700-52500) was generally low (with the exception of a small part of the latter interval when it was of moderate strength as seen in interval 15 in Fig. 3).
PCA data obtained during the two-year interval when the X-ray modulation was strong show evidence of dip-like intensity reductions at orbital phases more or less consistent with the ASM folded light curves. The energy independence of the folded ASM light curves (Fig. 4) is confirmed by the results in Table 2 which show that the depths of the dip-like events seen in the PCA data are roughly independent of photon energy. The intensity of GX 9+9 is generally less variable at low X-ray energies, e.g., below 6 keV, than at higher energies. This random variability tends to mask the dip-like reductions at the higher energies. Thus, the reductions are more evident at low X-ray energies. PCA and Chandra data obtained prior to this two-year interval show that if dip-like events were present, they tended to be rather shallow. The dip-like intensity reductions, regardless if they occurred during the two year time interval when the modulation was strong on average or at other times, are relatively limited in phase; they generally lasted less than 0.1 orbital periods. On the whole, the PCA and Chandra data suggest that the form of the light curves seen in the ASM data is the result of the superposition of many dips with preferred but varying phases, depths, and widths.
The amplitude of the 4.19 h modulation in the 2006 optical observations is comparable to that seen in 1999 by Kong et al. (2006), to that seen in 2004 by Cornelisse et al. (2007), and also to that seen in 1987 and 1988 by Schaefer (1990) even though the X-ray modulation strength was much greater around the time of the 2006 observations than at the time of the 1999 or 2004 observations.
The light curves from the 2006 optical observations, which covered just over three orbital cycles, indicate that the time of minimum optical flux is likely around 0.2 cycles after the time of minimum X-ray flux given by eq. (2). However, this conclusion about the optical-to-x-ray phase relationship is not secure because of deviations in the light curves from one cycle to another. The light curves obtained by Kong et al. (2006) from just over four orbital cycles in 1999 present a similar picture; phase zero in their Figures 5 and 6 corresponds (by coincidence) to phase according to our X-ray ephemeris. Note that all four nightly folded light curves in their Fig. 6 have minima near phase 0.2. In contrast, Cornelisse et al. (2007) obtained light curves over three orbital cycles in 2004 and concluded that the time of minimum optical flux (in the continuum) corresponded closely to the time of minimum X-ray flux. Cornelisse et al. (2007) did not show the individual light curves nor do we know the precise time they used as the time of minimum X-ray flux. It is possible that the X-ray and optical light curves of GX 9+9 do not maintain a strict phase relationship. Extensive further observations will be needed to resolve this question.
The X-ray intensity reductions in GX 9+9 are grossly similar to the dips in 10 or more LMXBs such as 4U1915-05, X1254-690, EXO 0748-676, X1755-33, or X1746-370 that appear at certain (limited) orbital phases as absorption-like events. In such dipping sources the dips do not always occur at precisely the same orbital phases, often exhibit complicated structure, and often are stronger at low energies in a manner that suggests photoelectric absorption. The dips occur with a wide range of depths and can have durations up to as much as 25% or 30% of an orbital period. At one extreme, the source 4U1915-05 has exhibited dips that were essentially 100% deep, showed evidence of photoelectric absorption, and were, in some cases, temporally complex (Walter et al., 1982; White & Swank, 1982; Church et al., 1997). At the other extreme, the dips seen in X1755-33 were not much more than 30% deep, had essentially no energy dependence, and, at least in some cases, were relatively simple in their degree of structure (White et al., 1984; Church & Bałucińska-Church, 1993). It is common for the characteristics of the dips seen in a given source to vary; see, e.g., Bałucińska-Church et al. (2004) for a discussion of changes in the dipping amplitude for X1746-370, Parmar et al. (1986) and Homan et al. (2003) for reports on dipping activity in EXO 0748-676, and Smale & Wachter (1999) for a report on the entire cessation of dipping for a time in X1254-690.
No evidence of enhanced absorption at low energy is apparent in the folded ASM light curves that show the GX 9+9 dips. This is confirmed by a few dips seen in PCA light curves which also show that the intensity reductions do not have the degree of structure seen in individual orbital cycles in many dippers. However, the characteristics of dips seen in various sources are rather diverse, and the diplike events in GX 9+9 are reminiscent of the dips that were evident in the EXOSAT observations of X1755-33 (White et al., 1984; Church & Bałucińska-Church, 1993).
The dipping phenomenon has been explained at a general level as due to the occultation of the X-ray source by localized regions of enhanced density relatively far from the orbital plane around the place where the stream of gas from the donor impacts the accretion disk (Lubow & Shu, 1976; White & Swank, 1982; Walter et al., 1982). According to this general idea, dips will only be evident in those LMXBs whose orbital planes are inclined to the line of sight in a relatively narrow range, namely those not at such high inclinations that our line of sight to the neutron star always intercepts the high density parts of the disk nor those at such low inclinations that the line of sight is never intercepted by the thick structures in the gas stream/disk collision region. Since the present results on GX 9+9 are similar to those previously seen in X1755-33, they do not suggest extensions of the conventional picture, but they do indicate that GX 9+9 is viewed at relatively high inclination like the other dippers. The energy independence of the dips seen in GX9+9 may then be the product of different degrees of energy-dependent absorption of multiple emission components such as discussed by Church & Bałucińska-Church (1993) in the context of X1755-33 rather than the product of high ionization or elemental abundance anomalies (White et al., 1984). However, one should note that there is not at this time a full consensus on the interpretations of the observations of dips especially on the locations and sizes of the emission components and the degree of ionization of the absorbers (e.g., Church & Bałucińska-Church, 2004; Church et al., 2005; Díaz Trigo et al., 2006, and references therein).
References
- Bałucińska-Church et al. (2004) Bałucińska-Church, M., Church, M. J., & Smale, A. P. 2004, MNRAS, 347, 334
- Basko et al. (1974) Basko, M. M., Sunyaev, R. A., & Titarchuk, L. G. 1974, A&A, 31, 249
- Charles & Coe (2006) Charles, P. A., & Coe, M. J. 2006, in Compact stellar X-ray sources, eds. W. Lewin & M. van der Klis, Cambridge, UK: Cambridge University Press
- Church & Bałucińska-Church (1993) Church, M. J., & Bałucińska-Church, M. 1993, MNRAS, 260, 59
- Church & Bałucińska-Church (2004) Church, M. J., & Bałucińska-Church, M. 2004, MNRAS, 348, 955
- Church et al. (1997) Church, M. J., Dotani, T., Bałucińska-Church, M., Mitsuda, K., Takahashi, T., Inoue, H., & Yoshida, K. 1997, ApJ, 491, 388
- Church et al. (2005) Church, M. J., Reed, D., Dotani, T., Bałucińska-Church, M., & Smale, A. P. 2005, MNRAS, 359, 1336
- Cornelisse et al. (2007) Cornelisse, R., Steeghs, D., Casares, J., Charles, P. A., Barnes, A. D., Hynes, R. I., & O’Brien, K. 2007, MNRAS, 380, 1219
- Díaz Trigo et al. (2006) Díaz Trigo, M., Parmar, A. N., Boirin, L., Méndez, M., & Kaastra, J. S. 2006, A&A, 445, 179
- Ford et al. (2000) Ford, E. B., Kozinsky, B., & Rasio, F. A. 2000, ApJ, 535, 385
- Hasinger & van der Klis (1989) Hasinger, G., & van der Klis, M. 1989, A&A, 225, 79
- Haswell et al. (2001) Haswell, C. A., King, A. R., Murray, J. R., & Charles, P. A. 2001, MNRAS, 321, 475
- Hertz & Wood (1988) Hertz, P., & Wood, K. S. 1988, ApJ, 331, 764
- Homan et al. (2003) Homan, J., Wijnands, R., & van den Berg, M. 2003, A&A, 412, 799
- Jahoda et al. (2006) Jahoda, K., Markwardt, C. B., Radeva, Y., Rots, A. H., Stark, M. J., Swank, J. H., Strohmayer, T. E., & Zhang, W. 2006, ApJS, 163, 401
- Kong et al. (2006) Kong, A. K. H., Charles, P. A., Homer, L., Kuulkers, E., & O’Donoghue, D. 2006, MNRAS, 368, 781
- Levine et al. (1996) Levine, A. M., Bradt, H., Cui, W., Jernigan, J. G., Morgan, E. H., Remillard, R., Shirey, R. E., & Smith, D. A. 1996, ApJ, 469, L33
- Levine & Corbet (2006) Levine, A. M. & Corbet, R. 2006, The Astronomer’s Telegram, 940, 1
- Levine, Harris, & Vilhu (2006) Levine, A. M., Harris, R. J., & Vilhu, O. 2006, The Astronomer’s Telegram, 839, 1
- Liu et al. (2007) Liu, Q. Z., van Paradijs, J., & van den Heuvel, E. P. J. 2007, A&A, 469, 807
- Lubow & Shu (1976) Lubow, S. H., & Shu, F. H. 1976, ApJ, 207, L53
- Mayer, Bradt, & Rappaport (1970) Mayer, W., Bradt, H. V., & Rappaport, S. 1970, ApJ, 159, L115
- Mazeh & Shaham (1979) Mazeh, T., & Shaham, J. 1979, A&A, 77, 145
- Milgrom (1978) Milgrom, M. 1978, A&A, 67, L25
- Paizis et al. (2006) Paizis, A., et al. 2006, A&A, 459, 187
- Parmar et al. (1986) Parmar, A. N., White, N. E., Giommi, P., & Gottwald, M. 1986, ApJ, 308, 199
- Ritter & Kolb (2006) Ritter, H., & Kolb, U. 2006, VizieR Online Data Catalog, 1, 2018
- Schaefer (1990) Schaefer, B. E. 1990, ApJ, 354, 720
- Shivamoggi (2005) Shivamoggi, V. 2005, B.S. Thesis, Massachusetts Institute of Technology
- Schulz et al. (1989) Schulz, N. S., Hasinger, G., & Truemper, J. 1989, A&A, 225, 48
- Smale et al. (2002) Smale, A. P., Church, M. J., & Bałucińska-Church, M. 2002, ApJ, 581, 1286
- Smale & Wachter (1999) Smale, A. P., & Wachter, S. 1999, ApJ, 527, 341
- Stetson (1987) Stetson, P. B. 1987, PASP, 99, 191
- Stetson et al. (1990) Stetson, P. B., Davis, L. E., & Crabtree, D. R. 1990, CCDs in astronomy, 8, 289
- van der Klis (2006) van der Klis, M. 2006, Compact Stellar X-ray Sources, 39
- Vilhu et al. (2007) Vilhu, O., Paizis, A., Hannikainen, D., Schultz, J., & Beckmann, V. 2007, ArXiv e-prints, 705, arXiv:0705.1621
- Walter et al. (1982) Walter, F. M., Mason, K. O., Clarke, J. T., Halpern, J., Grindlay, J. E., Bowyer, S., & Henry, J. P. 1982, ApJ, 253, L67
- Weisskopf et al. (2002) Weisskopf, M. C., Brinkman, B., Canizares, C., Garmire, G., Murray, S., & Van Speybroeck, L. P. 2002, PASP, 114, 1
- Wen et al. (2006) Wen, L., Levine, A. M., Corbet, R. H. D., & Bradt, H. V. 2006, ApJS, 163, 372
- White & Holt (1982) White, N. E., & Holt, S. S. 1982, ApJ, 257, 318
- White, Nagase, & Parmar (1995) White, Nagase, & Parmar 1995, in “X-ray Binaries”, ed. Lewin, van Paradijs, & van den Heuvel (Cambridge U. P.), 1
- White et al. (1984) White, N. E., Parmar, A. N., Sztajno, M., Zimmermann, H. U., Mason, K. O., & Kahn, S. M. 1984, ApJ, 283, L9
- White & Swank (1982) White, N. E., & Swank, J. H. 1982, ApJ, 253, L61
- Wijnands et al. (1998) Wijnands, R., van der Klis, M., & van Paradijs, J. 1998, The Hot Universe, 188, 370
- Zdziarski et al. (2007) Zdziarski, A. A., Wen, L., & Gierliński, M. 2007, MNRAS, 377, 1006