Reconstruction of a Radiation Point Source’s Radial Location Using Goodness-of-Fit Test on Spectra Obtained from an HPGe Detector
Abstract
High purity germanium (HPGe) detectors are ubiquitous in nuclear physics experiments and are also used in numerous low radioactive background detectors. The effect of the position of 60Co and 137Cs point sources on the shape of spectra were studied with Monte Carlo and HPGe detector measurements. We briefly confirm previous work on the position dependence of relative heights of peaks. Spectra taken with the radiation sources placed at locations around the detector were then compared using the Kolmogorov-Smirnov (K-S) goodness-of-fit test. We demonstrate that with this method the Compton continuum spectral shape has good sensitivity to the radial location of a point-source, but poor angular resolution. We conclude with a study of the position reconstruction accuracy as a function of the number of counts from the source.
keywords:
High purity germanium (HPGe) detectors , spatial reconstruction , low background , Kolmogorov-Smirnov (K-S) goodness-of-fit test, , , ,
1 Introduction
High Purity Germanium (HPGe) detectors are used for -ray detection and spectroscopy in nuclear physics experiments, including low radioactive background detector systems, such as the proposed Majorana experiment [1]. Others have shown and explained how a detected spectrum shape can vary noticeably based on the position of a -emitting radiation source relative to the detector [2, 3, 4, 5]. We show that the Kolmogorov-Smirnov (K-S) test is sensitive to these changes as well. We also show that the radial position of nearby -emitting radiation sources can be accurately reconstructed using the K-S test to compare spectra taken at different locations.
2 Experiment
For our measurements, we used an EG&G Ortec HPGe detector model P40621A with a germanium crystal of length 93 mm and a diameter of 90 mm. It has an active volume of 582 cm The detector’s cryostat has a 1.0 mm aluminum endcap.
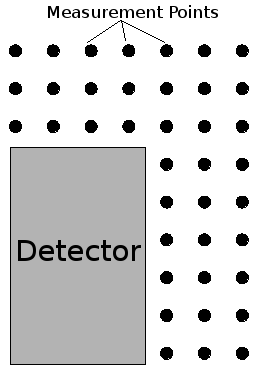
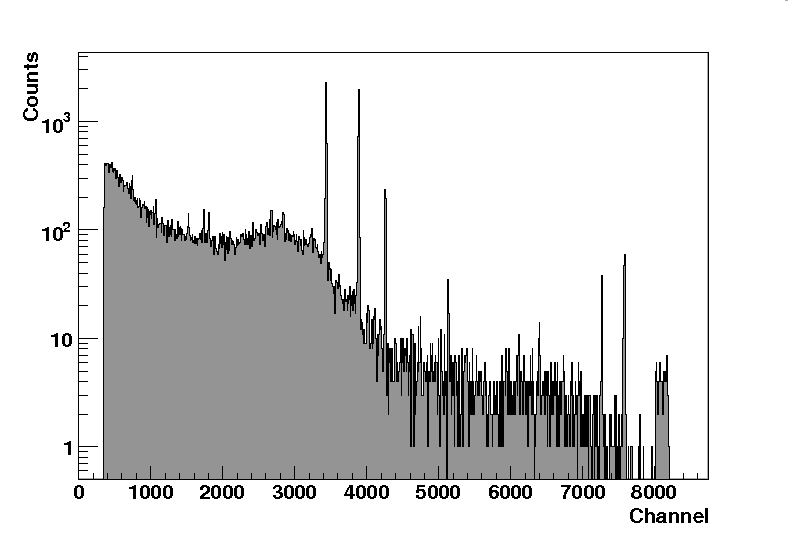
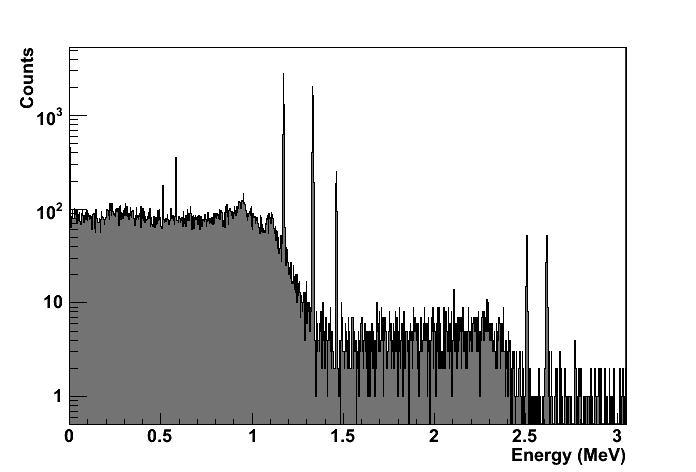
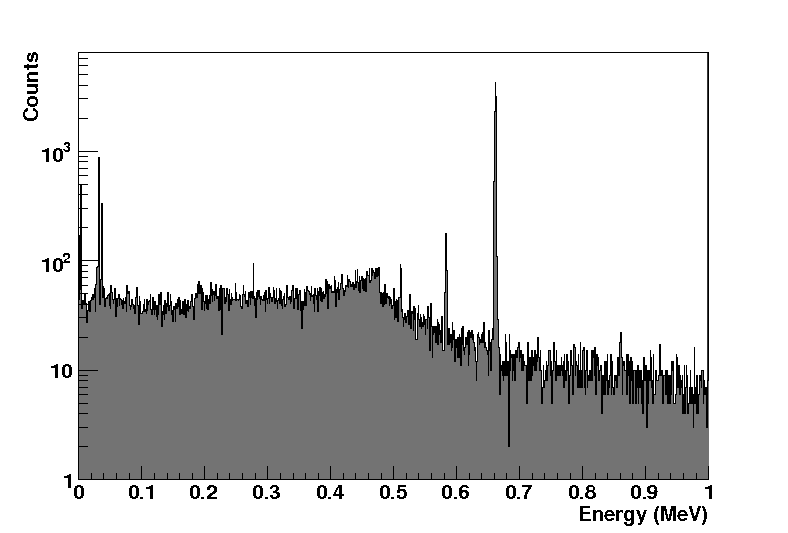
We obtained the -ray energy spectra of a 60Co point source at different positions around the detector. A flat piece of acrylic was taped to the detector cryostat can to hold the source at a set location. We moved the source along a grid with a 2 mm spacing that was marked on the acrylic sheet, as shown in Fig. 1. The source was started 5 mm from the detector endcap, and data points were taken until the source was approximately 35 mm away from the detector. Each data point was taken for 45 seconds, which yielded an average of 80 000 counts per spectrum. We also varied the exposure time in 5-second intervals from 5 to 45 seconds for a location 5 mm from the outer casing of the detector. This data was used to quantify statistical effects on the determination of the position of the 60Co source. An MCA acquired an energy spectrum from the HPGe detector during each run. As shown in Fig. 2, the major peaks identified on the spectra were the two 60Co peaks, at 1.173 MeV and 1.332 MeV, a background 40K peak at 1.460 MeV, a 60Co sum peak at 2.505 MeV, and a background 208Tl peak at 2.614 MeV. is a daughter isotope of naturally-occurring .

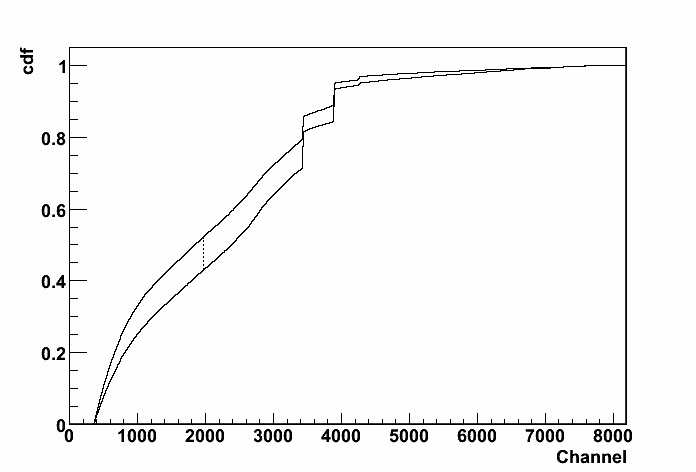

Analysis programs were coded in C++ and in ROOT [6] to compare a spectrum acquired at an arbitrary location (called a test spectrum) with the spectra taken at all locations (called the reference spectra). Specifically, it applied a well-known goodness-of-fit test, the Kolmogorov-Smirnov (K-S) test, between a test spectrum and all the reference spectra. The K-S test finds the maximum distance between two cumulative distribution functions, in our case the cumulants of the energy spectra. This maximum distance is inversely correlated to the likelihood that the two distributions came from the same distribution, and is converted into a probability using the Kolmogorov distribution [7]. This version of the K-S test is ideally used on unbinned data, but with binned data the output of the test is still a reliable measure of how similar the two distributions are if the bin-size is smaller than the energy resolution, as is the case here. We chose the K-S test as it is sensitive to subtle differences in the shape of spectra, conceptually simple, and computationally fast. We found that the logarithm of the K-S test value was a better indicator than the actual value of how correlated two spectra were. Typical cumulative distribution functions used in the study are shown in Fig. 3. Interestingly, these results indicate that the middle of the Compton continuum provides the K-S test with the most sensitivity to position-dependent differences in the spectral-shapes. It is less sensitive to the peak-to-Compton ratio, for example. This may also be a manifestation of the K-S test’s propensity to be less sensitive to the tails of distributions. Regardless, it still indicates that there is position-sensitive information contained in the spectral shape of the low-energy half of the Compton continuum.
A Monte Carlo simulation in GEANT4 [8] was used to simulate this experiment as well. The simulation geometries were created to match the actual experiment as closely as possible, and 60Co and 137Cs sources were simulated around the HPGe detector at the same locations the 60Co radiation source was measured around the physical detector. Typical simulation spectra are shown in Figs. 2 and 4. A Gaussian energy smearing was applied to include the effect of finite detector energy resolution. 40K and 208Tl backgrounds were also simulated. The intensity of the background in the simulations was varied to study the effects, as described later.
3 Results
3.1 Peak Analysis
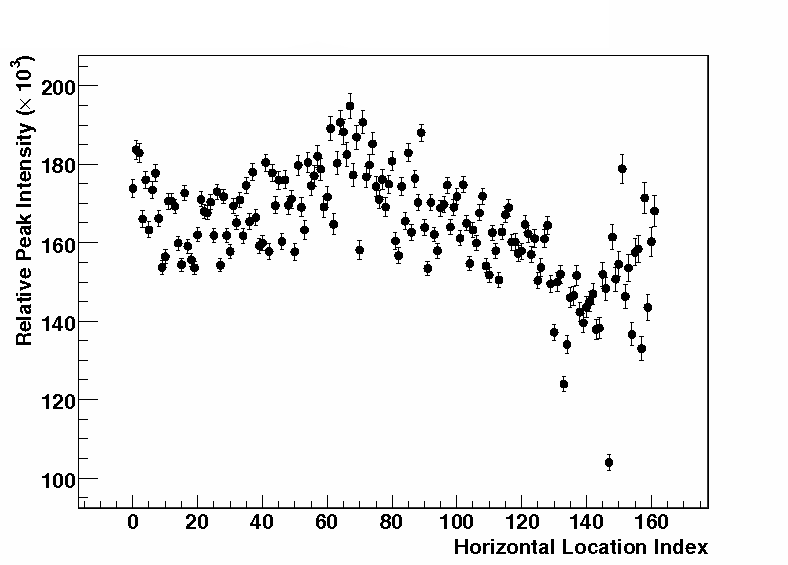
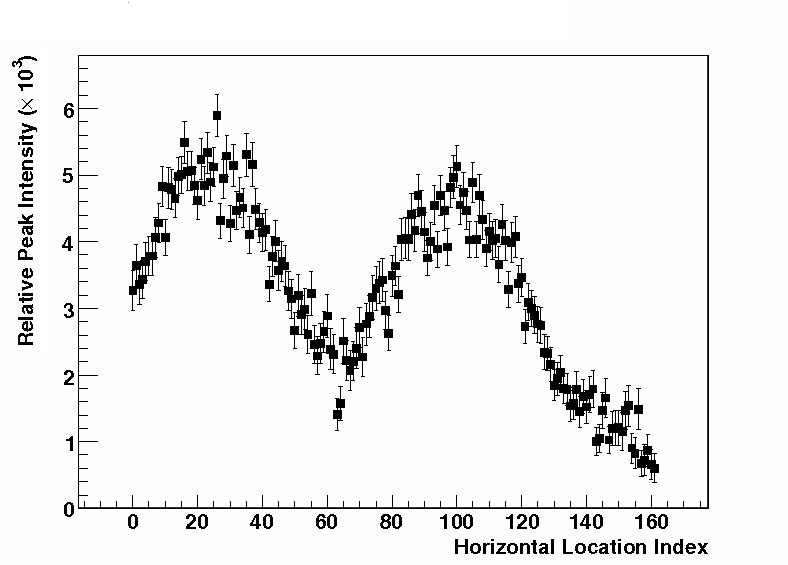
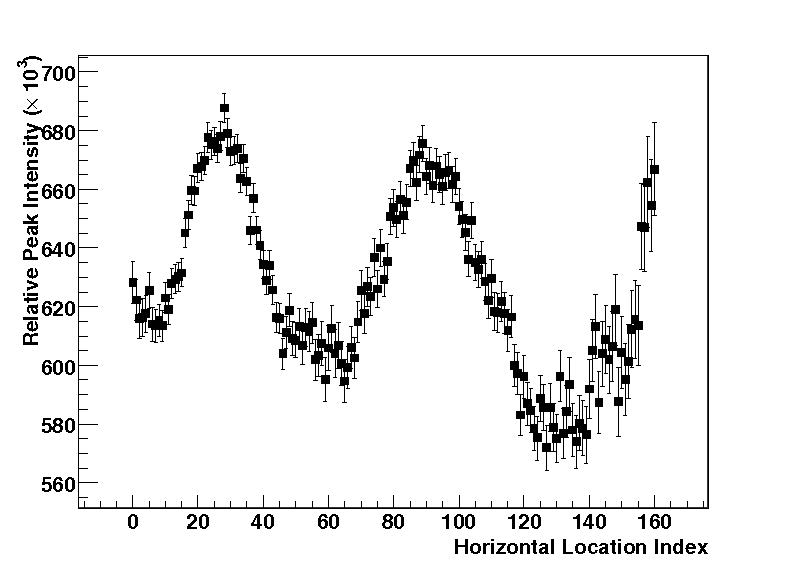
We performed a quick analysis to verify our analysis against earlier work concerning the peak-to-compton ratio. Fig. 5 shows the change in the 1.33 MeV peak area and the sum peak area relative to the total area as a function of position around the detector for physical 60Co measurements. Obviously, there is little variation in the relative 1.33 MeV peak area, but a clear trend is seen with the sum peak. When the radiation source was placed at the center of the front of the detector and halfway down the side of the detector, the relative sum peak area was roughly five times greater than when the radiation source was placed behind the detector. This is due to the fact that the solid angle subtended by the detector is greatest at the center of the front of the detector and the center of the side, as previously described in [9]. This difference was clearly visible without conducting statistical tests. The 1.17 MeV peak area differed with roughly the same distribution as the 1.33 MeV peak, with a difference in amplitude because the two peaks depend on the solid angle subtended by the detector in the same manner [4].
Fig. 5 shows the change in the 662 keV peak area relative to the total area as a function of position around the detector for simulated 137Cs data. Unlike the 1.17 MeV and 1.33 MeV 60Co peaks, a clear trend is visible.
3.2 Statistical Analysis with the Kolmogorov-Smirnov Test
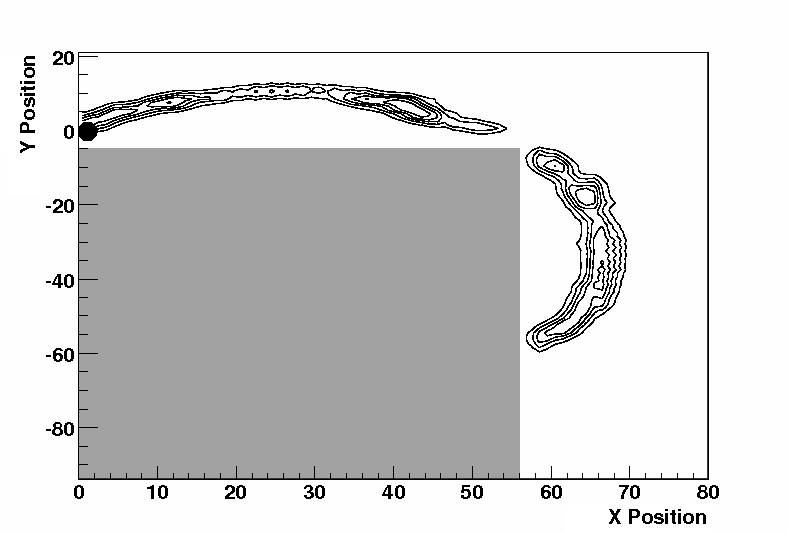
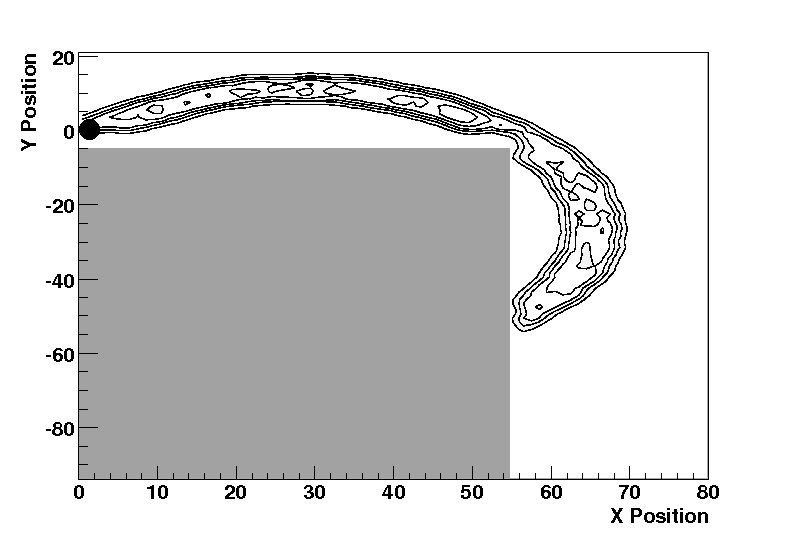

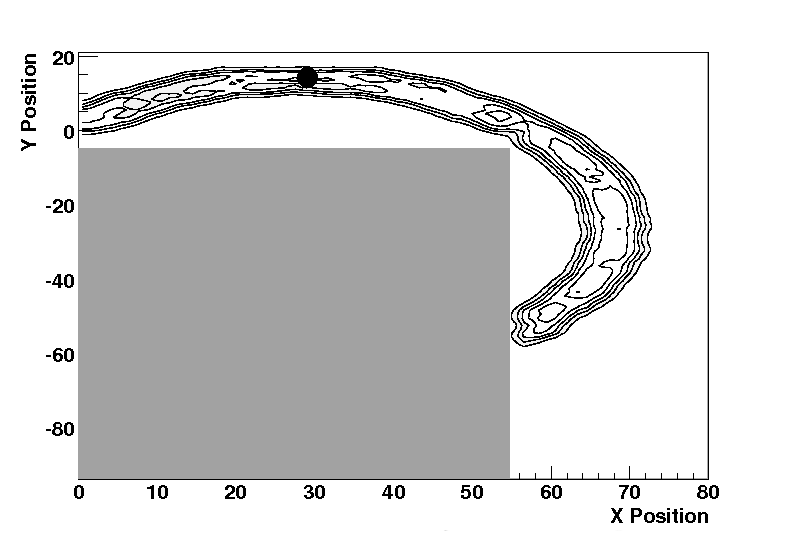

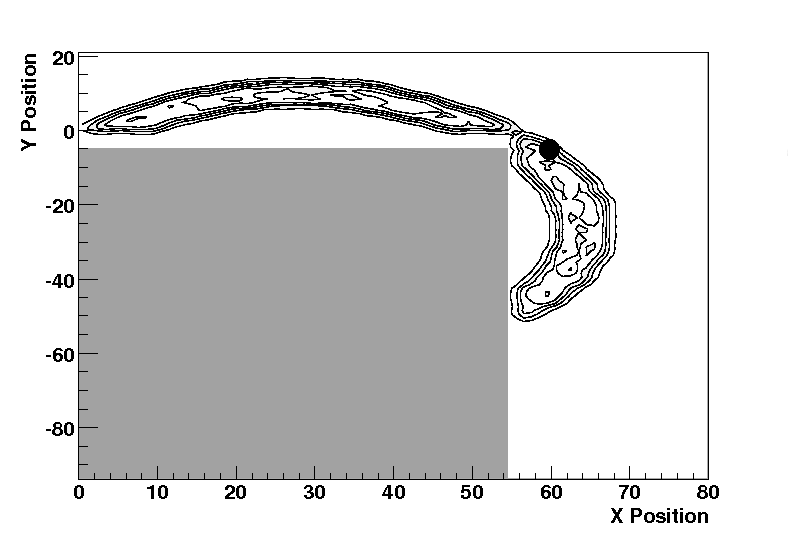
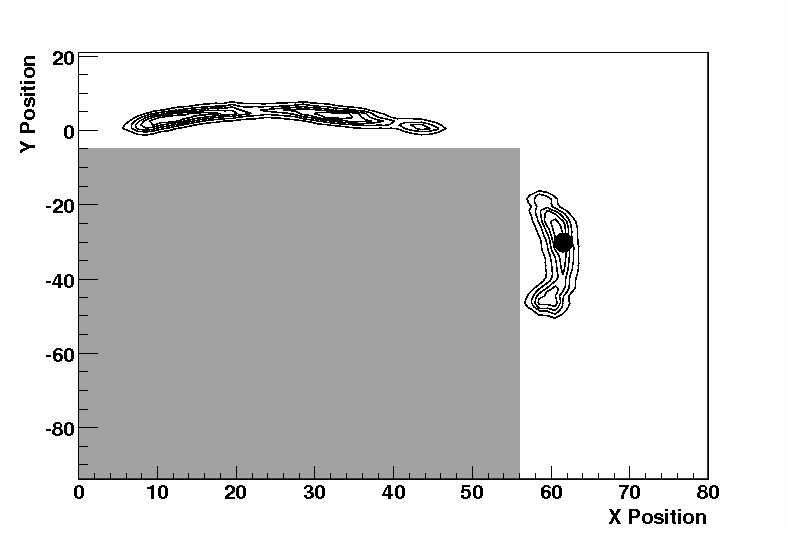
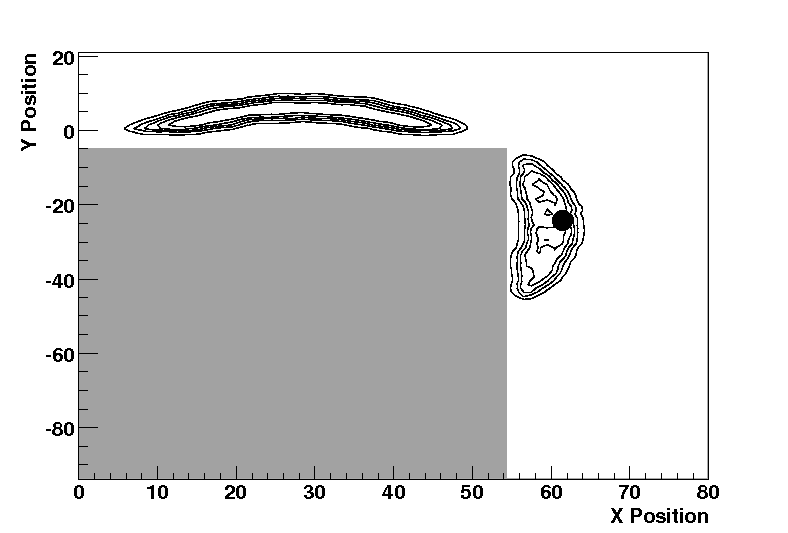
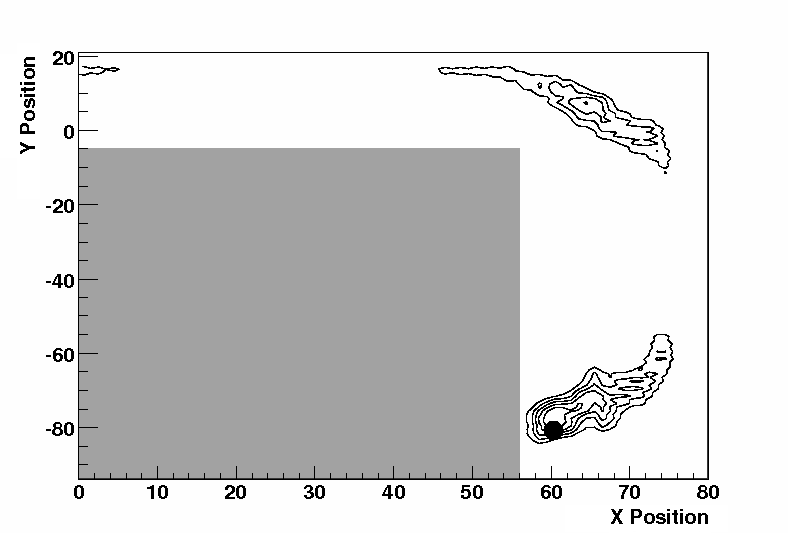
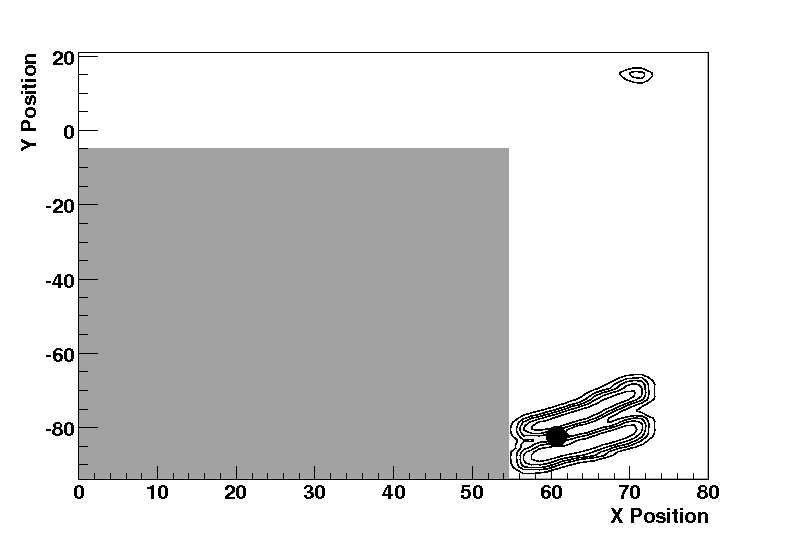
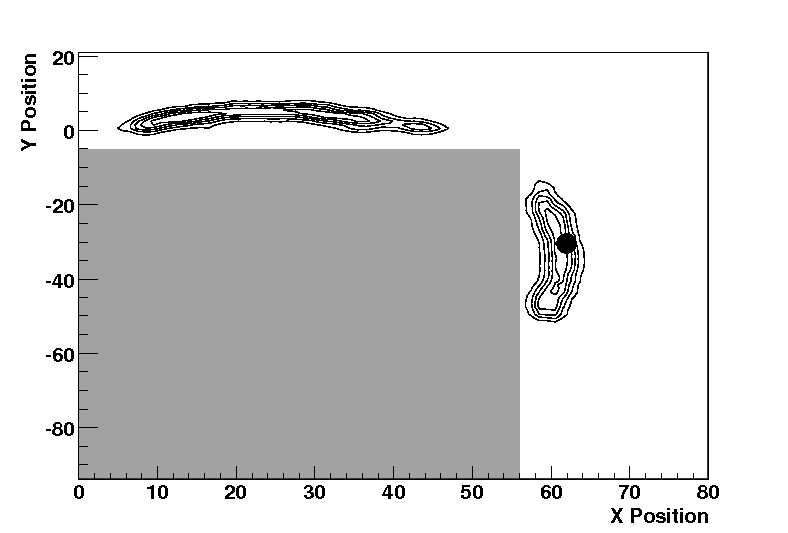
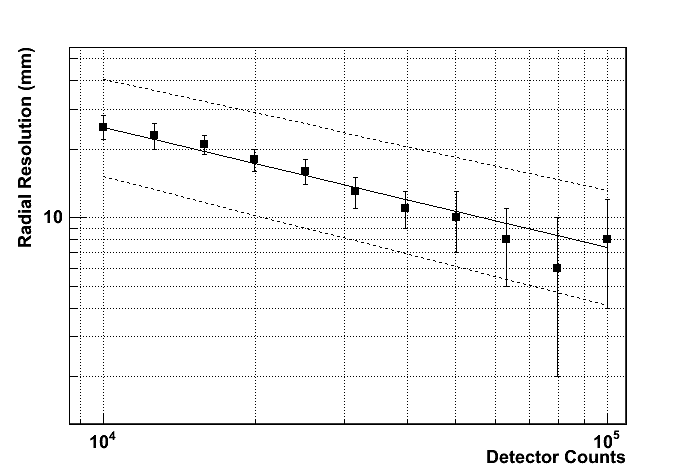
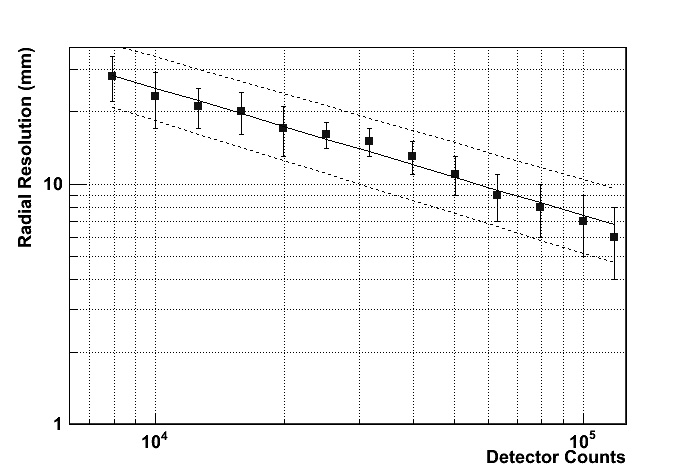
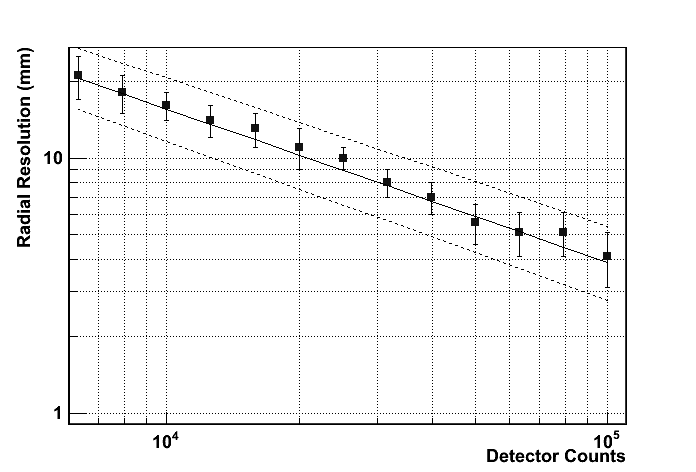


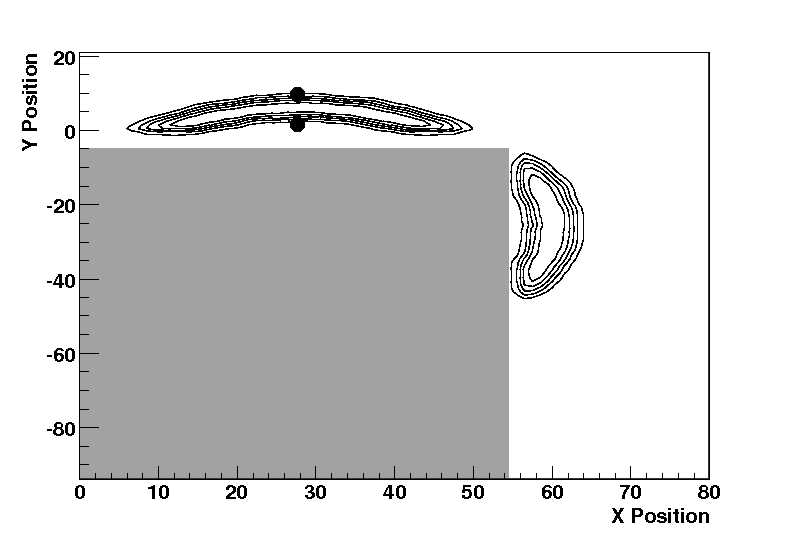
Fig. 6 shows the contour plots of the K-S test values for four different test spectra compared to the reference spectra for physical and simulated 60Co data. The resulting regions with high K-S values appear like rings on the plots, corresponding to approximately spherical shells in three dimensions. As the figure shows, the areas of high K-S test values do not necessarily point out the angular position of the source. Fig. 6 also indicates good agreement between data and Monte Carlo and gives us confidence in the simulated 137Cs results. We note there is a interesting ’double-arch’ structure in the bottom-most right plot of Fig. 6. This is likely due to picking a test point that lies between two reference spectra points. As shown in Fig. 7, a similar plot was made comparing the K-S test values for histograms filled up to (but not including) the 1.17 MeV peak in the 60Co spectrum. These plots were barely distinguishable from those when all peaks and overflow bins were included, showing that although the difference in the sum peak area relative to position was quite noticeable, the Compton continuum also has significant influence on the differences between the spectra. Similar results were seen with the simulated 137Cs data. This is consistent with our earlier observations of the dominant effect of the low-energy half of the Compton continuum on the K-S value.
Using test spectra from 20 randomly-selected points, we found that the radial position of the radiation source could be found to within 5 mm 95% of the time, yet the angular position could be found to this resolution only 20% of the time. We found that higher statistics resulted in lower K-S test values between the test spectrum and reference spectra for reference spectra that were further apart radially. This is shown in Fig. 8. For 60Co, we found the resolution to be well-described as a power-law that is proportional to a power of detector counts, indicating the statistical dependence of the resolution. For 137Cs, the resolution is better described by a power-law that is proportional to a power of detector counts. As shown in Fig. 9, with an increase in background, the resolution is still described by a power law with the same power of detector counts, but the absolute resolution increases as the number of background events increases, as expected. Nor surprisingly, this indicates that one can still improve the sensitivity of the radial resolution in the case of large backgrounds by collecting more statistics.
When the test spectrum is a spectrum that is the superposition of spectra from two distinct sources at different positions, the rings of Fig. 6 widen, with the amount it widens determined by how far apart the two sources are. These rings are in between where the rings for each individual source would be, with the exact location determined by the difference in intensity of the two sources. This is shown in Fig. 10.
4 Conclusions
We were able to accurately reconstruct a bright, nearby radiation point source’s radial position using an array of reference spectra and the K-S test. We were also able to accurately reproduce these results using Monte Carlo simulations, indicating that this method can be used by comparing detector spectrum to sets of simulated spectra. The K-S test appears to be most sensitive to spectral shape effect in the Compton-continuum. However, using our method we were not able to gain good angular position information about a radiation source. Future work will determine the limits of this techniques using unbinned data and low statistics. Low background HPGe detector arrays, such as Majorana, can potentially use this technique along with relative rates in detectors to determine the location of unwanted hot-spots in the detector array that were inadvertently introduced during construction. This technique is also applicable to other gamma-ray spectrometers, such as NaI and cryogenic bolometer detectors. We also want to point out one note of caution with using the K-S test in the presence of sharp peaks. The K-S test would indicate incompatible distributions when comparing spectra with peaks that are slightly offset from each other, ie. when there exist slight binning misalignments, calibration offsets, or simulation-vs.-data errors. Care must be exercised the ensure the proper calibration and alignment of the spectra’s histogram bins.
5 Acknowledgements
We would like to thank the LENA group and Prof. A.E. Champagne for the use of the LENA HPGe detector. This work is supported under in part by DOE NP Grant # DE-FG02-97ER41041 and the State of North Carolina.
References
- [1] C.E. Aalseth et al [Majorana Collaboration] Nucl. Phys. B (Proc. Suppl.) 138 (2005) 224.
- [2] H.I. Bak, Y.D. Bae, M.S. Kim, and H.D. Choi, Nucl. Instr. and Meth. A 366 (1995) 332-339.
- [3] R.G. Helmer, R.J. Gehrke, and R.C. Greenwood, Nucl. Instr. and Meth. A 123 (1975) 51-59.
- [4] G.F. Knoll, in Radiation Detection and Measurement (John Wiley & Sons, 2000).
- [5] P.C. Lichtenberger and I.K. MacKenzie, Nucl. Instr. and Meth. 116 (1974) 177-179.
- [6] R. Brun and F. Rademakers, Nucl. Instr. and Meth. A 389 (1997) 81-86. See also http://root.cern.ch/.
- [7] G.K. Kanji in 100 Statistical Tests, 3rd edition (SAGE Publications Ltd., 2006)
- [8] S. Agostinelli et al. [GEANT 4 Collaboration], Nucl. Instr. and Meth. A 506 (2003) 250.
- [9] M.J. Prata, Radiat. Phys. and Chem. 67 (2003) 599-603.