Robustness of Transcriptional Regulation
in Yeast-like Model Boolean Networks
Abstract
We investigate the dynamical properties of the transcriptional regulation of gene expression in the yeast Saccharomyces Cerevisiae within the framework of a synchronously and deterministically updated Boolean network model. By means of a dynamically determinant subnetwork, we explore the robustness of transcriptional regulation as a function of the type of Boolean functions used in the model that mimic the influence of regulating agents on the transcription level of a gene. We compare the results obtained for the actual yeast network with those from two different model networks, one with similar in-degree distribution as the yeast and random otherwise, and another due to Balcan et al., where the global topology of the yeast network is reproduced faithfully. We, surprisingly, find that the first set of model networks better reproduce the results found with the actual yeast network, even though the Balcan et al. model networks are structurally more similar to that of yeast.
INTRODUCTION
Recent advances in biotechnology allowed the accumulation of a vast amount of experimental data on intra-cellular processes, however, our knowledge on how a cell works remains incomplete [Lockhart & Winzeler, 2000; Barabasi & Olvai, 2004]. The key component of the functional organization in a cell is the regulation of gene expression. By now, interacting gene pairs for several organisms have been identified with significant coverage [Bergmann et al., 2003]. In particular the set of regulatory interactions identified in Saccharomyces Cerevisiae are believed to be close to complete [Teixeira et al., 2006].
The activation/suppression dynamics in a cell evolves on a complex and inhomogeneous network of interactions. Therefore, the framework of graph theory serve as a powerful mathematical tool for studying the regulation of the gene expression on cellular level [Albert & Barabási, 2002; Bollobas, 1998; Milo et al., 2002; Colizza et al., 2006; Newman, 2001; Barabasi & Olvai, 2004]. The topology of the graph describing the gene regulatory network (GRN) is far from being random and has been studied for several organisms, in particular the budding yeast [Guelzim & et al., 2002; Nicholas & et al., 2004; Bergmann et al., 2003].
Deterministically and synchronously updated Boolean networks have been used widely as a model for regulatory dynamics [Kauffman, 1969; Aldana, 2003; Balcan & Erzan, 2007, 2006]. In this model, the expression levels of genes are discretized to take values 0 or 1 at each time step. Although it is a major oversimplification [Norrell et al., 2007], this approach has proven valuable in the context of gene regulation [Mendoza et al., 1999; Espinosa-Soto et al., 2004; Albert & Othmer, 2003].
The network topology of the yeast’s GRN is now believed to be unveiled to a large extent. However the nature of interactions, i.e., the rules that govern the dynamics, are not known in comparable detail. Accordingly, a statistical approach involving randomly assigned functions is relevant. Several classes of such functions have been investigated in the literature. The unbiased choice is to pick random Boolean functions. On the other hand, it has been claimed that experimental data is consistent with a subset of Boolean functions where one of the output is fixed for a particular value of one of the inputs (canalizing functions) [Harris & et al., 2002]. It has also been suggested that a subset of canalizing functions (nested canalizing functions) is more appropriate for gene regulation dynamics on yeast [Kauffman et al., 2003]. A more recent study finds that two subclasses of the nested canalizing functions are actually dominant in the yeast [Nikolajewa et al., 2006].
The computational bottleneck in the analysis of Boolean network dynamics is the fact of that number of states increases exponentially with system size. This makes an exhaustive enumeration prohibitive, even if, in most cases, a fraction of the nodes can be left outside the analysis due to their irrelevance to the dynamics by virtue of either the topology or the choice of the function set [Socolar & Kauffman, 2003]. In this paper, we determine and use a strongly connected subset of the genes that dictates the network’s dynamical character and use a statistical approach to identify its robustness.
The paper is organized as follows. In the Method section, we present the yeast’s gene regulation network, describe the employed Boolean dynamics, define the function classes used for setting the rules of the dynamics, propose a dynamically relevant subnetwork and the model networks used for comparison with yeast. In the Result section, we present and analysis of the yeast’s GRN dynamics, in particular exploring the robustness of the network under small perturbations, comparing the results for different types of functions and for the actual vs. model network topologies. We discuss our findings in the last section.
METHOD & MODELS
Transcriptional regulation of gene expression in a cell operates through transcription factors (TFs). These proteins bind the DNA on “promoter regions” (PRs) that act as the regulation centers of each gene. The details of this interaction can be very complex. In our study, as in past studies in the literature, we assume that effect of the TFs that regulate a certain gene can be summarized in a Boolean function whose inputs represent the presence or the absence of TFs and the output determines whether the gene is activated or inhibited for the given expression profile of the TF genes.
The regulation dynamics evolves on a directed graph, whose nodes are the genes and a directed edge from to indicates that the product of regulates . The corresponding network for Saccharomyces Cerevisiae can be retrieved from YEASTRACT database [Teixeira et al., 2006] (www.yeastract.com). In order to be able to compare our results with past studies, we here consider an earlier version (2005) of the network including 4252 genes (with 146 TFs) with 12541 interactions. As explained below, we also consider two model networks, one with a similar in-degree distribution as the yeast network above and random otherwise, and another with a topology highly similar to that of yeast, which emerges from a null-model proposed earlier [Balcan et al., 2007].
The Boolean regulation dynamics on these networks is investigated by means of a synchronous and deterministic update of the network state as follows: Each node (gene) has a state at a particular time where is either 1 (on) or 0 (off). The network state is the set of individual node states: . is determined by the Boolean function assigned to , which is a function of the states of the neighbor nodes connected to by incoming edges. We used four types of random function classes found in the literature as described below.

1- Simple Random Function, RF:
The rule table is constructed by setting the output for each input combination to 1 with probabilty and 0 otherwise, independent of the input.
2- Canalizing Random Function, CF:
A subclass of the RFs, that has at least one canalizing input variable whose canalizing value determines the output [Kauffman, 1993; Kauffman et al., 2003].
| (1) |
where jth in-neighbor is the canalizing node with as the canalizing value and as the canalizing output. Again, the output is determined through the parameter . When the canalization condition is not satisfied, in Exps. 1 is considered to be a RF.
3- Nested Canalizing Random Function, NCF:
Nested Canalizing or Hierarchically Canalizing functions are believed to better model gene regulation in biological systems [Kauffman et al., 2003]. They form a subclass of CFs, where one defines a canalizing order to the input nodes and the output is determined by the first node in its canalizing value:
| (2) |
We modify the original definition in [Kauffman et al., 2003], for the sake of an unbiased comparison with the other cases, by determining the outputs with the parameter as before.
4- Special Subclasses of Nested Canalizing Random Function, SNCF:
Following Nikolejewa et al., one can represent the NCFs above in a “minimal logical expression” [Nikolajewa et al., 2006]:
| (3) |
where represents either AND or OR logical function, i.e. and stands for a possible negation of , i.e. . Upon investigation of Harris et al. data [Harris & et al., 2002]222private communication they found that gene regulatory rules are mainly governed by two subclasses of NCF:
| (4) |
and
| (5) |
with and probability of occurrence, respectively. For these two functions, is not a free parameter and depends on the topology.
Once the network topology and the functions are fixed, the Boolean dynamics is characterized by a set of limit cycles which are the attractors of the dynamics reached from different initial conditions. Since these are the regions of the state space where the dynamics converges to, one expects them to be biologically relevant. For example, they have been associated with different phenotypes of the plant Arabidopsis thaliana [Mendoza et al., 1999] when the involved genes are those that take part in cell differentiation. We have investigated and compared the number, cycle-length, transient length, and the basin of attraction of the attractors in each case. These results will be presented elsewhere [Tuğrul & Kabakçıoğlu, expected in 2009]. Here, we deal with another dynamical property, the robustness of the attractors to perturbation. We use the following arguments to measure the robustness as given by Aldana [Aldana, 2003]. Consider two copies of a network at states and . Their Hamming Distance is the number of nodes that differ between the two:
| (6) |
Let , where is the number of the nodes in the network. One defines the robustness of the network as
| (7) |
The system is robust against perturbations (ordered) if , whereas it is highly sensitive (chaotic) otherwise. It was suggested by Kauffman [Kauffman, 1993] that the genetic regulatory networks function at the edge of chaos, where . The quantity can be estimated analytically for the RF case under an annealed approximation, both for random [Derrida & Pomeau, 1986] and power-law networks [Aldana, 2003]. Derrida’s result for random networks is
| (8) |
where is, again, the unbiased probability that a binary function assigned to a node returns . Note that, by symmetry, . We measure numerically as a function of , by examining the deviation of the two copies which are initially only slightly perturbed. For a network with nodes, the deviation is measured within a time window of steps.
As long as one is interested in the network characteristics such as attractor statistics or robustness, simulating the dynamics of the whole network is extremely inefficient. The reason is that, given the topology, some of the nodes make no contribution to such statistics [Socolar & Kauffman, 2003]. For example, a node with zero in-degree remains at a fix state all times. Similarly, a node with zero out-degree simply follows the input and does not give any feedback. Same statements apply to those nodes which lose all incoming or outgoing edges after a round of pruning such nodes. Therefore, we focus on the dynamically relevant (sub)network (DRN) which is found by recursively pruning all the nodes with zero in-degree or zero out-degree (see Fig. 1). This subnetwork is typically much smaller than the original, allowing one to run time-efficient simulations.
We find that the in-degree distribution of the DRN for the yeast regulatory network is exponential with an exponent , similar to the full yeast network. In addition, we generated two ensembles of model networks for comparison. The first ensemble is a set of randomly connected networks of the same size and the same exponent in-degree distribution as the yeast DRN, so named in-EXP model. The second ensemble is generated by using a recently proposed null-model by Balcan et al. [Balcan et al., 2007] which successfully reproduces many topological features of the yeast’s GRN. An interesting observation is that, the second ensemble which preserves a number of topological signatures found in yeast, yielded dynamically relevant subnetworks with an average size of , i.e., significanly smaller than that of the yeast DRN.
RESULTS
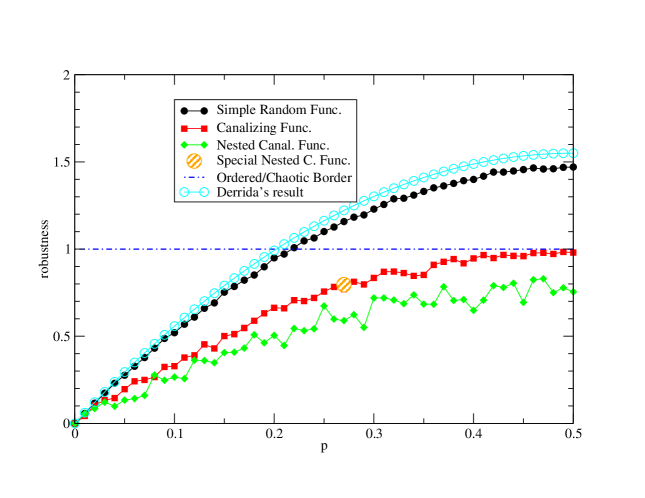
On the GRN of the yeast, we calculated the robustness of the network dynamics for each function type discussed above as a function of . We chose , except for SNCF case, where the value of is fixed by the network topology to the value . For each case, we performed statistics over independent function assignments and ran the dynamics for time steps starting from different initial conditions (and their perturbations, in parallel). In all cases, the lengths of the simulations were sufficient for the system to reach an attractor. Fig.(2) shows the average robustness found for each function type. We find that when a random RF function is associated with each gene’s transcription, the systems switches from an ordered phase to a chaotic phase around , consistent with Derrida’s analytical result in Eq.(8). CFs always result in an ordered system, except when , where the yeast’s GRN appears to be at the edge of chaos. NCF and SNCFs which have been suggested to better represent gene regulation dynamics are strictly ordered for all values.
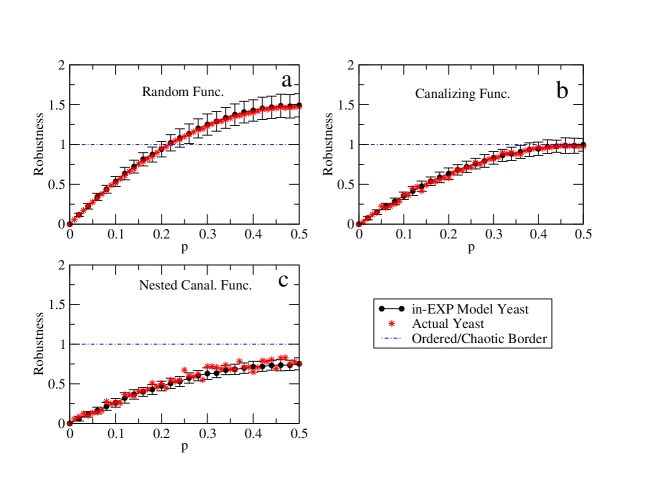
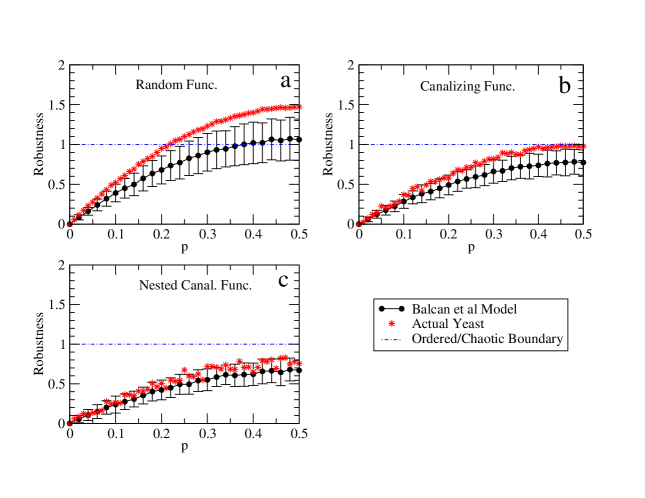
For comparison, we repeated the same analysis on in-EXP and Balcan et al. models. 100 different networks were created from each set in order to reduce fluctuations due to structural deviations from sample to sample. The average robustness obtained for in-EXP and Balcan et al. model are compared with the corresponding data obtained from the yeast’s GRN in Fig.(3) and Fig.(4), respectively. We find that the in-EXP model networks show similar robustness profiles as the yeast’s GRN in all cases, whereas Balcan et al. model, although it globally appears to capture the network structure [Balcan et al., 2007], shows a significant deviation from the yeast in its dynamics.
DISCUSSION
We calculated the robustness of the yeast’s transcriptional regulatory network within the framework of Boolean networks and as a function of the gene activation probability . Under different assumptions on the function class that governs the regulation process, we find that the network may show an order-chaos transition with changing , may reach the edge of chaos at , or may stay robust for all values. Our results point to the fact that, the activation probability by itself is not sufficient to determine the robustness of the Boolean networks; the functional category of the update rules also matter. As future experiments more precisely unveil activation/inhibition relations between genes in the yeast organism, proper choices for and the function class shall become apparent. The strong dependence of the robustness to the function type and may entail that both have been optimized throughout evolutionary time scales to their present-time values. Our findings may then help address the “edge of chaos” hypothesis of Kauffman [Kauffman, 1993].
We furthermore compared our results on the yeast network with those obtained from two models which produce statistically similar network topologies. We found to our surprise that among the two models, Balcan et al. model which better reproduces a set of global topological features shows significantly larger deviation from the yeast’s network in its robustness. This discrepancy should stem from certain structural features that are not captured by the global topological signatures considered in past studies. One such difference we observe is the much smaller average dynamical core size of Balcan et al. model networks. This and other possible structural sources for the observed difference in dynamics should be further investigated.
Acknowledgments
This work was supported by The Scientific and Technological Research Council of Turkey Grant TBAG-106T553.
References
- Albert & Barabási [2002] Albert, R. & Barabási, A.-L. [2002] “Statistical mechanics of complex networks.” Rev. Mod. Phys. 74(1), 47–97. doi:10.1103/RevModPhys.74.47.
- Albert & Othmer [2003] Albert, R. & Othmer, H. G. [2003] “The topology of the regulatory interactions predicts the expressions pattern of the segment polarity genes in drosophila melanogaster.” Journal of Theoretical Biology 223, 1–18.
- Aldana [2003] Aldana, M. [2003] “Boolean dynamics of networks with scale-free topology.” Physica D 185, 45–66.
- Balcan & Erzan [2006] Balcan, D. & Erzan, A. [2006] Dynamics of content based networks, pp. 1083–1090 (V. N. Alexandrov et al.: ICCS 2006, Part III, LNCS 3993, Springer-Verlag, Berlin).
- Balcan & Erzan [2007] Balcan, D. & Erzan, A. [2007] “Content based networks – from topology to dynamics.” Nonlin. Phen. Comp. Syst 10, 59–71.
- Balcan et al. [2007] Balcan, D., Kabakcioglu, A., Mungan, M. & Erzan, A. [2007] “The information coded in the yeast response elements accounts for most of the topological properties of its transcriptional regulation network.” PLOSone 6. Www.plosone.org (freely available online).
- Barabasi & Olvai [2004] Barabasi, A. & Olvai, Z. [2004] “Network biology: Understanding the cell’s functional organisation.” Nature Genetics 5, 101–114.
- Bergmann et al. [2003] Bergmann, S., Ihmels, J. & Barkai, N. [2003] “Similarities and differences in genome-wide expression data of six organisms.” PLOS Biology 2(1), 1–9. Www.plosone.org.
- Bollobas [1998] Bollobas, A. [1998] Modern Graph Theory (New York: Springer Verlag.).
- Colizza et al. [2006] Colizza, V., Flammini, A., Serrano, M. & Vespignani, A. [2006] “Detecting rich-club ordering in complex networks.” Nature Physics 2, 110–115.
- Derrida & Pomeau [1986] Derrida, B. & Pomeau, Y. [1986] “Random networks of automata: A simple annealed approximation.” Europhysics Letters 1(2), 45–49.
- Espinosa-Soto et al. [2004] Espinosa-Soto, C., Padillia-Longoria, P. & Alvarez-Buylla, E. [2004] “A gene regulatory network model for cell-fate determianation durin arabidopsis thaliana flower development that is robust and recovers experimantal gene expressions profiles.” Plant Cell 16, 2923–2939.
- Guelzim & et al. [2002] Guelzim, N. & et al. [2002] “Topological and causal structure of the yeast transcriptional regulatory network.” Nature Genetics 31, 60–63.
- Harris & et al. [2002] Harris & et al. [2002] “A model of transcriptional regulatory networks based on biases in the observed regulation rules.” Complexity 7(4), 23–40.
- Kauffman et al. [2003] Kauffman, S., Peterson, C., Samuelsson, B. & Troein, C. [2003] “Random boolean network models and the yeast transcriptional network.” PNAS 100(25), 14796–14799.
- Kauffman [1969] Kauffman, S. A. [1969] “Metabolic stability and epigenesis in randomly connected nets.” Journal Of Theoretical Biology (22), 437.
- Kauffman [1993] Kauffman, S. A. [1993] The Origins of Order (Oxford University Press), 1 edition.
- Lockhart & Winzeler [2000] Lockhart, D. & Winzeler, E. [2000] “Genomics, gene expression and dna arrays.” Nature 405, 827–835.
- Mendoza et al. [1999] Mendoza, L., Thieffry, D. & Alvarez-Buyyla, E. [1999] “genetic control of flower morphogenesis in arabidopsis thaliana: a logical analysis.” Bioinformatics 15(7/8), 593–606.
- Milo et al. [2002] Milo, R., Shen-Orr, S., Itzkovitz, S., Kashtan, N., Chklovskii, D. & Alon, U. [2002] “Network motifs: simple building blocks of complex networks.” Science 298(5594), 824–827. doi:10.1126/science.298.5594.824.
- Newman [2001] Newman, M. [2001] “Scientific collaboration networks ii. shortest paths, wieghted networks, and centrality.” Physical Review E 64(0161132), 1–6.
- Nicholas & et al. [2004] Nicholas, M. & et al. [2004] “Genomics analysis of regulatory network dynamics reveals large topological changes.” Nature 431, 308–312.
- Nikolajewa et al. [2006] Nikolajewa, S., Friedel, M. & Wilhelm, T. [2006] “Boolean networks with biologically relevant rules show ordered behavior.” Biosystems .
- Norrell et al. [2007] Norrell, J., Samuelsson, B. & Socolar, J. E. S. [2007] “Attractors in continuous and boolean networks.” Phys. Rev. E 76(4), 046122.
- Socolar & Kauffman [2003] Socolar, J. & Kauffman, S. [2003] “Scaling in ordered aand critical random boolean networks.” Physical Review Letters 90(6), 0687021–0687024.
- Teixeira et al. [2006] Teixeira, M. C., Monteiro, P., Jain, P., Tenreiro, S., Fernandes, A. R., Mira, N. P., Alenquer, M., Freitas, A. T., Oliveira, A. L. & Sá-Correia, I. [2006] “The yeastract database: a tool for the analysis of transcription regulatory associations in saccharomyces cerevisiae.” Nucl. Acids Res. 34, D446–D451.
- Tuğrul & Kabakçıoğlu [expected in 2009] Tuğrul, M. & Kabakçıoğlu, A. [expected in 2009] “Anomalies in the transcriptional regulatory network of saccharomyces cerevisiae.” in preparation .