A Young Super Star Cluster in the Nuclear Region of NGC 253
Abstract
We present observations of a massive star cluster near the nuclear region of the nearby starburst galaxy NGC 253. The peak of near-infrared emission, which is spatially separated by 4′′ from the kinematic center of the galaxy, is coincident with a super star cluster whose properties we examine with low-resolution (R 1,200) infrared CTIO spectroscopy and optical/near-infrared HST imaging. Extinction, measured from [Fe II] lines, is estimated at = 17.72.6. The age of the cluster is estimated at 5.7 Myr, based on Br equivalent width for an instantaneous burst using Starburst99 modeling. However, a complex star formation history is inferred from the presence of both recombination emission and photospheric CO absorption. The ionizing photon flux has a lower limit of 7.32.5 1053 s-1, corrected for extinction. Assuming a Kroupa IMF, we estimate a cluster mass of 1.4 107 . We observe a strong Wolf-Rayet signature at 2.06 m and report a weak feature at 2.19 m which may be due to a massive stellar population, consistent with the derived mass and age of this cluster.
Subject headings:
galaxies: star clusters — galaxies: individual (NGC 253)1. Introduction
Starburst galaxies are an important window to earlier eras of star formation in the Universe. Characterized by a prodigious star formation rate occasionally in excess of 100 yr-1 (Kennicutt, 1998), these galaxies are using up their available gas at a rate that is not sustainable over a Hubble Time. Star forming regions in local starburst galaxies (e.g. M82 and NGC 253) resolve into dense “super star clusters” (SSCs), which are the most massive ( 106 ) example of clustered star formation. These SSCs, with core stellar densities in excess of 104 pc-3 (Johnson, 2005), represent star formation in an extreme environment. Estimates of cluster initial mass functions (IMFs), sizes, and masses are necessary to place SSCs in the context of Young Massive Clusters (YMCs) observed in both the Milky Way and the Large Magellanic Cloud (Brandl et al., 1999, 1996; Walborn et al., 2002). SSCs afford the opportunity of studying a large sample of coeval stars, in an environment analogous to that of the high-redshift Universe.
SSCs have been observed in a variety of star-forming galaxies, including NGC 4038-9 [“The Antennae”] (Whitmore & Schweizer, 1995), NGC 1275 (Holtzman et al., 1992), NGC 1569 (O’Connell et al., 1994), and M82 (McCrady & Graham, 2007; O’Connell et al., 1995). SSCs are compact objects with radii 1 – 5 pc, well fit by both King (1962) and Elson, Fall, & Freeman (1987) density profiles (McCrady et al., 2003; Huxor et al., 2005; Larsen et al., 2001). The King profile was originally established for globular clusters, and it has been suggested that SSCs represent analogues to globular cluster precursors. Developments in this field hinge on determining the IMF of stellar clusters; a top-heavy IMF, characterized by an overabundance of massive stars, has been observed in clusters in M82 (McCrady et al., 2003) and NGC 1705 (Sternberg, 1998). An IMF biased towards high-mass stars would be prohibitive in forming a globular cluster as the majority of stars would leave the main sequence before reaching the advanced age of globular clusters ( 10 Gyr).
The proximity of local starburst galaxies enables observations on the size scale of SSCs. NGC 253 is a nearby (3.90.37 Mpc, where 1′′ 19 pc; Karachentsev et al. 2003) example of an archetypal starburst galaxy in the Sculptor group ( 00, 17′). The starburst nature of NGC 253 is thought to result from the presence of a 7 kpc bar that funnels gas into the nucleus (Engelbracht et al., 1998). Compact radio sources corresponding to H II regions and [Fe II] sources tracing supernova remnants (SNRs) have been observed in the inner starburst disk (radius 15′′ – 20′′; 280 – 380 pc) of NGC 253 (Ulvestad & Antonucci, 1997; Alonso-Herrero et al., 2003). Based on size measurements of SNRs, Lenc & Tingay (2006) infer a supernova rate of 0.14[/] yr-1 in NGC 253, where ( 10,000) is the assumed supernova expansion rate in km s-1.
NGC 253 harbors multiple discrete sources which have been observed at several wavelengths, including approximately 60 compact radio sources (Turner & Ho, 1985). The radio nucleus of NGC 253 at 2cm, TH2, is thought to be the kinematic center of the galaxy (Turner & Ho, 1985). Due to its high brightness temperature (T 105 K) and low spectral index ( –0.2, where Sν ), TH2 is likely a synchrotron source as opposed to an H II region (Nakai et al., 1995). Mohan et al. (2002) and Weaver et al. (2002) associate this source with a heavily obscured AGN.
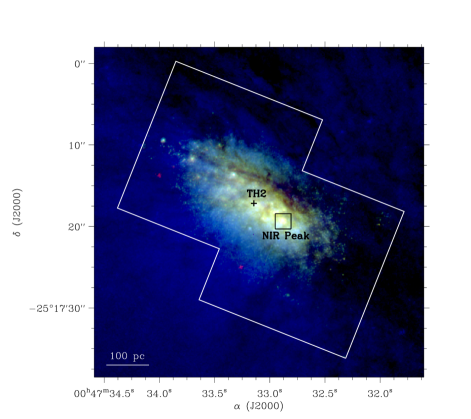
The peak of near-infrared emission in NGC 253 is spatially separated from TH2 by nearly 4′′ ( 76 pc) and emits 10% of the galaxy’s bolometric flux (Mohan et al., 2002). The near-IR peak is thought to be a super star cluster due to its strong recombination line flux (Watson et al., 1996) and the presence of [Fe II] emission, which is associated with SNRs deriving from massive stars (Alonso-Herrero et al., 2003). Engelbracht et al. (1998) observed the velocity-broadened CO(2,0) feature of this cluster and inferred a dynamical mass of 3.90.9 108 within a 75 radius. It should be noted that the aperture size used by Engelbracht et al. (1998) is substantially larger than that of a typical SSC ( 1′′); this inferred mass is consequently an overestimate of the true cluster mass. Watson et al. (1996) examined the cluster and inferred a core radius of 0.7 pc, assuming a Gaussian density profile and a distance of 2.3 Mpc.
Here, we investigate the properties of the super star cluster near the nucleus of NGC 253. Specifically, we examine this object’s extinction, ionizing photon flux, colors, age, and mass using both high-resolution imaging and spectroscopic data. In §2, we introduce the data. §3 presents a calculation of the extinction, as inferred from [Fe II] lines. Cluster properties and stellar population modeling are presented in §4. Discussion and conclusions follow in §5 and §6, respectively.
2. Observations and Data Reduction
We present two complimentary data sets: low-resolution near-infrared spectroscopy from the OSIRIS spectrograph on the 4m Cerro Tololo Inter-American Observatory (CTIO) Blanco telescope in Cerro Tololo, Chile and optical & near-infrared imaging from the Hubble Space Telescope (HST).
2.1. OSIRIS Spectroscopy
Spectroscopic data were obtained with the OSIRIS spectrograph on the 4m CTIO Blanco telescope at Cerro Tololo, Chile on 2002 July 25–26 by Michael Liu. OSIRIS operates between 0.9 – 2.4 m with a 1024 1024 HgCdTe array with 18.5 m pixels. The spectra were taken with a 12 30′′ slit, with a cross-dispersing element so that the , , and bands were covered simultaneously in adjacent orders.
Data were obtained at three separate spatial positions along the nuclear region of NGC 253, with the first observation at the near-IR peak and subsequent pointings moved to the north by approximately one slit width. In all cases, the slit was oriented East-West and on-source integration time was roughly 20 minutes. The data examined in this paper are of the near-IR peak.
The spectra were rectified using the IDL routine Redspec111http://www2.keck .hawaii.edu/inst/nirspec/redspec/index.html and dark subtraction, flat fielding, cosmic-ray rejection, and optimal extraction were performed in the standard manner. Wavelength calibration was achieved with helium, argon and neon gas-discharge lamps internal to OSIRIS and telluric corrections were completed using the A1V standard HD 12206, with spline fits to remove the hydrogen absorption lines. We measured the spectral resolution of the CTIO data as R = / = 1,200 or 250 km s-1 (derived from the width of unresolved arc lines). Flux calibration was achieved using the spectrum of HD 12206. Integrated line fluxes and equivalent widths were calculated by subtracting off a best-fit linear continuum and directly summing the line profile.
| Line | Flux (10-13 erg s-1 cm-2) |
|---|---|
| Pa | 2.6 0.2 |
| Br | 7.5 0.4 |
| [Fe II] 1.644 | 3.4 0.3 |
| [Fe II] 1.257 | 1.0 0.2 |
| He I | 2.6 0.3 |
| H2 1-0 S(1) | 1.3 0.2 |
2.2. HST Imaging & Photometry
The typical size of SSCs is 1 – 5 pc, which corresponds to 50 – 250 milliarcseconds (mas) at the distance of NGC 253. Measurement of the physical properties of SSCs therefore requires very high angular resolution. Furthermore, SSCs are often heavily shrouded by dust. Infrared measurements are therefore preferable to optical, as 0.1.
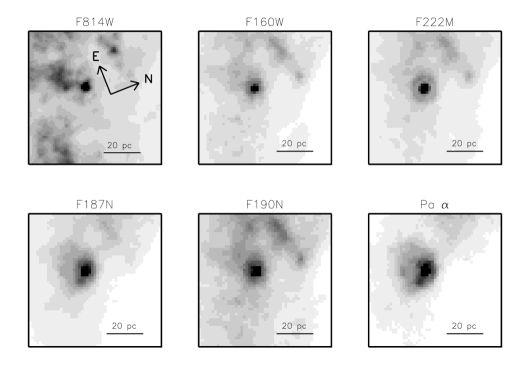
We made a mosaic of the central 770 pc of NGC 253 from dithered HST Near Infrared Camera and Multi-Object Spectrometer (NICMOS) archival images taken with the F160W and F222M filters, in addition to an archival Advanced Camera for Surveys (ACS) Wide Field Channel image taken with the F814W filter222These data are from the Multimission Archive at STScI (MAST) database. The original data, from PIs M. Rieke [NICMOS] and J. Dalcanton [ACS], were obtained in August 1998 and September 2006, respectively. The exposure times were 191, 511, and 1534 seconds, respectively.. Several SSCs and a prominent dust lane are visible in the mosaic (Figure 1). We also examined the super star cluster at the near-IR peak in five passbands333These are fully calibrated and reduced NICMOS data obtained from MAST, also from PI M. Rieke’s August 1998 program.: F160W, F222M, F187N, F190N, and Pa, and aperture photometry was performed in three NICMOS passbands, where the camera used is indicated in brackets: F110M [NIC1], F160W [NIC2], and F222M [NIC2]. Due to the variable sky background in the vicinity of the cluster, standard photometry packages were avoided. We chose to develop in-house IDL routines to perform the photometry; we outline the procedure here.
In order to remove background emission and isolate the cluster light, we placed a 2 pixel wide annulus at a distance of 10 pixels from the cluster center and fitted a plane to the points enclosed in the annulus. Using photometric conversions from the HST Data Handbook444http://www.stsci.edu/hst/HST_overview/documents/datahandbook/, we summed the light within a radius of 11.5 (6.5) pixels for the NIC1 (NIC2) observations and applied an aperture correction (AC) to account for residual cluster light not enclosed by the adopted radius, where the AC is given in parentheses following the filter name: F110M (1.13), F160W (1.19), and F222M (1.22). We converted to physical flux units using Vega as a zeropoint and obtained the following photometric results: m160–m222 = 1.40.13, m110–m160 = 2.10.25, and m222 = 11.30.07. Errors were estimated through Monte Carlo simulations; multiple artificial clusters of the same magnitude as the real cluster were randomly placed on the image and their photometry recovered. The standard deviation of the photometric distribution was adopted as the error.
3. Extinction in the Nuclear Region
Variable extinction in NGC 253 is evident by the large, clumpy dust lane cutting through the nuclear region from the northeast to the southwest. [Fe II] lines populate the near-infrared spectrum (Figure 2) and are consequently useful probes of extinction. The features at 1.257 m and 1.644 m share the same upper atomic level and have an intrinsic line ratio of 1.257/1.644 = 1.35 (Nussbaumer & Storey, 1988). The ratio / is calculated given equations 2a and 2b in Cardelli et al. (1989), assuming = 3.1:
| (1) |
In order to calculate the extinction to the nuclear region of NGC 253, we employ the general expression relating flux and magnitudes [- = –2.5log(f1/f2)] and re-arrange to solve for the flux ratio:
| (2) |
These equations are then divided by one another to yield an expression which includes the observable on the left hand side (0.280.07) and the fiducial ratio (1.35) as the first term on the right hand side:
| (3) |
The above expression is solved in terms of and , which are in turn related to by equation 1. We calculate = 17.72.6.
While an estimate of the extinction enables corrections to be applied to starburst parameters (§4.2), it is difficult to constrain globally due to variability along different lines of sight from the uneven dust distribution (Figure 3; Watson et al., 1996). Literature values for the extinction to the nuclear region of NGC 253 range from = 2 (Moorwood & Oliva, 1988)555The Moorwood & Oliva (1988) value for appears to be incorrect, as a derivation using their input parameters from their Table 3 would yield 4. to = 24 (Sams et al., 1994). The discrepancy between these values is attributed both to the highly variable extinction in the region (Alonso-Herrero et al., 2003) and the different aperture sizes used by various groups.
4. Cluster Properties
In order to investigate the properties of the super star cluster at the near-IR peak of NGC 253, we used the Starburst99 population synthesis model suite (Leitherer et al., 1999; Vázquez & Leitherer, 2005) to create a hypothetical starburst cluster and model its properties as a function of time. We assumed solar metallicity, as per studies of NGC 253 by Carral et al. (1994) and Ptak et al. (1997), and modeled both an instantaneous burst (e.g. a “single stellar population”) and continuous star formation. Both of these models may be over-simplifications of the super star cluster at the near-IR peak of NGC 253, as discussed below.
The stellar IMF is often modeled as a single power-law across all masses (e.g. the Salpeter (1955) IMF, where dN d; = 2.35), although recent work has suggested that the IMF may be better represented as a broken power law (Meyer et al., 2000). An example of such an IMF with a characteristic “knee” in its distribution is the Kroupa (2001) IMF; this broken power law has the effect of reducing the number of low-mass stars relative to a population described by a single power law. We use Starburst99 to model a stellar population according to the Kroupa IMF. We first investigate the age of the cluster using Starburst99 and the Br equivalent width measurement.
4.1. Equivalent Width & Age
Br (2.17 m) is a bright recombination line indicative of a massive, young stellar population. As high-mass stars evolve much more quickly than their low-mass counterparts, the strength of the Br feature will vary over time as the output of UV photons from massive stars drops sharply after the first 5 Myr (Leitherer et al., 1999). Therefore, the strength of the Br feature, quantified by its equivalent width (EW), is a probe of cluster age. As both line flux and continuum level increase with cluster mass, EW is relatively insensitive to mass and is consequently a powerful age diagnostic.
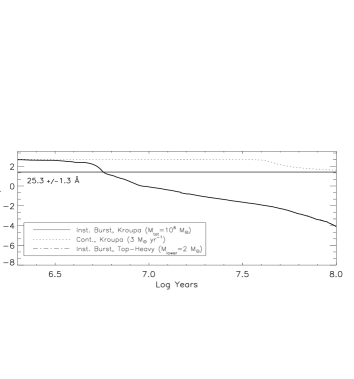
From the CTIO data (Figure 2), we measured the equivalent width of the Br feature to be 25.31.3 Å. We used Starburst99 to investigate the temporal evolution of Br equivalent width (Figure 4). The two instantaneous burst models we used — one with a Kroupa IMF and one with a top-heavy Salpeter IMF — produced indistinguishable distributions of Br equivalent width with time (as would be expected, since these models are nearly identical in their distributions of high-mass stars). The continuous star formation model sustained a higher Br equivalent width over time than the burst models did. Continuous star formation may be an unrealistic assumption, as the winds from massive stars and their ultimate explosions as supernovae would be effective in clearing out natal gas and therefore impeding subsequent star formation. Based on the assumption of a single stellar population, the age of the cluster from Br equivalent width measurements is 5.7 Myr (main sequence turn-off mass of 20 ). The Br line is well-resolved in the CTIO data and therefore the uncertainty on the cluster age is dominated by the choice of star formation history model. Assuming a metallicity other than solar minimally affects the best-fit cluster age; adopting = 2 (0.5) produces a best-fit age of 5.4 (6.3) Myr.
Next, we investigate another defining parameter of the cluster – its mass. To do so, we first calculate the cluster’s ionizing photon flux.
4.2. Ionizing Photon Flux
Measurements of SSC recombination line luminosity can be used to calculate the flux of ionizing photons and consequently the number of stars producing the UV photons (assuming Case B recombination). The flux of ionizing photons is calculated from the Br luminosity, as given in Kennicutt (1998):
| (4) |
where Q(H0) is the number of hydrogen ionizations per second and LBrγ is defined as the flux in the Br line integrated over the surface area of a sphere whose radius is the distance to the source. We calculate Q(H0) = 1.00.2 1053 s-1, uncorrected for extinction. Correcting for attenuation increases the value of Q(H0) by a factor of 10, where = 0.12 using the Cardelli (1989) extinction law ( = 3.1). Based on the extinction to NGC 253 inferred from [Fe II] lines in 4, Q(H0)corr = 7.32.5 1053 s-1. The value of Q(H0) which we derive is comparable to the result from Puxley et al. (1997) using radio recombination lines. Discrepancies between literature values likely arise primarily from the use of different distances to NGC 253; some authors, including Alonso-Herrero et al. (2003) and Engelbracht et al. (1998), adopt a value of 2.50.37 Mpc (de Vaucouleurs, 1978) whereas this work uses the most current value for the distance to NGC 253 (3.90.37 Mpc) obtained by Karachentsev et al. (2003). If we scale Q(H0)corr to a distance of 2.5 Mpc, we obtain a value of 3.01.5 1053 s-1. A secondary effect which may further explain differences in Q(H0) is the use of different extinction laws. The Galactic extinction along the line of sight666http://nedwww.ipac.caltech.edu/forms/calculator.html to NGC 253 is = 0.007 and therefore the lower limit on Q(H0), assuming a distance to NGC 253 of 3.9 Mpc, is 1.00.2 1053 s-1. Table 2 summarizes the ionizing photon flux derived here, assuming a distance of 3.9 Mpc, and compares it to that of other authors.
Ionizing photon flux, as a proxy for the number of massive stars in the cluster, can be used to infer a total cluster mass. We address this calculation in the following paragraph.
| Log Q(H0) [s-1] | Method | Reference |
|---|---|---|
| 53.86 0.40 | Br (extinction corrected) | This Work |
| 53.57 | RRLsaaRadio recombination lines (n 50). | Puxley et al. (1997) |
| 53.15 | Pa | Alonso-Herrero et al. (2003) |
| 53.11 | [Ne II] | Engelbracht et al. (1998) |
| 53.00 | Br | Engelbracht et al. (1998) |
| 52.93 | RRLsaaRadio recombination lines (n 50). | Mohan et al. (2002) |
| 52.88 | 6cm thermal flux | Turner & Ho (1983) |

4.3. Cluster Mass
SSCs have been observed with masses similar to those of globular clusters, ranging from 104.5 - 106.3 (e.g., Massey & Hunter, 1998; Gilbert & Graham, 2007). Here, we investigate the mass of the super star cluster near the nucleus of NGC 253 using a novel technique which relies on the observed total cluster ionizing flux.
We integrate an assumed IMF (Kroupa) over mass, using the observed ionizing photon flux, 7.32.5 1053 s-1 (§4.2), as a constraint. This procedure requires a priori knowledge of the ionizing flux of individual stars – we use the values from Sternberg et al. (2003). We included only stars of mass 20–90 in our analysis, as stars below 20 contribute a comparatively insignificant ionizing flux.
With known stellar ionizing fluxes from Sternberg et al. (2003) in hand, we made an arbitrary, first-guess estimate of the cluster mass (107 ). Next, we calculated the distribution of stellar masses necessary to produce this total mass, assuming a Kroupa IMF. The number of stars in each mass bin were then multiplied by their respective ionizing fluxes and a total ionizing flux was extracted. This value was compared to the observed ionizing flux and the total mass of the cluster was iteratively adjusted until the model and observed total ionizing flux were in agreement. We obtain a best-fit cluster mass of 1.4 107 .
4.4. Cluster Photometry
Cluster photometry is revisited in light of Starburst99 modeling. Extinction to the region was previously determined (§3) using observations of [FeII] lines; we now independently examine the extinction level using Starburst99 modeling and HST photometry (§2). We made a near-infrared color-color diagram for two model stellar populations; both assume a Kroupa IMF and one is characterized by an instantaneous burst while the other has a continuous star formation history. The output photometry from Starburst99 was converted from the Bruzual (1981) system to NICMOS magnitudes using the method of Marleau et al. (2000), and the observed HST photometry plotted with error bars (Figure 5). The intersection of the reddening vector (calculated using the Cardelli (1989) extinction law) with the color-color track implies an extinction of 12 and a corresponding age of 1 – 4 Myr. Given the cluster’s high mass and young age, the spectral signatures of a population of Wolf-Rayet stars are expected (§5).
5. Discussion
The nuclear region of NGC 253 is heavily extinguished, as seen by the dust lane running from the northeast to the southwest in Figure 1. Infrared observations are therefore preferable to optical observations, not only for the advantage in attenuation ( 0.11; Cardelli et al. 1989), but also because of the wide range of nebular and photospheric lines which are most pronounced in the infrared.
The super star cluster at the near-infrared peak of NGC 253 appears to be a complex system consisting of several epochs of star formation. CO absorption features characteristic of photospheres of red supergiants (RSGs) are seen in the and band spectra (Figure 2). Stellar winds from these massive stars remove remaining nascent material from the cluster and near-infrared light becomes dominated by the spectral signature of RSGs, rich in OH, CO, and H2O features. RSGs are evolved OB stars, so their presence in the cluster implies a minimum age of 7 Myr (Leitherer et al., 1999). The data, however, also exhibit strong recombination lines due to OB stars, indicating the presence of a young population still producing UV photons. A single burst of star formation is unable to explain the presence of both RSG and OB star spectral signatures and therefore either a continuous star formation history or one punctuated by multiple bursts is necessary to account for the features seen in these spectra. Other possibilities which could explain the seemingly incongruous result of simultaneously finding both OB and RSG stars in a cluster include the presence of binary systems (and the associated processes of mass transfer and interactions) and line-of-sight superposition of multiple clusters. Furthermore, the observed cluster could in actuality be a blend of two or more bursts of star formation; Seth et al. (2008) present observations of a nuclear cluster in NGC 4244 with two distinct stellar populations. Explanations for this “blended” cluster include periodic bursts of star formation triggered by gas accretion onto the cluster and merging of multiple SSCs due to dynamical friction.
We used archival HST imaging of NGC 253 (Figure 3) to examine the dusty nuclear environment. The large dust lane clearly visible in Figure 1 is also evident in the postage-stamp images of Figure 3 in the form of increased extinction towards the left (south). Furthermore, the asymmetry observed in the Pa image may be indicative of an outflow from the cluster. Alonso-Herrero et al. (2003) find diffuse Pa emission both in and around the disk of NGC 253. An outflow might imply that the cluster is not bound, which would reduce the possibility of its development into a globular cluster. Older clusters are observed to be more compact than younger clusters (Mengel et al., 2005), although the apparent evolutionary advantage of being compact has yet to be fully explored in light of the selection bias against diffuse clusters (regardless of age). The “infant mortality rate” of SSCs has been estimated to be as high as 99% (Fall & Zhang, 2001). The proposed evolutionary progression of SSCs into globular clusters hinges both on SSCs remaining bound for a period of several Gyr and SSCs having an IMF comparable to that of globular clusters.
Given a young cluster with a sufficiently well-sampled IMF, the spectral signatures of a population of Wolf-Rayet (WR) stars are expected. The nuclear cluster in NGC 253 appears to be both massive and young enough to harbor such a population. The strong emission line signatures of WR stars in the near-infrared include He \@slowromancapi@ at 1.08 m and He \@slowromancapii@ at 1.01 m, in addition to weaker features at 2.06 m (He \@slowromancapi@) and 2.19 m (He \@slowromancapii@). The 2.06 m feature (EW 8.81 Å) is detected at the 9 level in the CTIO spectra, and we also report a possible detection of the He \@slowromancapii@ feature at 2.19 m (Figure 2). Follow-up observations with higher spectral resolution are necessary to conclusively indicate the presence of WR stars.
The short lifespan of a WR stars limits the age of a single-burst population to a range of 3 – 8 Myr. The equivalent width of WR signatures, used in combination with the equivalent width of hydrogen recombination features, is a powerful age diagnostic (Schaerer et al., 1999). Crowther et al. (2006) used emission line ratios in the and bands to classify WR subtypes in the young Galactic cluster Westerlund 1, demonstrating the utility of the near-infrared in studying WR stars. Lumsden et al. (1994) conducted a search for WR stars in three starburst galaxies and failed to find any signatures in the band; the 2.06 and 2.19 m features are more susceptible to dilution from the continuum of older background populations than are the WR lines in the band. Observations of WR stars in starburst galaxies have been rare (Contini, 1996; Mas-Hesse et al., 2000; Massey & Hunter, 1998), although the nuclear cluster in NGC 253 is a plausible candidate for hosting WR stars due to its large mass and low age.
6. Summary and Conclusions
We have used spectroscopy and imaging to examine the super star cluster coincident with the near-infrared emission peak in the nearby starburst galaxy NGC 253. Line ratios, equivalent widths, and integrated line fluxes were measured using low resolution (R 1,200) infrared CTIO spectroscopy. Extinction, estimated using [Fe II] lines, is = 17.72.6. This value was used to correct the flux of ionizing photons; Q(H0)corr = 7.32.5 1053 s-1. Assuming a Kroupa IMF, this flux of ionizing photons implies a total cluster mass of 1.4 107 . We examined the color of the NGC 253 nuclear star cluster using aperture photometry on archival HST images: m160–m222 = 1.40.13, m110–m160 = 2.10.25, and m222 = 11.30.07. We also used Starburst99 modeling, assuming a solar metallicity, an instantaneous burst of star formation, and a Kroupa IMF, to infer age from the measured equivalent width of Br. The strength of the Br line is proportional to the flux of ionizing photons, a quantity which depends on the number of main-sequence OB stars in the cluster. The measured Br equivalent width, 25.31.3 Å, corresponds to a cluster age of 5.7 Myr, assuming the Starburst99 parameters stated above. While this technique gives a rough estimate of the cluster’s age, it is important to remember that the near-infrared CTIO spectra exhibit both recombination emission and CO photospheric absorption. These spectral signatures of both young and older stars imply either a continuous star formation history or one punctuated by multiple bursts; a single burst is not sufficient to explain the cluster’s star formation history.
Future studies of this cluster to probe its stellar velocity dispersion would be useful in constraining its mass. High-resolution spectroscopy would also be instrumental in quantifying the contribution of Wolf-Rayet stars, if any, to the overall cluster light.
Acknowledgements
We graciously thank Michael Liu for taking the time to obtain our spectra during his CTIO observing run. K.K. thanks Jean Turner for helpful discussions. We also thank the anonymous referee for useful and insightful comments.
This material is based upon work supported by the National Science Foundation under Grant No. 0502649. Any opinions, findings, and conclusions or recommendations expressed in this material are those of the authors and do not necessarily reflect the views of the National Science Foundation.
OSIRIS is a collaborative project between the Ohio State University and Cerro Tololo Inter-American Observatory (CTIO) and was developed through NSF grants AST 90-16112 and AST 92-18449. CTIO is part of the National Optical Astronomy Observatory (NOAO), based in La Serena, Chile. NOAO is operated by the Association of Universities for Research in Astronomy (AURA), Inc. under cooperative agreement with the National Science Foundation.
Based on observations made with the NASA/ESA Hubble Space Telescope, obtained from the data archive at the Space Telescope Science Institute. STScI is operated by the Association of Universities for Research in Astronomy, Inc. under NASA contract NAS 5-26555.
References
- Alonso-Herrero et al. (2003) Alonso-Herrero, A., Rieke, G. H., Rieke, M. J., & Kelly, D. M. 2003, AJ, 125, 1210
- Brandl et al. (1999) Brandl, B., Brandner, W., Eisenhauer, F., Moffat, A. F. J., Palla, F., & Zinnecker, H. 1999, A&A, 352, L69
- Brandl et al. (1996) Brandl, B., Sams, B. J., Bertoldi, F., Eckart, A., Genzel, R., Drapatz, S., Hofmann, R., Loewe, M., & Quirrenbach, A. 1996, ApJ, 466, 254
- Bruzual (1981) Bruzual, G. A. 1981, PhD thesis, University of California, Berkeley
- Cardelli et al. (1989) Cardelli, J. A., Clayton, G. C., & Mathis, J. S. 1989, ApJ, 345, 245
- Carral et al. (1994) Carral, P., Hollenbach, D. J., Lord, S. D., Colgan, S. W. J., Haas, M. R., Rubin, R. H., & Erickson, E. F. 1994, ApJ, 423, 223
- Contini (1996) Contini, T. 1996, in Liege International Astrophysical Colloquia, Vol. 33, Liege International Astrophysical Colloquia, ed. J. M. Vreux, A. Detal, D. Fraipont-Caro, E. Gosset, & G. Rauw, 619
- Crowther et al. (2006) Crowther, P. A., Hadfield, L. J., Clark, J. S., Negueruela, I., & Vacca, W. D. 2006, MNRAS, 372, 1407
- de Vaucouleurs (1978) de Vaucouleurs, G. 1978, ApJ, 224, 710
- Elson et al. (1987) Elson, R. A. W., Fall, S. M., & Freeman, K. C. 1987, ApJ, 323, 54
- Engelbracht et al. (1998) Engelbracht, C. W., Rieke, M. J., Rieke, G. H., Kelly, D. M., & Achtermann, J. M. 1998, ApJ, 505, 639
- Fall & Zhang (2001) Fall, S. M., & Zhang, Q. 2001, ApJ, 561, 751
- Gilbert & Graham (2007) Gilbert, A. M., & Graham, J. R. 2007, ApJ, 668, 168
- Holtzman et al. (1992) Holtzman, J. A., Faber, S. M., Shaya, E. J., Lauer, T. R., Groth, J., Hunter, D. A., Baum, W. A., Ewald, S. P., Hester, J. J., Light, R. M., Lynds, C. R., O’Neil, Jr., E. J., & Westphal, J. A. 1992, AJ, 103, 691
- Huxor et al. (2005) Huxor, A. P., Tanvir, N. R., Irwin, M. J., Ibata, R., Collett, J. L., Ferguson, A. M. N., Bridges, T., & Lewis, G. F. 2005, MNRAS, 360, 1007
- Johnson (2005) Johnson, K. E. 2005, in IAU Symposium, Vol. 227, Massive Star Birth: A Crossroads of Astrophysics, ed. R. Cesaroni, M. Felli, E. Churchwell, & M. Walmsley, 413–422
- Karachentsev et al. (2003) Karachentsev, I. D., Grebel, E. K., Sharina, M. E., Dolphin, A. E., Geisler, D., Guhathakurta, P., Hodge, P. W., Karachentseva, V. E., Sarajedini, A., & Seitzer, P. 2003, A&A, 404, 93
- Kennicutt (1998) Kennicutt, Jr., R. C. 1998, ARA&A, 36, 189
- King (1962) King, I. 1962, AJ, 67, 471
- Kroupa (2001) Kroupa, P. 2001, MNRAS, 322, 231
- Larsen et al. (2001) Larsen, S. S., Brodie, J. P., Elmegreen, B. G., Efremov, Y. N., Hodge, P. W., & Richtler, T. 2001, ApJ, 556, 801
- Leitherer et al. (1999) Leitherer, C., Schaerer, D., Goldader, J. D., Delgado, R. M. G., Robert, C., Kune, D. F., de Mello, D. F., Devost, D., & Heckman, T. M. 1999, ApJS, 123, 3
- Lenc & Tingay (2006) Lenc, E., & Tingay, S. J. 2006, AJ, 132, 1333
- Lumsden et al. (1994) Lumsden, S. L., Puxley, P. J., & Doherty, R. M. 1994, MNRAS, 268, 821
- Marleau et al. (2000) Marleau, F. R., Graham, J. R., Liu, M. C., & Charlot, S. 2000, AJ, 120, 1779
- Mas-Hesse et al. (2000) Mas-Hesse, J. M., Kunth, D., & Cerviño, M. 2000, New Astronomy Review, 44, 229
- Massey & Hunter (1998) Massey, P., & Hunter, D. A. 1998, ApJ, 493, 180
- McCrady et al. (2003) McCrady, N., Gilbert, A. M., & Graham, J. R. 2003, ApJ, 596, 240
- McCrady & Graham (2007) McCrady, N., & Graham, J. R. 2007, ApJ, 663, 844
- Mengel et al. (2005) Mengel, S., Lehnert, M. D., Thatte, N., & Genzel, R. 2005, A&A, 443, 41
- Meyer et al. (2000) Meyer, M. R., Adams, F. C., Hillenbrand, L. A., Carpenter, J. M., & Larson, R. B. 2000, Protostars and Planets IV, 121
- Mohan et al. (2002) Mohan, N. R., Anantharamaiah, K. R., & Goss, W. M. 2002, ApJ, 574, 701
- Moorwood & Oliva (1988) Moorwood, A. F. M., & Oliva, E. 1988, A&A, 203, 278
- Nakai et al. (1995) Nakai, N., Inoue, M., Miyazawa, K., Miyoshi, M., & Hall, P. 1995, PASJ, 47, 771
- Nussbaumer & Storey (1988) Nussbaumer, H., & Storey, P. J. 1988, A&A, 193, 327
- O’Connell et al. (1994) O’Connell, R. W., Gallagher, III, J. S., & Hunter, D. A. 1994, ApJ, 433, 65
- O’Connell et al. (1995) O’Connell, R. W., Gallagher, III, J. S., Hunter, D. A., & Colley, W. N. 1995, ApJ, 446, L1
- Ptak et al. (1997) Ptak, A., Serlemitsos, P., Yaqoob, T., Mushotzky, R., & Tsuru, T. 1997, AJ, 113, 1286
- Puxley et al. (1997) Puxley, P. J., Mountain, C. M., Brand, P. W. J. L., Moore, T. J. T., & Nakai, N. 1997, ApJ, 485, 143
- Salpeter (1955) Salpeter, E. E. 1955, ApJ, 121, 161
- Sams et al. (1994) Sams, III, B. J., Genzel, R., Eckart, A., Tacconi-Garman, L., & Hofmann, R. 1994, ApJ, 430, L33
- Schaerer et al. (1999) Schaerer, D., Contini, T., & Kunth, D. 1999, A&A, 341, 399
- Seth et al. (2008) Seth, A. C., Blum, R. D., Bastian, N., Caldwell, N., & Debattista, V. P. 2008, ApJ, 687, 997
- Sternberg (1998) Sternberg, A. 1998, ApJ, 506, 721
- Sternberg et al. (2003) Sternberg, A., Hoffmann, T. L., & Pauldrach, A. W. A. 2003, ApJ, 599, 1333
- Turner & Ho (1983) Turner, J. L., & Ho, P. T. P. 1983, ApJ, 268, L79
- Turner & Ho (1985) —. 1985, ApJ, 299, L77
- Ulvestad & Antonucci (1997) Ulvestad, J. S., & Antonucci, R. R. J. 1997, ApJ, 488, 621
- Vázquez & Leitherer (2005) Vázquez, G. A., & Leitherer, C. 2005, ApJ, 621, 695
- Walborn et al. (2002) Walborn, N. R., Maíz-Apellániz, J., & Barbá, R. H. 2002, AJ, 124, 1601
- Watson et al. (1996) Watson, A. M., Gallagher, III, J. S., Holtzman, J. A., Hester, J. J., Mould, J. R., Ballester, G. E., Burrows, C. J., Casertano, S., Clarke, J. T., Crisp, D., Evans, R., Griffiths, R. E., Hoessel, J. G., Scowen, P. A., Stapelfeldt, K. R., Trauger, J. T., & Westphal, J. A. 1996, AJ, 112, 534
- Weaver et al. (2002) Weaver, K. A., Heckman, T. M., Strickland, D. K., & Dahlem, M. 2002, ApJ, 576, L19
- Whitmore & Schweizer (1995) Whitmore, B. C., & Schweizer, F. 1995, AJ, 109, 960