UKIRT follow-up observations of the old open cluster FSR 0358 (Kirkpatrick 1)
Abstract
We aim to characterise the properties of the stellar clusters in the Milky Way. Utilising an expectation-maximisation method we determined that the cluster FSR 0358, originally discovered by J.D. Kirkpatrick, is the most likely real cluster amongst the cluster candidates from Froebrich et al.. Here we present new deep high resolution near infrared imaging of this object obtained with UKIRT. The analysis of the data reveals that FSR 0358 (Kirkpatrick 1) is a Gyr old open cluster in the outer Milky Way. Its age, metallicity of Z = 0.008 and distance from the Galactic Centre of 11.2 kpc are typical for the known old open galactic clusters. So far six of the FSR cluster candidates have been identified as having an age above 5 Gyr. This shows the significance of this catalogue in enhancing our knowledge of the oldest open clusters in the Galaxy.
keywords:
Galaxy: globular clusters: individual; Galaxy: open clusters, individual, Kirkpatrick 11 Introduction
Star clusters are fundamental building blocks of galaxies. Observations from our local vicinity in the Galactic disk suggest that the majority of stars form in embedded star clusters of which a fraction survives to become open or globular clusters. The understanding of clustered star formation is closely related to various issues of the evolution of the Galaxy itself (e.g. West et al. 2004Natur.427…31W (2004), Kroupa 2008arXiv0810.4143K (2008)). One of the pre-requisites for corresponding studies is the availability of large and homogeneous cluster samples which do not strongly suffer from major selection effects.
The development of observing facilities in the infrared has provided not only the ability to study in detail young star clusters embedded within molecular clouds but also to search for clusters which are unseen in the optical due to obscuration from dust. The all-sky surveys carried out during the last decade in the near infrared (NIR) provided the possibility to improve the completeness of the catalogues of known star clusters in the Galaxy significantly. Recent studies have shown that embedded infrared open clusters might outnumber the cluster population detected in the optical by an order of magnitude (see Lada & Lada 2003ARA&A..41…57L (2003) for a review). But also old open clusters and globular clusters located in sky regions of strong foreground extinction ( mag or above) have a significantly higher probability to be discovered in the NIR than in the optical. As for the all-sky distribution of the galaxies from optical surveys, the database of optically detected old star clusters in our Galaxy is expected to be substantially incomplete in the area close to the Galactic Plane. The 2 Micron All Sky Survey (2MASS - Skrutskie et al. 2006AJ….131.1163S (2006)) provides an excellent database to identify a large sample of infrared star clusters in this so-called Zone of Avoidance, among them many which were previously unidentified.
We have carried out a systematic large-scale cluster search at low Galactic latitudes ( 20°) based on star counts in 2MASS (Froebrich, Scholz & Raftery 2007b ; hereafter FSR). The FSR survey identified more than 1000 previously unknown potential clusters, among them several promising candidates for globular clusters. First results from the detailed analysis of deeper NIR follow-up observations with higher spatial resolution for the high-priority globular cluster candidates FSR 1735 and FSR 0190 confirmed their classification as very old systems (Froebrich, Meusinger & Scholz 2007a ; Froebrich, Meusinger & Davis 2008a ). Other globular cluster candidates from the FSR list were discussed by Bica et al. 2007A&A…472..483B (2007) and Bonatto et al. 2007MNRAS.381L..45B (2007). The analysis of deep follow-up observations with the ESO/NTT for a sample of 14 FSR cluster candidates by Froebrich, Meusinger & Scholz 2008b revealed 7 real stellar clusters, in agreement with the pre-estimated success rate of 50 % for the FSR cluster search, among them several clusters with estimated isochrone ages of several Gyr. This paper also gives an overview of all so far investigated FSR cluster candidates.
The present paper is concerned with another high-priority old cluster candidate, FSR 0358, which has a striking resemblance to FSR 0190. Neither in the SIMBAD nor in the WEBDA database an entry was found for a star cluster near the position of FSR 0358 and no citation was found in refereed publications. However, there is a quotation of this cluster on the 2MASS Atlas Image Gallery webpage for open clusters111http://www.ipac.caltech.edu/2mass/gallery/images_open.html containing a comment on its analysis by J.D. Kirkpatrick. Given that the cluster designation should be that of the discoverer, the official name of the cluster is of course Kirkpatrick 1. Nevertheless we will use the designation FSR 0358 throughout this paper since it is part of a series of publications based upon deeper follow-up observations of cluster candidates from the FSR catalogue.
The analysis of the 2MASS data by Kirkpatrick using solar metallicity isochrones from Girardi et al. 2002A&A…391..195G (2002) suggests that the cluster is at a distance of 7.2 kpc and that there are about 5 mag optical extinction along the line of sight. Here we will investigate this interesting object in more detail. Compared with 2MASS our new observations allow a significantly deeper photometry with substantially reduced image crowding problems due to improved spatial resolution and are thus suited to check the cluster parameters derived by Kirkpatrick. In particular, our new data has the potential to detect, for the first time, the main sequence turn-off and to analyse the sub-giant branch to make the age estimation more robust.
2 Data
2.1 Target Selection
The FSR list of potential cluster candidates is judged to be contaminated with about 50 % of random star density enhancements (Froebrich et al. 2007b ; 2008b ). To identify the most probable real star clusters in the sample, we have modelled the cluster candidates by two-dimensional angular Gaussian distributions applying an expectation-maximization algorithm (Dempster, Laird & Rubin dempster77 (1977)) and evaluating the best fit using the Bayesian information criterion (BIC, Schwarz schwarz78 (1978)). This technique has for example been used to identify star clusters in the Glimpse data by Mercer et al. 2005ApJ…635..560M (2005). We find that FSR 0358 has the lowest BIC value of all the FSR candidates (Schmeja & Froebrich in prep.), indicating the highest probability of being a real cluster. Hence it is one of the most interesting clusters to investigate by follow-up observations.
2.2 Observations and Data Reduction
FSR 0358 was observed in the Summer of 2008 at the United Kingdom Infrared Telescope (UKIRT) with the facility imager-spectrometer, UIST (Ramsay Howat et al. 2004SPIE.5492.1160R (2004)). UIST contains a 1024x1024 InSb array; the plate scale measures 0.12″ per pixel. Mosaics of FSR 0358 and an adjacent control field were obtained through Mauna Kea Consortium J ( m, m), H ( m, m) and K-band ( m, m) filters.
To map an area covering 7.1′ 7.1′ centred on FSR 0358 (map centre: 22:10:12.8 +58:48:12 (J2000)), in each filter four 8-point mosaics were obtained. Directly after observing FSR 0358 at each wavelength, an 18-point mosaic of the control field was secured (map centre: 22:10:12.8 58:38:12 (J2000); area covered 5.3′ 5.3′). All J and K-band data were obtained on the 16th of August; all H-band data were observed on the 22nd of August (note that UKIRT is fully flexibly scheduled). The control field was observed at essentially the same airmass and under the same observing conditions as FSR 0358. All data were acquired under photometric skies. The spatial resolution due to seeing, telescope and instrumental effects, measured from Gaussian fitting of stars in the reduced mosaics, was 0.65″ in J and 0.70″ in H and K.
All images were dark-subtracted and bad-pixel-masked before flat-fielding using the median average of the frames themselves. For the control field all 18 frames in each filter were reduced together. For FSR 0358, the 8 images in the four quadrants of each broad-band mosaic were trimmed and mosaicked together, before these four corner mosaics were registered and combined to produce the final 7.1′ 7.1′ mosaics. The four corner mosaics were corrected for extinction before this last mosaicking step. Stars in the overlapping regions were used for astrometric and photometric registration.
2.3 Photometry
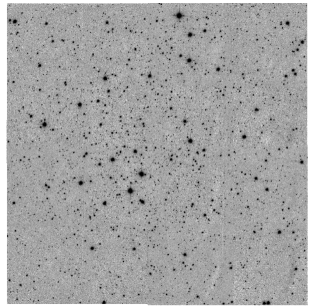
Our new observations are about 3 mag deeper than 2MASS and of higher spatial resolution. Despite this, and the fact that the cluster is just 2.2° above the Galactic Plane, the crowding of the field is only of the order of 1.3 % (see also Fig. 1). We have hence performed the identification of stars and their photometry using the Source Extractor software (Bertin & Arnouts 1996A&AS..117..393B (1996)). Since we are interested only in high quality photometry in all three filters, the search for objects was performed in the J-band mosaic. Objects were selected as real, only if they consisted of more than 25 connected pixels (the seeing) with fluxes more than 2 above the background noise. The subsequent photometry in the H- and K-band image was then only performed on objects detected in the J-band. There were 5211 objects detected in the cluster field and 1924 in the control field.
The field of the cluster, as well as the control field, contains a large number of stars, identifiable in 2MASS. These were used to calibrate our photometry into the 2MASS system. The rms uncertainties in the calibration are 0.1, 0.4, and 0.25 mag for J, H, and K in the control field, and 0.2, 0.15, and 0.17 mag in the cluster field. This rather large scatter is caused by the much better spatial resolution of our new images compared to 2MASS. Note that stars brighter than about K = 13 mag are saturated in our new images.
Given the fact that our cluster field was observed in four different parts, taken at slightly different air masses, we investigated if calibrating the different parts of the mosaic individually will influence our results. We find that the difference in the calibration is much smaller than the rms scatter, and hence there is no significant influence onto our results.
3 Results
3.1 Cluster Position and Appearance
The cluster image (for a gray scale representation see Fig. 1) shows an extended cluster of stars. The actual centre is not well defined. We find that the highest star density in our new UKIRT data occurs at RA = 22:10:14.1 and DEC = 58:48:02 (J2000). This corresponds to the Galactic Coordinates of = 103.34094° and = +2.20214°, about half an arcminute away from the position originally listed in Froebrich et al. 2007b , as well as from the position given by Kirkpatrick.
3.2 Star Density Profile
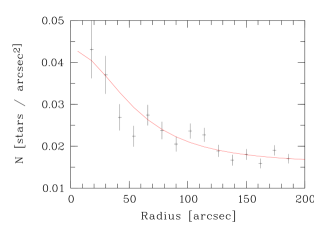
To determine the radius of the cluster we created a radial star density profile centred on the newly measured cluster coordinates. We only included stars in the profile that possess a photometric uncertainty of less than 0.2 mag in all three filters and a quality flag in the Source Extractor photometry of better than three (see Bertin & Arnouts 1996A&AS..117..393B (1996) for details). Note that due to the generally low crowding in the field there is no trend of photometric uncertainty with distance from the cluster centre, which could influence the star density profile (shown in Fig. 2).
We fit the star density of the cluster using a King-type profile (King 1962AJ…..67..471K (1962)) and determine a core radius () between 40″and 60″. The value for varies between these two limits, depending on the coordinates we choose for the centre (since the cluster centre was so difficult to define we performed several radial density profile fits). In general, a radius of 60″ gives a better fit and we hence choose this value for . The tidal radius determined by the fit is of the order of 400″, with a rather large uncertainty. This is mostly caused by the fact that our observations only cover regions up to about 200″ from the cluster centre. Furthermore, the star density around the cluster is variable by about a factor of 1.5, judging by the 2MASS star density map presented in Fig. 3. The measured core radius is about a factor of three smaller than the value listed in Froebrich et al. 2007b . We also determined the core radius based on a radial star density profile fit using solely 2MASS sources in the cluster. This results in a value of = 40″, in agreement with the range of values obtained from our new data.
The fitted, background corrected, central star density, when using our new data, is about 100 stars per square arcminute, while the background star density is about 60 stars per square arcminute. This shows that the total star density in the cluster centre is still significantly influenced by the background, but dominated by cluster stars.
3.3 2MASS star density and relative extinction maps
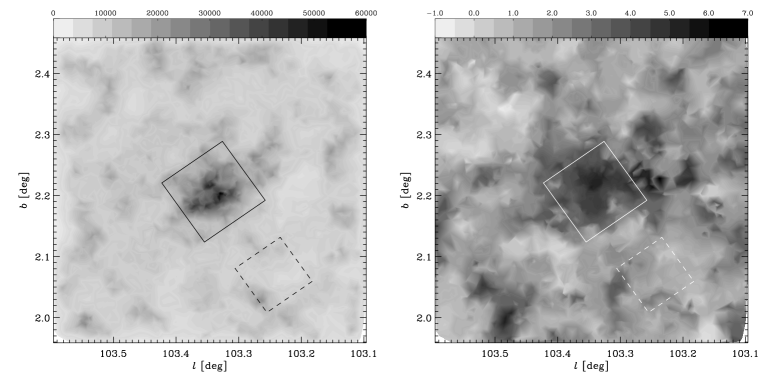
To aid our analysis of the small new UKIRT field, we utilise the 2MASS photometry of a wider area around the cluster. For this purpose we have determined a star density and a relative extinction map of a 0.5° x 0.5° region around FSR 0358 in Galactic coordinates. Only stars with a quality flag of Qflag = ‘AAA’ are used for these figures. Both maps are shown in Fig. 3.
The star density map is obtained by measuring the distance to the 20th nearest neighbour of each star. This distance was then converted into the star density at each position. The resulting map shows a clear enhancement of stellar density at the position of the cluster. There seems to be a extension of higher star density towards Galactic North-West. The field around the cluster does not show any other significant changes in the star density. however, there are small scale variations on the order of a factor of two.
The relative extinction maps are also calculated by using only the 20 nearest stars to each position. We determine the median (J-H) and (H-K) colour excesses of these stars and convert them into extinction values. The effect of using the median has been extensively discussed e.g. in Froebrich & del Burgo 2006MNRAS.369.1901F (2006). In essence, this type of map shows the extinction along the line of sight, out to a distance that corresponds to the median distance of the stars included in the colour excess determination.
In an area with only field stars, this has the effect that the correct extinction value is determined, or the cloud is not detected at all. The distance out to which the extinction can be determined depends on the galactic position, wavelengths of the observations, the extinction itself and the completeness limits of the data. Given the simulations in Froebrich & del Burgo 2006MNRAS.369.1901F (2006) and using the position of FSR 0358 we estimate that the limiting distance for the detection of extinction in the field around the cluster is between 1 kpc and 2 kpc. The exact value is not of interest for our analysis. Important is only the fact that the limiting distance is much smaller than the determined distance to the cluster of about 7 kpc (see below).
In the cluster area the situation is different. Here the cluster stars dominate the numbers, and hence the median distance of the stars corresponds to the distance of the cluster. Hence in this region the map shows the extinction along the entire line of sight (about 7 kpc) to the cluster, and not just the extinction within 1 kpc to 2 kpc.
The resulting map shows that there is a general fluctuation of extinction values within the field, even on small scales. Within an area of our follow-up observations there are basically fluctuations of up to 2 mag . Since our method limits the detectability of variations to 2 kpc, we expect that the fluctuations of extinction towards the cluster are at least of the same order of magnitude. Note that such a scatter in would introduce a scatter in J-K colours of about 0.25 mag, more or less exactly what is observed in colour magnitude diagrams of the area (see below).
At the position of the cluster we find an apparently increased extinction. This is simply explainable by the much larger distance along the line of sight traced toward the cluster compared to the surrounding field. This apparent difference in extinction does not mean that the population of foreground stars changes systematically between the cluster area and the surrounding field. The measured value of in the cluster centre is in good agreement with the extinction towards the cluster determined from isochrone fitting (see below).
3.4 Field Star Decontamination
We fit the radial star density using a King profile (King 1962AJ…..67..471K (1962)). The fit shows that even in the cluster centre, the population of stars is heavily influenced by fore and background field stars. To investigate the colour-magnitude (CMD) and colour colour diagrams (CMD) of the cluster stars we need to statistically decontaminate our sample of stars.
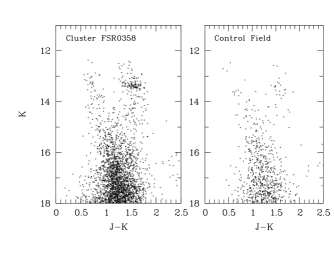
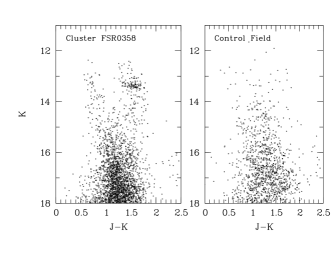
For this purpose we select all stars within three times the core radius (i.e. within 3′ from the cluster centre) as part of the cluster area. Then we select two different control fields. (i) all stars in our cluster mosaic that are more than 3.5′ away from the cluster; (ii) all stars in our observed control field. In Figure 4 we show how the distribution of stars in the CMD of the cluster field and the two control fields compare.
There are some obvious differences in the distribution of stars in the CMD for the two control fields. The distribution of stars in control field (i) looks similar to the cluster field (except for the large number of cluster red giants). But the control field still contains a few cluster stars, which are apparent at K = 13.5 mag and J-K = 1.5 mag. This is caused by the fact that we selected stars which are as close as 3.5′ to the cluster, while the tidal radius is more likely 6.5′. Given the small core radius of the cluster, however, the number of cluster stars included in control field (i) is very small (the contribution of cluster stars to the star density at these radii is less than 1.5 %). The control field (ii) shows the same basic distribution of stars as field (i). However, on close inspection there are some differences. In particular, the scatter in the J-K colours of the stars is wider in field (ii). This could be caused by a dust cloud along the line of sight. The fact that we do not detect a cloud in our extinction map could just mean it is slightly further away than our limiting distance (see Sect. 3.3). Some of the stars in control field (ii) seem to be shifted by up to J-K = 0.4 mag, corresponding to an extinction of about = 2.3 mag (Mathis 1990ARA&A..28…37M (1990)), similar to the scatter in in the extinction map of our observed control field (see right panel of Fig. 3). Furthermore, the number of stars per unit area in control field (ii) is a factor of two lower than in field (i). Given that field (i) is only 0.1° closer to the Galactic Plane, extinction has to play an important role in explaining the differences between the two control fields.
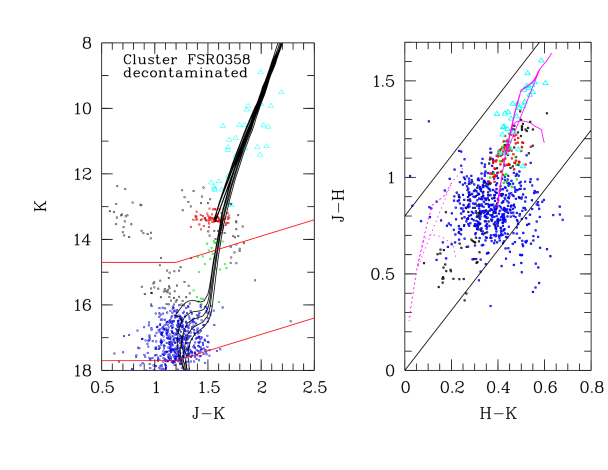
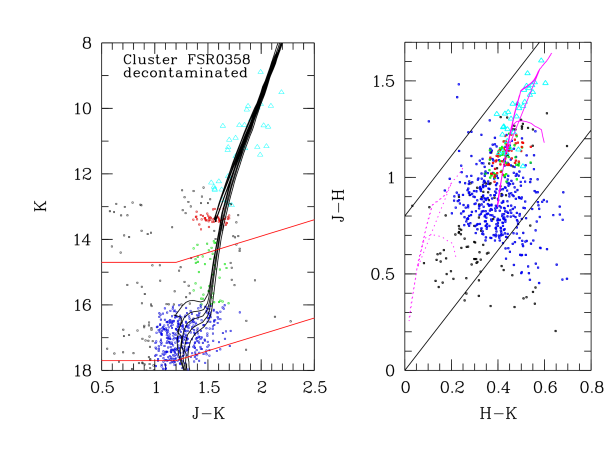
Using the two control fields we decontaminate the cluster area statistically following the method of Bonatto & Bica 2007a . As cell-size for the decontamination we choose = 0.6 mag, = 0.4 mag, and = 0.4 mag. One realisation of the decontaminated CMDs and CCDs is shown for both cases in Fig. 5. We also overplot the 2MASS photometry for bright stars in the cluster area that were saturated in our images. Because of the differences in the two control fields, the two decontaminated CMDs appear slightly different. In particular there are more stars remaining in the decontaminated CMD when using control field (ii), due to the increased extinction in this field. Note that we ’artificially’ increased the field star density for field (ii) before performing the decontamination. However, the main features (core helium burning objects, main sequence turn-off and sub-giant branch) are visible in both decontaminated diagrams.
3.5 Isochrone Fitting
To investigate the cluster properties we fit isochrones to the decontaminated CMDs and CCDs of our photometry, plus the 2MASS photometry of the brighter cluster stars. We use the isochrones from Girardi et al. 2002A&A…391..195G (2002) for 2MASS filters.
As a starting point for our fit we apply the parameters obtained by Kirkpatrick - a distance of 7.2 kpc and a reddening of about = 0.55 mag. To fully characterise the data, we further require the age and metallicity of the cluster and an extinction law. For the latter we will use the values from Mathis 1990ARA&A..28…37M (1990) throughout. We then fit isochrones with varying ages and metallicities simultaneously to both, the decontaminated CMDs and CCDs. As a fix-point to match the data and the model isochrones we use the red clump stars, since this is the feature in the data that is the most accurate to determine.
The extinction towards the cluster can be very accurately determined from the decontaminated CCD, since the isochrone position in this diagram is essentially independent of the age, distance and metallicity. We find that = 0.6 0.05 mag fits the data best.
We then fit isochrones with varying ages (log(age) = 9.40, 9.55, 9.70, 9.85, 10.0) and different metallicities (Z = 0.004, 0.008, 0.019) to the data. Each isochrone requires a slightly different extinction and distance of the cluster to fit the red clump stars. As an example we show in the left panels in Fig. 5 all isochrones for Z = 0.008. The various isochrones are then used to determine the best fitting parameters and their uncertainties.
At first we constrain the metallicity. It can in principle be determined using the slope of the RGB stars in the J-K vs. K diagram and using e.g. Fig. 8 in Valenti et al. 2004A&A…419..139V (2004). Applying this method we find [M/H] = -0.4 0.2 dex or Z = 0.005 to Z = 0.012. We can also look at the required extinction values for the isochrones. For Z = 0.004 a range of = 0.63 to 0.64 mag (depending on the age) is required. In the case of solar metallicity (Z = 0.019) we require a range of = 0.54 to 0.56 mag to obtain a fit in the CMD. Thus, for these cases the range of required values is on the borders of our uncertainty limit for the extinction. In particular the solar metallicity does not fit the data, and for Z = 0.004 only a marginal agreement with the data can be found. For Z = 0.008, however, the required range of extinction values to fit the isochrones is = 0.60 to 0.61 mag. This is in good agreement with our estimate using the CCD. Thus, the metallicity of the cluster can be constrained to Z = 0.008 0.004.
To establish the correct distance to the cluster we need to constrain the age. The usual procedure is to use the main sequence turn-off position. Though the turn-off is detected in our data its exact position in the CMD is difficult to determine. This is mostly due to the scatter of the photometry due to variable extinction in the field. However, in the decontaminated CMDs we can identify a number of sub-giant branch stars, which we can use as a further aid to ascertain the best fitting isochrone. Of the five isochrones we fit to the data, the one with the lowest age (log(age) = 9.40) cannot explain the observed sub-giant branch. This is indeed also the case for all other metallicities. The remaining isochrones fit the data well. However, the 10 Gyr isochrone clearly has a turn-off that is at too faint magnitudes. Hence, the age of the cluster can be constrained to between 3.5 Gyr and 7.0 Gyr with the most likely value of 5 Gyr. Please note that the distribution of age uncertainties might be even more asymmetric than suggested by the above range. This is caused by the fact that the main sequence turn off is near the photometric limit. Hence, the brightnesses of the cluster stars might be systematically increased due to noise and blends, which also might change the colours. Thus, the 5 Gyr are likely an upper limit.
If we use the 5 Gyr isochrone, Z = 0.008, and an extinction of = 0.6 mag, the distance of the cluster is 7.2 kpc. Considering the ranges in age, Z, and that we established, a range in distances from 6.8 kpc to 7.7 kpc is found. Hence we can constrain the distance to FSR 0358 to 7.2 0.5 kpc. The pink lines in the CCDs in Fig. 5 are drawn using the best fitting parameters. Figure 5 also illustrates that these results do not significantly depend on the choise of the control field for field star decontamination.
We obtain the same distance as given by Kirkpatrick. Our extinction is slightly higher, which is caused by our finding that the metallicity is sub-solar, in contrast to the assumption made in the original analysis. Furthermore, our new deeper data allowed us to stronger constrain the age of the cluster.
3.6 Deduced Cluster Properties
Given our isochrone and radial star density fit, we conclude that FSR 0358 is an old stellar cluster. Judging by the determined cluster parameters and its optical appearance, this object is similar to FSR 0190 (Froebrich et al. 2008a ). Both clusters have ages above several Gyr and sub-solar metallicities. The parameters put the cluster at a distance of 11.3 kpc from the Galactic Centre and 275 pc above the Galactic Plane, typical values for old open clusters. Note that FSR 0190 was found to be 10.5 kpc away from the Galactic Centre and 170 pc above the plane (Froebrich et al. 2008a ). These galactocentric distances are derived assuming a distance of the Sun to the Galactic Centre of 7.2 kpc (Bica et al. 2006A&A…450..105B (2006)).
Using the determined distance and radial star density fit, the core radius of the cluster is 2 pc. We can estimate its original mass following Salaris & Girardi 2002MNRAS.337..332S (2002). The current number of about 75 core helium burning objects indicates that FSR 0358 started off as an about 105 M⊙ cluster. We determine the clusters current absolute magnitude by adding the K-band magnitudes of all detected giant stars (our data plus 2MASS) and correct for the determined distance and extinction. We obtain MK = -8.1 mag, or MV = -6.2 mag assuming = 1.9 mag (Leitherer et al. 1999ApJS..123….3L (1999)). This puts it at the bright end of the open cluster luminosity function (van den Bergh & Lafontaine 1984AJ…..89.1822V (1984)). We summarise all the determined cluster parameters in Table 1.
| Property | value | Property | value |
|---|---|---|---|
| RA (J2000) | 22:10:14.1 | DEC (J2000) | 58:48:02 |
| 103.34094° | 2.20214° | ||
| age | 5 2 Gyr | Z | 0.008 0.004 |
| d⊙ | 7.2 0.5 kpc | AK | 0.6 0.05 mag |
| dGC | 11.3 0.8 kpc | z | 275 20 pc |
| 60″ | 2.1 0.2 pc | ||
| M | 105 M⊙ | MV | -6.2 mag |
4 Conclusions
Using an expectation-maximisation method, we have identified FSR 0358 as the most likely star cluster among the entire list of clusters in Froebrich et al. 2007b . It was originally discovered by Kirkpatrick and classified by this author as an old open star cluster. Our analysis of new UKIRT follow-up observations in combination with 2MASS data essentially confirms this conclusion, puts it on a more solid ground and allows us to refine some cluster parameters. Based upon the large population of red giant stars, the well-populated red clump in combination with the subgiant branch and the main sequence turn-off we derive a narrower age interval of Gyr and a lower metallicity of compared with Kirkpatrick. Our distance of 7.2 kpc is in agreement with the original value. This corresponds to a large distance from the Galactic centre, typical for old open clusters. Note that these results do not significantly depend on the choise of the control field for the field star decontamination. The object is notably similar to FSR 0190, another old open cluster detected amongst the FSR candidates (Froebrich et al. 2008a ).
The confirmation of FSR 038 (Kirkpatrick 1) as another well populated, distant, old open cluster shows that the FSR sample is useful for characterising the entire population of clusters within the Milky Way. It not just allows us to detect embedded young clusters, but also enables us to improve our statistics on the oldest clusters in the Galaxy, so far hidden behind dust clouds near the Galactic Plane. There are, for example, only 12 clusters with ages above 5 Gyr listed in the WEBDA database222http://www.univie.ac.at/webda/. So far there have been six clusters identified in the FSR list with an age of about 5 Gyr or older, significantly enhancing the known sample of these old clusters (FSR 0358 - this paper; FSR 1735 - Froebrich et al. 2007a ; 2008b ; FSR 0070, 1737 - Bica et a. 2008MNRAS.385..349B (2008); FSR 0584 - Bica et al. 2007A&A…472..483B (2007); FSR 0190 - Froebrich et al. 2008a ; and possibly FSR 1767 - Bonatto et al. 2007MNRAS.381L..45B (2007) but see Froebrich et al. 2008b ).
acknowledgments
We would like to thank the referee S. Ortolani for pointing us to the previous works by J.D. Kirkpatrick on this cluster and for further helpful comments to improve the analysis of our data. SS is supported by the Deutsche Forschungsgemeinschaft (DFG) through grant SCHM 2490/1-1. The United Kingdom Infrared Telescope is operated by the Joint Astronomy Centre on behalf of the Science and Technology Facilities Council of the U.K. This publication makes use of data products from the Two Micron All Sky Survey, which is a joint project of the University of Massachusetts and the Infrared Processing and Analysis Center/California Institute of Technology, funded by the National Aeronautics and Space Administration and the National Science Foundation.
References
- (1) Bertin, E., Arnouts, S. 1996, A&AS, 117, 393
- (2) Bica, E., Bonatto, C., Barbuy, B., Ortolani, S. 2006, A&A, 450, 105
- (3) Bica, E., Bonatto, C., Camargo, D. 2008, MNRAS, 384, 349
- (4) Bica, E., Bonatto, C., Ortolani, S., Barbuy, B. 2007, A&A, 472, 483
- (5) Bonatto, C., Bica, E. 2007, MNRAS, 377, 1301
- (6) Bonatto, C., Bica, E., Ortolani, S., Barbuy, B. 2007, MNRAS, in press
- (7) Dempster, A. P., Laird, N. M., Rubin, D. B., 1977, J. R. Stat. Soc. Ser. B, 39, 1
- (8) Froebrich, D., Meusinger, H., Scholz, A. 2007, MNRAS, 377, 54L
- (9) Froebrich, D., Meusinger, H., Davis, C.J. 2008, MNRAS, 383, 45
- (10) Froebrich, D., Meusinger, H., Scholz, A. 2008, MNRAS, 390, 1598
- (11) Froebrich, D., Scholz, A., Raftery, C.L. 2007, MNRAS, 374, 399
- (12) Froebrich, D. & del Burgo, C. 2006, MNRAS, 369, 1901
- (13) Girardi, L., Bertelli, G., Bressan, A., et al. 2002, A&A, 391, 195
- (14) King, I. 1962, AJ, 67, 471
- (15) Kroupa, P. 2008, arXiv:0810.4143
- (16) Lada, C.J. & Lada, E.A. 2003, ARAA, 41, 57
- (17) Leitherer, C., Schaerer, D., Goldader, J.D., et al. 1999, ApJS, 123, 3
- (18) Mathis, J.S. 1990, ARA&A, 28, 37
- (19) Mercer, E.P., Clemens, D.P., Meade, M.R., Babler, B.L., Indebetouw, R., Whitney, B.A., Watson, C., et al. 2005, ApJ, 635, 560
- (20) Ramsay Howat, S.K., Robertson, D.J., Haslehurst, A., Schmoll, J., Parr Burman, P., Sharples, R.M., Dickson, C., et al. 2004, In Proc Spie 5492, UV and Gamma-Ray Space Telescope Systems, eds. Hasinger G, Turner M.J., SPIE, 5492, 1160.
- (21) Salaris, M., Girardi, L. 2002, MNRAS, 337, 332
- (22) Schwarz G., 1978, Annals of Statistics, 6, 461
- (23) Skrutskie, M.F., Cutri, R.M., Stiening, R., et al. 2006, AJ, 131, 1163
- (24) Valenti, E., Ferraro, F. R., Perina, S., Origlia, L. 2004, A&A, 419, 139
- (25) van den Bergh, S., Lafontaine, A. 1984, AJ, 89, 1822
- (26) West, M. J., C., P., Marzke, R. O.& Jordán, A. 2004, Nature, 427, 31