Spitzer Observations of the Oldest White Dwarfs in the Solar Neighborhood
Abstract
We present Spitzer 5-15 m spectroscopy of one cool white dwarf and 3.6 – 8 m photometry of 51 cool white dwarfs with K. The majority of our targets have accurate BVRIJHK photometry and trigonometric parallax measurements available, which enables us to perform a detailed model atmosphere analysis using their optical, near- and mid-infrared photometry with state-of-the-art model atmospheres. We demonstrate that the optical and infrared spectral energy distributions of cool white dwarfs are well reproduced by our grid of models. Our best fit models are consistent with the observations within 5% in all filters except the IRAC 8 m band, which has the lowest signal-to-noise ratio photometry. Excluding the ultracool white dwarfs, none of the stars in our sample show significant mid-infrared flux deficits or excesses. The non-detection of mid-infrared excess flux around our 2-9 Gyr old targets constrain the fraction of cool white dwarfs with warm debris disks to %.
1 Introduction
Devoid of any nuclear burning, white dwarfs simply cool with time. This well understood cooling process (Mestel, 1952) enables astronomers to use them as cosmic chronometers. The absence of white dwarfs fainter than in the Solar Neighborhood is used as evidence of the finite age of the Galactic disk (Winget et al., 1987). The best estimate for the age of the Galactic disk based on the white dwarf luminosity function is Gyr (Leggett et al., 1998; Harris et al., 2006). This method has now been applied to two halo globular clusters, M4 and NGC 6397 (Hansen et al., 2002, 2007).
Prior to the Spitzer Space Telescope, the oldest white dwarfs in the Solar Neighborhood could not be observed in the mid-infrared due to their faintness. Therefore, the luminosities of cool white dwarfs were estimated using optical and near-infrared photometry, and bolometric corrections based on white dwarf model atmospheres. An observational check on these corrections is required to confirm their reliability. Such studies by Kilic et al. (2006a); Tremblay & Bergeron (2007) and Kilic et al. (2008a) showed that the white dwarf models are able to explain the spectral energy distributions (SEDs) of almost all cool white dwarfs with K. However, significant mid-infrared flux deficits compared to model predictions were discovered for one star, LHS 1126.
The main atmospheric constituents in cool white dwarfs are hydrogen and helium, though trace amounts of heavier elements are also observed in some white dwarfs. The atmospheric compositions of white dwarfs hotter than 5000 K can generally be constrained based on the presence of Balmer lines. However, Balmer lines disappear below about 5000 K, and optical spectroscopy cannot be used to identify hydrogen versus helium rich white dwarfs. The most critical opacity sources in cool hydrogen-rich white dwarf atmospheres are believed to be collision induced absorption (CIA) in the infrared (Hansen, 1998; Saumon & Jacobson, 1999) and Ly in the ultraviolet (Kowalski & Saumon, 2006; Koester & Wolff, 2000). The primary opacity source in helium-rich white dwarfs is He- free-free absorption (Kowalski et al., 2007). Helium atmospheres are much denser than hydrogen atmospheres at the same temperature. Therefore if hydrogen is present, collisions between H2 molecules and neutral helium can induce CIA. This opacity becomes significant at higher temperatures compared to pure hydrogen atmospheres.
CIA opacity is expected to produce molecular absorption features in the near-infrared, but current CIA calculations do not predict absorption bands in the mid-infrared. Therefore, the observed mid-infrared flux deficits for LHS 1126 imply that either the CIA calculations in white dwarf atmospheres are incomplete, or these flux deficits are caused by some other mechanism 111LHS 1126 shows blue shifted carbon bands in the optical (see Hall & Maxwell, 2008) and we cannot rule out peculiarities in its infrared SED due to the presence of carbon or other elements.. An important question for white dwarf cosmochronology is whether LHS 1126 is unique or not. The previous Spitzer observations of cool white dwarfs included only a few stars cooler than 6000 K, and the mid-infrared flux distributions of the oldest white dwarfs in the Solar Neighborhood have not been studied yet.
In order to understand the mid-infrared SEDs of cool white dwarfs and the CIA opacity, we used the Infrared Array Camera (IRAC, Fazio et al., 2004) on the Spitzer Space Telescope to observe 53 nearby cool white dwarfs. We also used the Infrared Spectrograph (IRS) to observe one of our targets. In this paper, we present IRAC photometry and IRS spectroscopy of these stars and perform detailed model atmosphere analysis using both optical and infrared data. Our observations and model fits are discussed in §2 and §3, respectively, while implications of these data are discussed in §4 and §5.
2 Sample Selection, Observations, and Reductions
We selected our targets from the samples of Bergeron et al. (1997, 2001, 2005). The beauty of this sample selection is that Bergeron et al. provided accurate BVRIJHK photometry and trigonometric parallax measurements for the majority of our targets. Our sample also includes three cool white dwarfs found in the Sloan Digital Sky Survey (SDSS) by Kilic et al. (2006b). These three stars have near-infrared photometry from the Two Micron All Sky Survey (2MASS, Cutri et al., 2003). We also added three ultracool white dwarfs, LHS 3250 (Harris et al., 1999), CE 51 (Ruiz & Bergeron, 2001), and WD 0346+246 (Hambly et al., 1997), to our sample to extend our study to K. The majority of our targets have accurate coordinates and proper motions measured by Lépine & Shara (2005), which is very helpful in identifying these faint objects in crowded fields.
Observations reported here were obtained as part of our Cycle 3 GO-Program 30208 (PI: M. Kilic). We obtained 3.6, 4.5, 5.8, and 8 m images for 53 cool white dwarfs including two common proper motion systems in 51 Astronomical Observation Requests (AORs). Depending on the source brightnesses, integration times of 30 or 100 seconds per dither, with five or nine dithers for each target, were used. We reduced the data using both IRAF and IDL routines. Our reduction procedures are similar to the procedures employed by Kilic et al. (2008a) and Mullally et al. (2007). Briefly, we use the IRAF PHOT and IDL astrolib packages to perform aperture photometry on the individual BCD frames from the latest available IRAC pipeline reduction (S14.4.0, S15.3.0, S15.0.5, or S16.1.0 for our targets). In order to maximize the signal-to-noise ratio, we used a 5 pixel aperture for bright, isolated objects, and 2 or 3 pixel apertures for faint objects or objects in crowded fields. Following the IRAC calibration procedure, corrections for the location of the source in the array were taken into account before averaging the fluxes of each of the dithered frames at each wavelength. Channel 1 (3.6m) photometry was also corrected for the pixel-phase-dependence (see the IRAC Data Handbook). The results from IRAF and IDL reductions were consistent within the errors. The photometric error bars were estimated from the observed scatter in the 5 (or 9) images (corresponding to the dither positions) plus the 3% absolute calibration error, added in quadrature. Finally, we divided the estimated fluxes by the color corrections for a Rayleigh-Jeans spectrum (Reach et al., 2005). These corrections are 1.0111, 1.0121, 1.0155, and 1.0337 for the 3.6, 4.5, 5.8, and 8 m bands, respectively222These corrections were also used in Kilic et al. (2006a) and Kilic et al. (2008a)..
We present the average fluxes measured from the Spitzer images in Table 1. Two of the stars in our sample, WD 0346+246 and WD 1310472 were blended with brighter stars, which prohibited us from performing photometry on these objects. These two stars are not included in Table 1. Another common proper motion binary system, WD0727+482A and WD0727+482B, was unresolved in IRAC images, and the photometry presented in Table 1 is the total flux from the system. We included this flux measurement for completeness purposes, however we do not include these two stars in our analysis for the remainder of the paper. Five other stars, WD 0222+648, WD 0551+468, WD 0851246 (CE 51), WD 1247+550, and WD 2054050, are near brighter stars in the IRAC images, and the photometry is probably affected by these nearby sources. We present the photometry for these five stars and include them in our analysis, but do not use them to draw any conclusions.
As part of our Cycle 3 program, we also used the Infrared Spectrograph (IRS, Houck et al., 2004) Short-Low module in the first and second orders to obtain 5-15 m spectroscopy of the brightest cool white dwarf in our sample, Wolf 489 (WD 1334+039). These observations consisted of 44 cycles of 1 min exposures and were performed on 2007 July 29. For each of the 44 basic calibrated spectral images (BCDs) at each of the two nod positions and each of the two orders of the IRS, a cube was compiled. Each cube was collapsed into a spectral image, using a robust average. Outlier pixels with respect to a box median were replaced with the median, to account for rogue and dead pixels. The two nodded spectral images for each order were differenced. A significant spatial gradient is evident in the nod difference images, so we removed a row-by-row (i.e. approximately constant wavelength) median spanning spectral order on the nod-difference image. The background-subtracted difference images were analyzed using SMART (Higdon et al., 2004), using manual extractions of tapered apertures and local background subtraction from the portion of the slit not covered by the source. The extracted spectra were merged and rebinned using a logarithmic bin spacing, yielding the final spectrum.
3 Model Atmospheres and the Fitting Procedures
We use state of the art white dwarf model atmospheres to fit the BVRIJHK and Spitzer photometry of our targets. Our fitting procedure is the same as the method employed by Tremblay & Bergeron (2007). Briefly, the magnitudes are converted into monochromatic fluxes using the zero points derived from the Vega (STIS) spectrum integrated over the passband for each filter. The resulting fluxes are then compared with those predicted from the model atmospheres, integrated over the same bandpass. We use the parallax measurements to constrain the surface gravity, if available. Otherwise, we assume a surface gravity of g = 8. The model atmospheres include the Ly far red wing opacity (Kowalski & Saumon, 2006) as well as non-ideal physics of dense helium that includes refraction (Kowalski & Saumon, 2004), ionization equilibrium (Kowalski et al., 2007), and the non-ideal dissociation equilibrium of H2 (Kowalski, 2006). Using these models, Kowalski & Saumon (2006) were able to reproduce the ultraviolet to near-infrared spectral energy distributions of several cool white dwarfs including the DA star BPM 4729. This star has a UV spectrum that can only be reproduced by pure hydrogen atmosphere models including the Ly opacity. This opacity occurs due to collisions of hydrogen atoms with H2, and it dominates at Å for cool white dwarfs, i.e. when H2 forms. Even though the Ly opacity mainly supresses the flux in the ultraviolet, it causes a significant redistribution of flux toward longer wavelengths.
We perform three separate sets of fits. The first set of fits involves pure hydrogen models with and g as free parameters. The second set of fits uses mixed H/He models and assumes that the helium-to-hydrogen ratio is a free parameter as well. Both sets of fits use models with K and g = . Finally, the last set of fits were performed with blackbody SEDs. Kowalski & Saumon (2006) demonstrated that pure helium atmosphere white dwarfs have SEDs similar to blackbodies, therefore if any of our targets have pure helium atmospheres, they should be best explained by the third set of fits.
4 Results
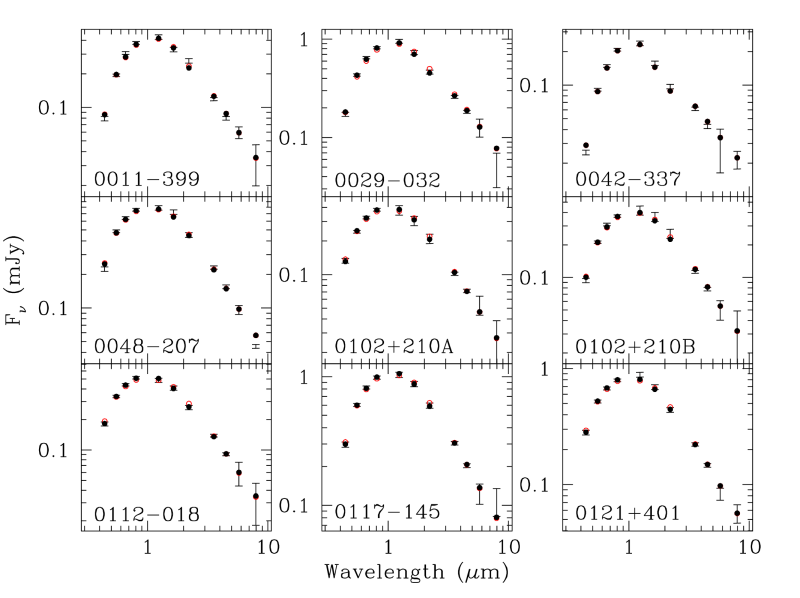
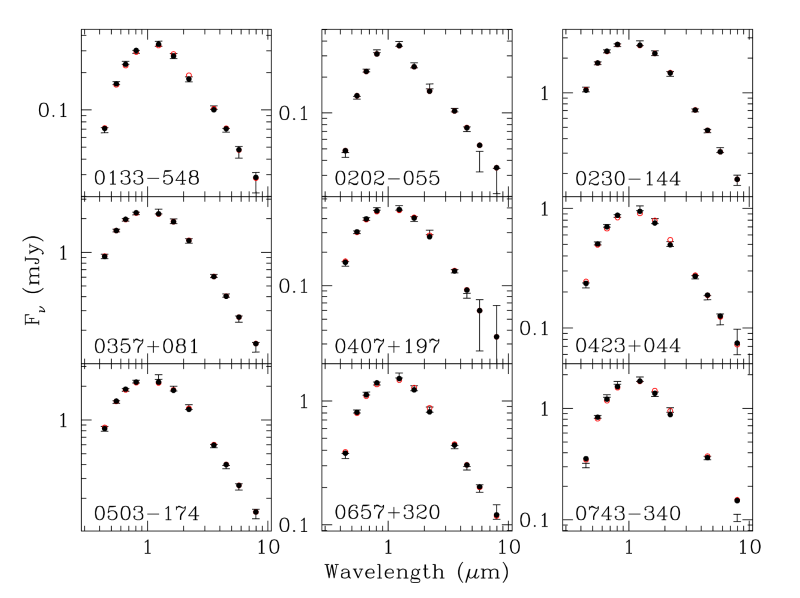
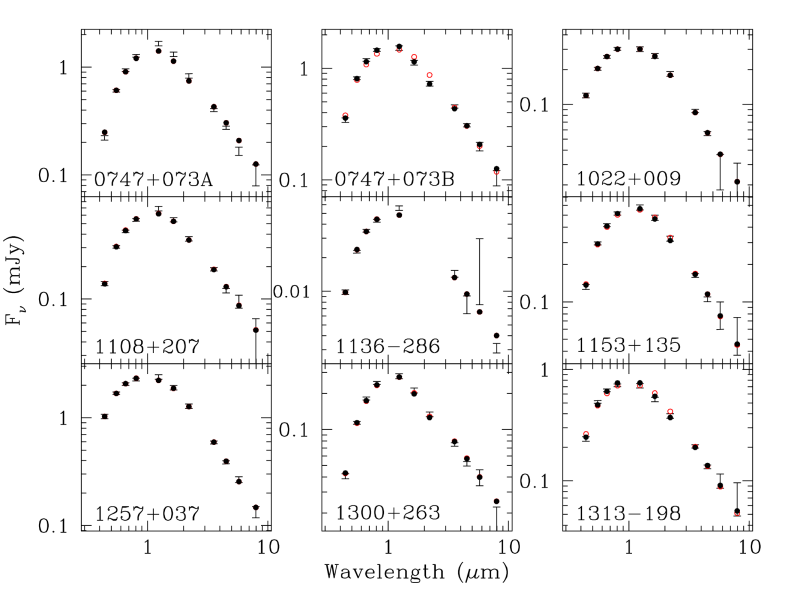
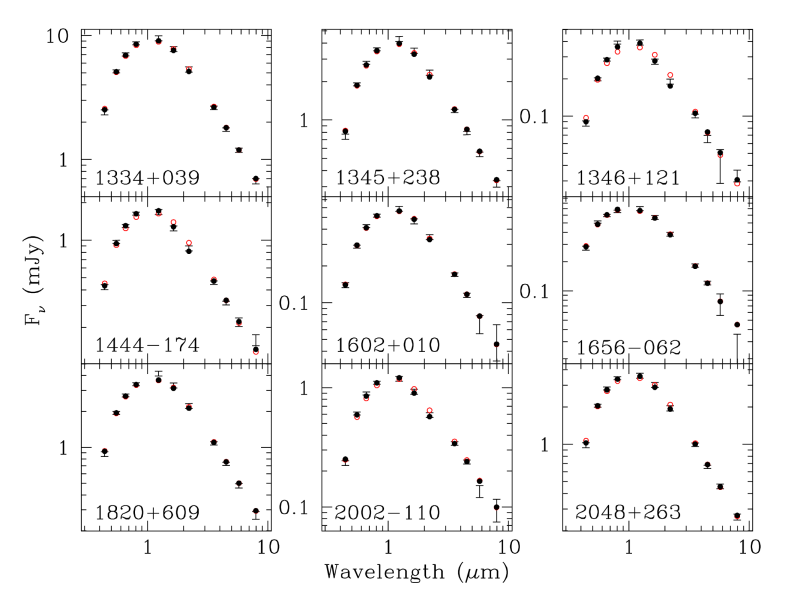
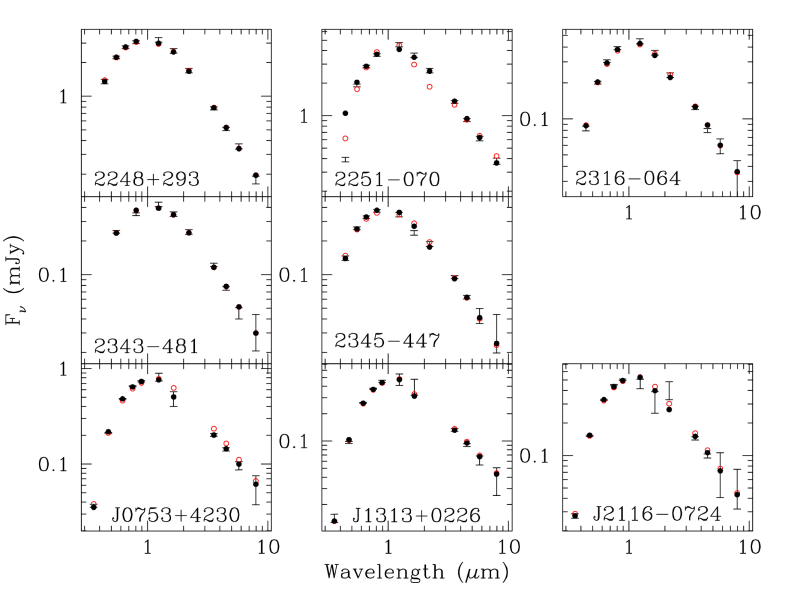
Figure 1 displays the optical and infrared SEDs (error bars) for 44 cool white dwarfs with 6000 K. Three of these stars (plotted at the end of the figure) are from the SDSS, and their photometry is in the SDSS and 2MASS system. The remaining 41 stars have photometry available. The expected fluxes from synthetic photometry of pure hydrogen and mixed H/He white dwarf model atmospheres are shown as open and filled circles, respectively. Since the pure hydrogen or mixed H/He models reproduce the SEDs better than the blackbody SEDs, the blackbody fits are not shown in any of the panels except for WD 2251070. This star is a DZ white dwarf. Excluding the B-band flux which is affected by the presence of metals in the photosphere, WD 2251070 is the only object for which a blackbody SED is a better fit to the observed SED than pure hydrogen or mixed H/He models.
The differences between the pure hydrogen and mixed H/He models are not statistically significant for the majority of our targets. For example, the predicted SEDs for the pure H and mixed H/He solutions for WD 1656062 are almost identical. One cannot differentiate between these two models based on the SED alone. WD 1656062, like 19 other WDs in our sample, is a DA white dwarf. Bergeron et al. (2001) found that the pure hydrogen models are in good agreement with H spectroscopy of most stars in their (and our) sample. Therefore, we adopt the pure hydrogen atmosphere solutions for all DAs.
A 5% uncertainty in the band flux corresponds to a helium detection limit of He/H = 0.04, 0.36, and 2.14 for 4000, 5000, and 6000 K white dwarfs, respectively. Out of the 23 DC white dwarfs in our sample, 12 are best explained with mixed atmosphere models that have He/H ratios above this detection limit. Hence, we classify these white dwarfs as mixed H/He atmosphere objects. A few examples of the superior fits by mixed H/He fits include WD 0029032, WD 0747+073B, WD 1313198, WD 1444174, and SDSS J0753+4230. The differences between the best-fit pure hydrogen and mixed H/He models are not significant for the remaining 11 DCs, and we assign pure hydrogen composition to them. The physical parameters of the best fit atmosphere solutions as well as the spectral types of our targets are presented in Table 2.
Only one star in Table 2 is assigned a pure helium composition. This result was expected considering the work of Kowalski & Saumon (2006), which has satisfactorily demonstrated that the optical and near-infrared colors of cool white dwarfs are explained fairly well with the new pure hydrogen models. Yet this result is surprising from an evolutionary point of view, since Tremblay & Bergeron (2008) demonstrated that 45% of white dwarfs in the range 7000 K 5000 K have helium-rich atmospheres (with possible traces of hydrogen). The mixed H/He composition stars make up 27% of our sample. However, the helium to hydrogen ratio for these stars is on the order of unity. Our result presents an important challenge to understanding the spectral evolution of white dwarfs.
In any case, the choice of pure hydrogen or mixed H/He models do not have an important effect on understanding the mid-infrared flux distributions of cool white dwarfs. Figure 1 demonstrates that the main difference between the best-fit pure hydrogen and mixed H/He models is in the optical and near-infrared, and both sets of models agree in the mid-infrared. Moreover, it shows that our grid of models reproduce the observed SEDs well in the entire range from 0.4m to 8m. We do not find any significant mid-infrared flux deficits for these 44 cool white dwarfs. We now check to see how well the models are able to reproduce the observations. Tremblay & Bergeron (2007) found that the 12 cool white dwarfs that they analyzed were on average fainter by 2% in the 4.5 m band, whereas they could fit the 8 m photometry fairly well with their models. Debes et al. (2007) and Farihi et al. (2008a) found that the models reproduce the observed mid-infrared fluxes within 5%, slightly larger than the IRAC calibration uncertainty of 3% measured by Reach et al. (2005).
Figure 2 presents the ratio of observed to predicted fluxes in all 11 filters from our analysis using the pure hydrogen atmosphere fits. The IRAC 3.6, 4.5, 5.8, and 8 m bands are labeled as I1, I2, I3, and I4, respectively. Figure 3 shows the same ratios for the best-fit models to the SEDs (31 pure hydrogen and 12 mixed H/He atmosphere solutions given in Table 2). A comparison of Figure 2 with Figure 3 shows that the use of mixed H/He models for the 12 DCs improves the agreement between the observations and models. Instead of looking at how well the models can reproduce the observations just in the mid-infrared, testing the models in all filters gives us a better idea of how well the models work in general. The photometric uncertainties in are 3% and in are 5% (Bergeron et al., 2001). Our photometric methods are consistent with those used for the IRAC absolute calibration (Reach et al., 2005), and therefore the mid-infrared fluxes should be accurate to 3%.
Table 3 presents the mean differences between the observed photometry and models for all filters. The pure hydrogen models are consistent with the observations within 6%. Excluding the IRAC 8 band which has the lowest signal-to-noise ratio photometry, the best fit models are consistent with observations within 5%. Given the 3-5% uncertainty in the observations, we conclude that the optical, near-infrared, and IRAC photometry of cool white dwarfs are consistent with white dwarf model atmospheres.
Subtle systematic trends as a function of effective temperature are visible in Figure 2 and 3. Even though individual points in these trends are not statistically off the one-to-one line, having a relatively large sample of stars enables us to see these subtle effects. The band and IRAC2 differences are perhaps the most convincing of these trends. Understanding these trends is useful for improving the current model atmosphere calculations. The observed trend in the band is especially important as the band flux is mostly suppressed by the Ly red wing opacity in cool white dwarf atmospheres. Due to the uncertainty in the HH potential energy surface and transition dipole moments, the Ly profiles used in Kowalski & Saumon (2006) models are reliable up to 6000 Å. Kowalski & Saumon (2006) extrapolated the Ly profiles for longer wavelengths. The Ly absorption dominates up to 4500 Å for 5000 K white dwarfs. However, it is important up to 6000 Å and 7000 Å for 4500 K and 4000 K, respectively. Therefore, assuming that the other absorption mechanisms are correctly described in the models, the observed drift with may indicate the need for extension of calculated Ly profiles beyond Å. However, we do not exclude other mechanisms that may cause the observed systematic trends.
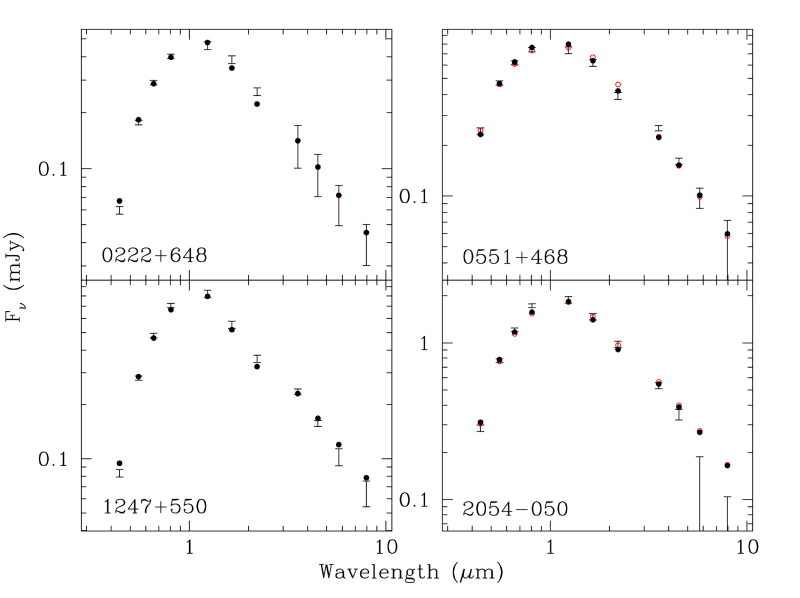
Figure 4 shows four white dwarfs with Spitzer photometry that are perhaps affected by nearby bright stars. Similar to the other 44 stars presented in previous figures, the SEDs for these stars are also consistent with model predictions, and we do not find significant mid-infrared flux deficits.
The optical and infrared photometry and our IRS spectrum of the brightest target in our sample, the DA white dwarf Wolf 489, are presented in Figure 5. The best fit model spectra with pure H and mixed H/He compositions are shown as solid and dashed lines, respectively. The main difference between these two models are in the optical and they predict the same flux distribution in the mid-infrared. The IRS spectrum is shown as a jagged line with error bars. Since Wolf 489 has a proper motion of yr-1 (Lépine & Shara, 2005), the IRS centering was not perfect, and the measured fluxes from the spectrum were a factor of six lower than the IRAC photometry. The centering problem resulted in lower signal-to-noise ratio data and low level fluctuations are visible in the spectrum. Since the IRS spectrum covers the IRAC 8m band, we normalized it to match the 8m photometry. A comparion of the best fit models and the observations shows that the observed IRS spectrum is entirely consistent with 5000 K white dwarf models over the 5-15 m range, further confirming our conclusion that the SEDs of cool white dwarfs are consistent with model predictions.
4.1 Ultracool White Dwarfs
White dwarfs with thought to be below 4000 K are classified as ultracool. Ten years after the discovery of the first ultracool white dwarf LHS 3250 (Harris et al., 1999), there are now more than a dozen known (see Gates et al., 2004; Harris et al., 2008, and references therein). However, only a few of them have been studied in detail using optical and near-infrared photometry and trigonometric parallax measurements (Bergeron & Leggett, 2002). The main difference between cool and ultracool white dwarfs is that several of these ultracool white dwarfs show significant flux deficits in the near-infrared and even in the optical, which is most probably caused by the strong CIA absorption from H2 in a dense, helium dominated atmosphere. The SEDs of these white dwarfs cannot be fit with any model atmospheres currently available.
LHS 1126 is not classified as an ultracool white dwarf since its optical colors are consistent with 5400 K (Bergeron et al., 1994). However, it also displays significant flux deficits in the near- and mid-infrared. A remaining question is whether all white dwarfs that display significant flux deficits in the near-infrared also display deficits in the mid-infrared or not. The importance of this question is that current CIA opacity calculations do not predict absorption in the mid-infrared. Therefore, finding several ultracool white dwarfs with mid-infrared flux deficits would mean that there is a missing opacity source in current white dwarf atmosphere models.
Three ultracool white dwarfs were included in our sample, LHS 3250, CE 51, and WD 0346+246. Unfortunately, WD 0346+246 was blended with a brighter source in the IRAC images and we could not recover its photometry. Spitzer photometry of CE 51 is also affected by a very bright nearby star. Ruiz & Bergeron (2001) assigned a temperature of 2730 K to CE 51 based on its optical photometry. Extending our models down to 2500 K, and including the IRAC photometry in our fits does not change the best-fit temperature much. We find a best-fit solution of 2660 K for a pure hydrogen composition. However, the best-fit model is not a good representation of the optical and mid-infrared photometry. Since our IRAC photometry is questionable for this star, we cannot draw any other conclusions at this time.
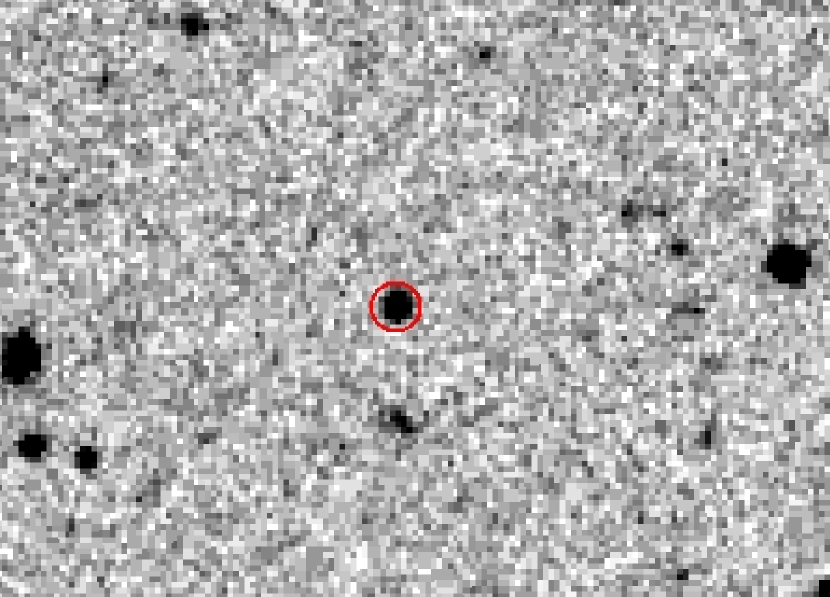
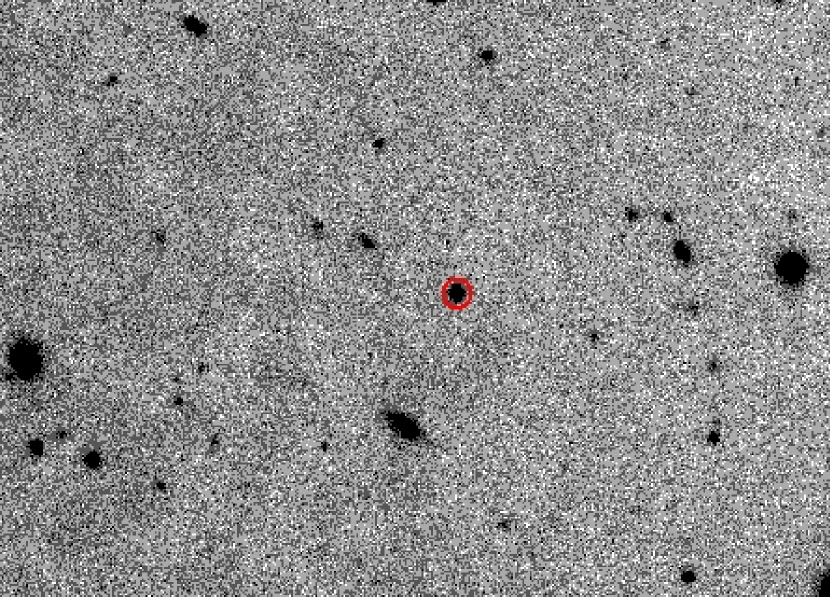
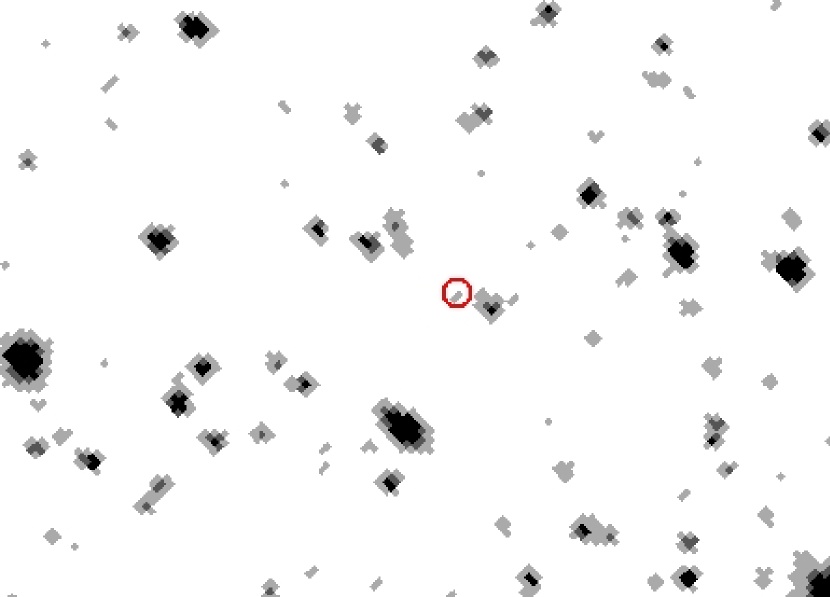
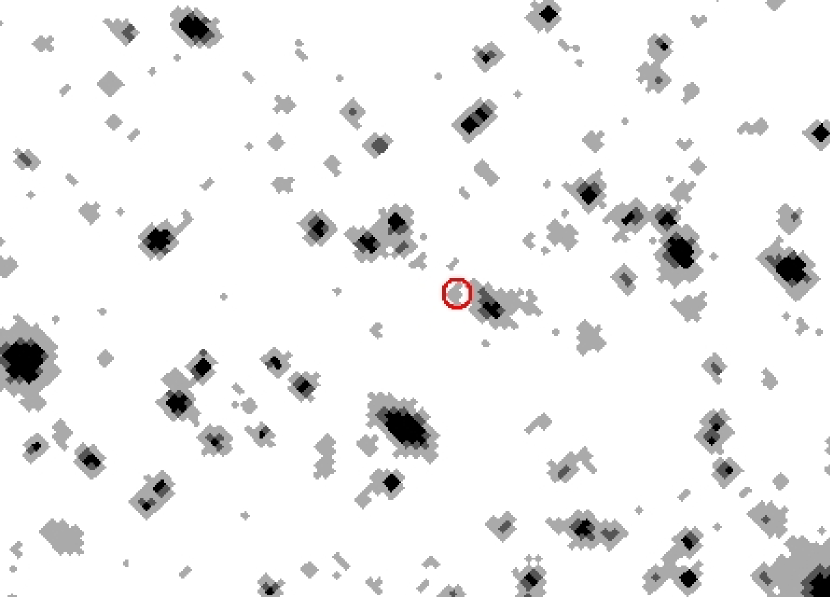
LHS 3250 was close to an extended source in our IRAC images, however we are able to recover the photometry using a 2 pixel aperture. Figure 6 shows LHS 3250 images from 1988 to 2007. Our Spitzer IRAC images were taken in August 2006, 9 months before the band image from the MDM 2.4m telescope was taken. LHS 3250 has a proper motion of (, +0.148 mas yr-1; Munn et al. 2004) , therefore the position measured from the band images should be essentially the same as the position in our IRAC images. This position is marked with open circles in the MDM and IRAC images; LHS 3250 is clearly detected.
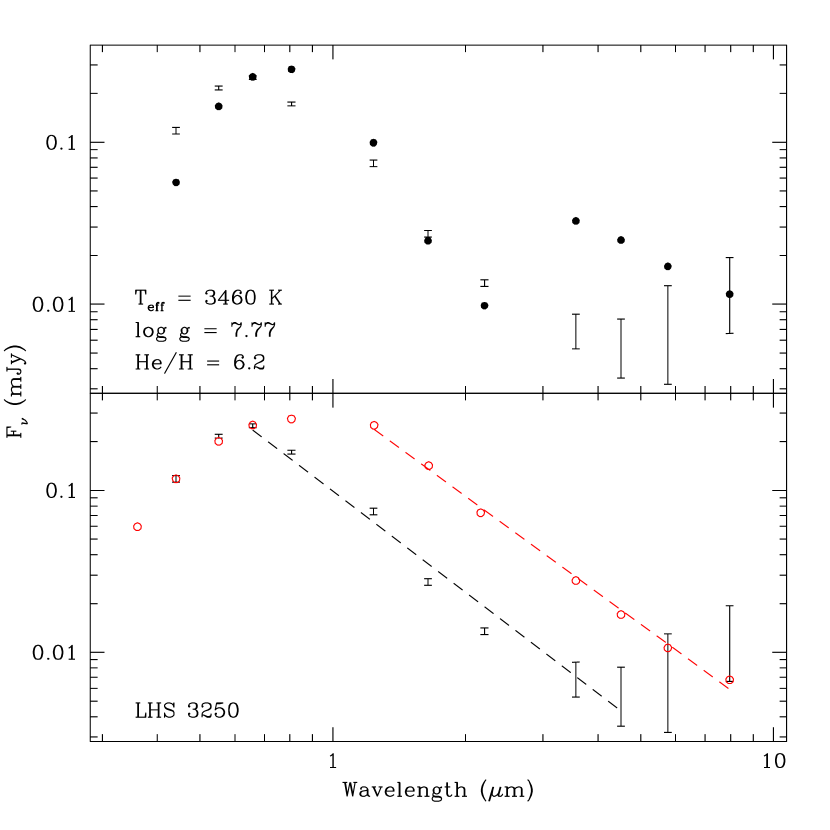
LHS 3250 is quite faint in the mid-infrared. From the BCD frames, we measure average fluxes of 7.0 1.7, 5.8 2.3, 8.1 4.9, and 13 6.4 Jy in the 3.6, 4.5, 5.8, and 8 m bands, respectively. Using the combined mosaic images, we measure 7.0, 6.0, 6.1, and 10.7 Jy in the same bands, respectively. Photometry from the BCD frames and the mosaic frames are consistent within the errors. The LHS 3250 SED compared to the best fit mixed H/He atmosphere model is shown in the top panel in Figure 7. The effect of CIA opacity is clearly seen in the models; there is a big dip in the predicted fluxes up to about 3 m due to H2 1–0 dipole absorption centered at 2.4 m. The models obviously fail to reproduce the observations in all bands. As in previous attempts by other authors (Harris et al., 1999; Bergeron & Leggett, 2002), the SED cannot be explained with current white dwarf model atmospheres.
The bottom panel in Figure 7 compares the LHS 3250 SED with LHS 1126. We normalized the LHS 1126 SED to match LHS 3250 in the band. Since LHS 1126 is more than an order of magnitude brighter, its infrared fluxes are more accurate. The infrared portion of the LHS 1126 SED is best fit with a power law index of 1.99. On the other hand, the infrared portion of the LHS 3250 SED, excluding the 5.8 and 8 m photometry due to large error bars, fits a power law index of 2.07. However, the power law fit is not as good a fit as for LHS 1126. The fluxes measured between 3.6 and 8 m are consistent with each other within the errors.
5 Discussion
5.1 Cool White Dwarf Atmospheres in the Infrared
We now have extended the earlier work on Spitzer observations of cool white dwarfs (Kilic et al., 2006a, 2008a) down to 4000 K using a well studied sample of nearby white dwarfs. Our fits to the and m photometry of 50 cool white dwarfs show that current state of the art white dwarf model atmospheres are able to reproduce the observations within 5%. The only exception to this is LHS 1126, which shows significant flux deficits in the mid-infrared compared to the models. In addition, our models are not able to explain the observed optical and infrared SED of the ultracool white dwarf LHS 3250. More theoretical work on understanding the properties of dense helium-rich, mixed H/He white dwarf atmospheres is probably needed to understand the spectra of stars like this. A comparison of the SEDs for LHS 1126 and LHS 3250 shows that a power law may explain the infrared flux distributions of both stars, however, the LHS 3250 SED shows evidence of a flat or increasing mid-infrared flux distribution, and therefore its SED remains puzzling. Obtaining higher quality mid-infrared data for LHS 3250 and extending the wavelength coverage further to the red will be important in understanding LHS 3250 and other ultracool white dwarf atmospheres. This will be possible with the Mid-Infrared Instrument (MIRI) on the James Webb Space Telescope.
5.2 Infrared Excess from Dust Disks
Previous ground- and space-based studies of metal-rich white dwarfs showed that 20% of hydrogen atmosphere white dwarfs with 7400 K display infrared excesses from dust disks (see Kilic et al., 2008b, and references therein). However, the majority of these disks are found around stars hotter than 10000 K and younger than 1 Gyr. The fraction of dusty white dwarfs goes down to 1-3% for previous Spitzer observations of 200 white dwarfs with somewhat less metallicity bias (Farihi et al., 2008b). Mullally et al. (2007) found 2 dusty stars out of 124 white dwarfs, corresponding to a fraction of %. Assuming optically thick and flat disk models, these disks are within 1 of white dwarfs (Jura et al., 2007; von Hippel et al., 2007). An important step in understanding the formation and evolution of these disks is the disk lifetimes and whether the dust can survive for the lifetime of the white dwarf or not.
Previous Spitzer observations of white dwarfs targeted mostly stars with 6000 K and ages younger than 2 Gyr. Extending the temperature limit down to 4000 K corresponds to extending the ages up to 9 Gyr for typical 0.6 white dwarfs (Bergeron et al., 1995). Excluding the ultracool white dwarfs from our sample, none of the 48 cool white dwarfs (Figure 1 and 4) in our sample shows excess infrared radiation from disks. However, cooler stellar effective temperatures would mean that if disks are present, they will be substantially cooler than the disks around warmer white dwarfs. For example, if we take the disk around G29-38 as a prototype and put it around a 5000 K white dwarf, the disk would have an inner temperature of 600 K and an outer temperature of 350 K.
Figure 8 shows several flat disk models (Jura, 2003) for a 5000 K white dwarf at 20 pc. The solid line shows the total flux expected from the photosphere of a 5000 K white dwarf and a disk with an inclination angle 45o and the same inner-outer radii as G29-38. The short-dashed line shows the flux expected from a disk further away from the star, with parameters similar to G16658 (Farihi et al., 2008a). The other dashed and dashed-dotted lines show the differences in disk emission depending on the inner radii of the disks. Here we only explore the disks out to 1.2 as it corresponds to the Roche limit for typical white dwarfs (von Hippel et al., 2007; Farihi et al., 2008a). Adopting an accuracy of 5% in the Spitzer IRAC bands, the solid horizontal line shows 3 excess above the photospheric emission at 8m. It is evident from this figure that, if disks survive for several billion years or if they are replenished, they should be detected in our IRAC observations if the inner radii of the disks are smaller than 0.5 . Colder disks with larger inner radii would be visible at longer wavelengths.
Non-detection of disks around our 48 targets means that the frequency of warm disks around cool white dwarfs is %, still consistent with the frequency of disks for warmer white dwarfs.
References
- Bergeron et al. (1994) Bergeron, P., Ruiz, M.-T., Leggett, S. K., Saumon, D., & Wesemael, F. 1994, ApJ, 423, 456
- Bergeron et al. (1995) Bergeron, P., Wesemael, F., & Beauchamp, A. 1995, PASP, 107, 1047
- Bergeron et al. (1997) Bergeron, P., Ruiz, M. T., & Leggett, S. K. 1997, ApJS, 108, 339
- Bergeron et al. (2001) Bergeron, P., Leggett, S. K. , & Ruiz, M. T. 2001, ApJS, 133, 413
- Bergeron & Leggett (2002) Bergeron, P., & Leggett, S. K. 2002, ApJ, 580, 1070
- Bergeron et al. (2005) Bergeron, P., Ruiz, M. T., Hamuy, M., Leggett, S. K., Currie, M. J., Lajoie, C.-P., & Dufour, P. 2005, ApJ, 625, 838
- Cutri et al. (2003) Cutri, R. M et al. 2003, VizieR Online Data Catalog, 2246
- Debes et al. (2007) Debes, J. H., Sigurdsson, S., & Hansen, B. 2007, AJ, 134, 1662
- Farihi et al. (2008a) Farihi, J., Zuckerman, B., & Becklin, E. E. 2008a, ApJ, 674, 431
- Farihi et al. (2008b) Farihi, J., Jura, M., & Zuckerman, B. 2008b, ApJ, submitted
- Fazio et al. (2004) Fazio, G. G. et al. 2004, ApJS, 154, 10
- Gates et al. (2004) Gates, E. 2004, ApJ, 612, 129
- Hall & Maxwell (2008) Hall, P. B., & Maxwell, A. J. 2008, ApJ, 678, 1292
- Hambly et al. (1997) Hambly, N. C., Smartt, S. J., & Hodgkin, S. T. 1997, ApJ, 489, L157
- Hansen (1998) Hansen, B. M. S. 1998, Nature, 394, 860
- Hansen et al. (2002) Hansen, B. M. S., Brewer, J., Fahlman, G. G., Gibson, B. K., Ibata, R., Limongi, M., Rich, R. M., Richer, H. B., Shara, M. M., & Stetson, P. B. 2002, ApJ, 574, L155
- Hansen et al. (2007) Hansen, B. M. S., et al. 2007, ApJ, 671, 380
- Harris et al. (1999) Harris, H. C., Dahn, C. C., Vrba, F. J., Henden, A. A., Liebert, J., Schmidt, G. D., & Reid, I. N. 1999, ApJ, 524, 1000
- Harris et al. (2006) Harris, H. C., et al. 2006, AJ, 131, 571
- Harris et al. (2008) Harris, H. C., et al. 2008, ApJ, 679, 697
- Higdon et al. (2004) Higdon et al., PASP 116, 975-984, 2004
- Houck et al. (2004) Houck, J. R., et al. 2004, ApJS, 154, 18
- Jura (2003) Jura, M. 2003, ApJ, 584, L91
- Jura et al. (2007) Jura, M., Farihi, J., Zuckerman, B., & Becklin, E. E. 2007, AJ, 133, 1927
- Kilic et al. (2006a) Kilic, M., von Hippel, T., Mullally, F., Reach, W. T., Kuchner, M. J., Winget, D. E., & Burrows, A. 2006, ApJ, 642, 1051
- Kilic et al. (2006b) Kilic, M., et al. 2006, AJ, 131, 582
- Kilic et al. (2008a) Kilic, M., Kowalski, P. M., Mullally, F., Reach, W. T., & von Hippel, T. 2008, ApJ, 678, 1298
- Kilic et al. (2008b) Kilic, M., Farihi, J., Nitta, A., & Leggett, S. K. 2008, AJ, 136, 111
- Koester & Wolff (2000) Koester, D. & Wolff, b. 2000, A&A, 357, 587
- Kowalski & Saumon (2004) Kowalski, P. M. & Saumon, D. 2004, ApJ, 607, 970
- Kowalski (2006) Kowalski, P. M. 2006, ApJ, 641,488
- Kowalski & Saumon (2006) Kowalski, P. M., & Saumon, D. 2006, ApJ, 651, L137
- Kowalski et al. (2007) Kowalski, P. et al 2007, Phys. Rev. B. 2007, 76
- Leggett et al. (1998) Leggett, S. K., Ruiz, M. T., & Bergeron, P. 1998, ApJ, 497, 294
- Lépine & Shara (2005) Lépine, S., & Shara, M. M. 2005, AJ, 129, 1483
- Mestel (1952) Mestel, L. 1952, MNRAS, 112, 583
- Mullally et al. (2007) Mullally, F., Kilic, M., Reach, W. T., Kuchner, M. J., von Hippel, T., Burrows, A., & Winget, D. E. 2007, ApJS, 171, 206
- Munn et al. (2004) Munn, J. A., et al. 2004, AJ, 127, 3034
- Reach et al. (2005) Reach, W. T., et al. 2005, PASP, 117, 978
- Ruiz & Bergeron (2001) Ruiz, M. T., & Bergeron, P. 2001, ApJ, 558, 761
- Saumon & Jacobson (1999) Saumon, D. & Jacobson, S. B. 1999, ApJ, 511, 107
- Tremblay & Bergeron (2007) Tremblay, P.-E., & Bergeron, P. 2007, ApJ, 657, 1013
- Tremblay & Bergeron (2008) Tremblay, P.-E., & Bergeron, P. 2008, ApJ, 672, 1144
- von Hippel et al. (2007) von Hippel, T., Kuchner, M. J., Kilic, M., Mullally, F., & Reach, W. T. 2007, ApJ, 662, 544
- Winget et al. (1987) Winget, D. E., Hansen, C. J., Liebert, J., van Horn, H. M., Fontaine, G., Nather, R. E., Kepler, S. O., & Lamb, D. Q. 1987, ApJ, 315, L77
| Object | Name | 3.6m | 4.5m | 5.8m | 8.0m |
|---|---|---|---|---|---|
| (mJy) | (mJy) | (mJy) | (mJy) | ||
| WD 0011399 | J00143937 | 0.1186 0.0039 | 0.0798 0.0029 | 0.0597 0.0073 | 0.0330 0.0132 |
| WD 0029032 | LHS1093 | 0.2591 0.0085 | 0.1824 0.0067 | 0.1274 0.0264 | 0.0502 0.0193 |
| WD 0042337 | F35150 | 0.0613 0.0022 | 0.0426 0.0018 | 0.0283 0.0120 | 0.0216 0.0039 |
| WD 0048207 | LHS1158 | 0.2308 0.0081 | 0.1550 0.0057 | 0.0965 0.0088 | 0.0453 0.0018 |
| WD 0102+210.2 | LHS5024 | 0.1129 0.0036 | 0.0779 0.0028 | 0.0505 0.0103 | 0.0249 0.0241 |
| WD 0102+210.1 | LHS5023 | 0.1018 0.0033 | 0.0715 0.0026 | 0.0536 0.0104 | 0.0224 0.0161 |
| WD 0112018 | LHS1219 | 0.1383 0.0044 | 0.0908 0.0032 | 0.0598 0.0157 | 0.0324 0.0144 |
| WD 0117145 | LHS1233 | 0.3033 0.0098 | 0.2032 0.0071 | 0.1239 0.0223 | 0.1083 0.0266 |
| WD 0121+401 | G1338 | 0.2216 0.0074 | 0.1465 0.0055 | 0.0831 0.0098 | 0.0567 0.0102 |
| WD 0133548 | WD0135546 | 0.1044 0.0034 | 0.0686 0.0024 | 0.0457 0.0050 | 0.0263 0.0049 |
| WD 0202055 | WD0205053 | 0.1057 0.0035 | 0.0732 0.0033 | 0.0399 0.0078 | 0.0277 0.0066 |
| WD 0222+648a | LHS1405 | 0.1358 0.0352 | 0.0951 0.0244 | 0.0653 0.0159 | 0.0401 0.0100 |
| WD 0230144 | LHS1415 | 0.7045 0.0220 | 0.4654 0.0152 | 0.3185 0.0164 | 0.1754 0.0180 |
| WD 0357+081 | LHS1617 | 0.6134 0.0193 | 0.4106 0.0136 | 0.2526 0.0159 | 0.1416 0.0140 |
| WD 0407+197 | LHS1636 | 0.1354 0.0050 | 0.0815 0.0040 | 0.0504 0.0244 | 0.0376 0.0289 |
| WD 0423+044 | LHS1670 | 0.2655 0.0088 | 0.1789 0.0069 | 0.1185 0.0123 | 0.0785 0.0189 |
| WD 0503174 | LHS1734 | 0.5840 0.0187 | 0.3797 0.0125 | 0.2536 0.0164 | 0.1455 0.0142 |
| WD 0551+468a | LHS1801 | 0.2527 0.0089 | 0.1608 0.0068 | 0.0979 0.0134 | 0.0510 0.0205 |
| WD 0657+320 | LHS1889 | 0.4238 0.0135 | 0.2861 0.0097 | 0.1969 0.0140 | 0.1279 0.0169 |
| WD 0727+482ABb | G10770 | 2.5598 0.0782 | 1.7041 0.0525 | 1.1482 0.0395 | 0.6676 0.0256 |
| WD 0743340 | vB3 | 0.3585 0.0125 | 0.1044 0.0080 | ||
| WD 0747+073A | LHS239 | 0.3987 0.0127 | 0.2739 0.0094 | 0.1668 0.0141 | 0.1017 0.0202 |
| WD 0747+073B | LHS240 | 0.4552 0.0144 | 0.3085 0.0103 | 0.1990 0.0168 | 0.1048 0.0155 |
| SDSS J0753+4230 | J0753+4230 | 0.2028 0.0068 | 0.1427 0.0056 | 0.0963 0.0093 | 0.0565 0.0189 |
| WD 0851246a | CE51 | 0.1010 0.0066 | 0.0790 0.0064 | 0.0677 0.0164 | |
| WD 1022+009 | LHS282 | 0.0875 0.0029 | 0.0557 0.0023 | 0.0274 0.0093 | 0.0183 0.0126 |
| WD 1108+207 | LHS2364 | 0.1892 0.0067 | 0.1197 0.0055 | 0.0955 0.0133 | 0.0310 0.0346 |
| WD 1136286 | ESO43926 | 0.0144 0.0010 | 0.0077 0.0014 | 0.0186 0.0110 | 0.0031 0.0003 |
| WD 1153+135 | LHS2478 | 0.1631 0.0056 | 0.1050 0.0046 | 0.0800 0.0200 | 0.0559 0.0188 |
| WD 1247+550a | LP13166 | 0.2353 0.0082 | 0.1569 0.0060 | 0.1025 0.0111 | 0.0648 0.0106 |
| WD 1257+037 | LHS2661 | 0.5908 0.0187 | 0.3859 0.0126 | 0.2668 0.0163 | 0.1340 0.0161 |
| WD 1300+263 | LHS2673 | 0.0749 0.0026 | 0.0517 0.0023 | 0.0399 0.0061 | 0.0121 0.0103 |
| WD 1313198 | LHS2710 | 0.2037 0.0069 | 0.1336 0.0052 | 0.1003 0.0147 | 0.0722 0.0240 |
| SDSS J1313+0226 | J1313+0226 | 0.1327 0.0044 | 0.0901 0.0031 | 0.0615 0.0069 | 0.0379 0.0128 |
| WD 1334+039 | Wolf489 | 2.6091 0.0805 | 1.7405 0.0548 | 1.1851 0.0477 | 0.6677 0.0329 |
| WD 1345+238 | LP3805 | 1.1767 0.0363 | 0.7908 0.0248 | 0.5380 0.0226 | 0.3165 0.0185 |
| WD 1346+121 | LHS2808 | 0.1001 0.0035 | 0.0654 0.0043 | 0.0411 0.0125 | 0.0330 0.0036 |
| WD 1444174 | LHS378 | 0.4579 0.0146 | 0.3142 0.0106 | 0.2212 0.0174 | 0.1589 0.0162 |
| WD 1602+010 | LHS3151 | 0.1701 0.0058 | 0.1151 0.0047 | 0.0671 0.0114 | 0.0498 0.0164 |
| WD 1653+630 | LHS3250 | 0.0070 0.0017 | 0.0058 0.0023 | 0.0081 0.0049 | 0.0130 0.0064 |
| WD 1656062 | LP68632 | 0.1826 0.0069 | 0.1203 0.0055 | 0.0746 0.0186 | 0.0203 0.0156 |
| WD 1820+609 | G22728 | 1.0795 0.0333 | 0.7283 0.0229 | 0.4773 0.0198 | 0.2700 0.0201 |
| WD 2002110 | LHS483 | 0.3407 0.0115 | 0.2390 0.0090 | 0.1359 0.0157 | 0.0956 0.0205 |
| WD 2048+263 | G1878 | 0.9917 0.0307 | 0.6574 0.0208 | 0.4573 0.0206 | 0.2591 0.0146 |
| WD 2054050a | vB11 | 0.5335 0.0235 | 0.3487 0.0270 | 0.1060 0.0820 | 0.0778 0.0266 |
| SDSS J21160724 | J21160724 | 0.1442 0.0051 | 0.0991 0.0042 | 0.0735 0.0327 | 0.0532 0.0214 |
| WD 2248+293 | G1287 | 0.7773 0.0242 | 0.5090 0.0165 | 0.3545 0.0184 | 0.1781 0.0142 |
| WD 2251070 | LP70129 | 1.3402 0.0412 | 0.9103 0.0287 | 0.6108 0.0273 | 0.3791 0.0252 |
| WD 2316064 | LHS542 | 0.1237 0.0040 | 0.0799 0.0030 | 0.0596 0.0085 | 0.0283 0.0165 |
| WD 2343481 | WD2346478 | 0.1225 0.0039 | 0.0752 0.0028 | 0.0452 0.0052 | 0.0323 0.0116 |
| WD 2345447 | ESO29243 | 0.0948 0.0031 | 0.0627 0.0023 | 0.0431 0.0067 | 0.0319 0.0121 |
Note. — (a)- The photometry is likely to be affected by nearby bright star. (b)- WD 0727+482A and WD 0727+482B are unresolved in IRAC images. The photometry given here is the combined flux from both stars.
| Object | Spectral | Comp | g | He/H | |
|---|---|---|---|---|---|
| Type | (K) | ||||
| WD 0011399 | DC | H | 4700 | 8 | |
| WD 0029032 | DC | He/H | 4590 | 7.96 | 0.3 |
| WD 0042337 | DC | H | 4040 | 8 | |
| WD 0048207 | DA | H | 5190 | 8 | |
| WD 0102+210.2 | DC | H | 4910 | 8 | |
| WD 0102+210.1 | DA | H | 5320 | 8 | |
| WD 0112018 | DA | H | 5410 | 8 | |
| WD 0117145 | DA | H | 5070 | 7.75 | |
| WD 0121+401 | DA | H | 5330 | 7.94 | |
| WD 0133548 | DC | He/H | 4660 | 8 | 0.2 |
| WD 0202055 | DC | H | 4150 | 8 | |
| WD 0230144 | DA | H | 5470 | 8.15 | |
| WD 0357+081 | DA | H | 5490 | 8.07 | |
| WD 0407+197 | DC | H | 5250 | 8 | |
| WD 0423+044 | DA | H | 4950 | 8 | |
| WD 0503174 | DA | H | 5410 | 7.72 | |
| WD 0657+320 | DA | H | 4930 | 8.09 | |
| WD 0743340 | DC | H | 4630 | 8.15 | |
| WD 0747+073A | DA | H | 4500 | 7.97 | |
| WD 0747+073B | DC | He/H | 4700 | 7.97 | 0.8 |
| SDSS J0753+4230 | DC | He/H | 4540 | 8 | 0.7 |
| WD 1022+009 | DA | H | 5400 | 7.65 | |
| WD 1108+207 | DC | H | 4760 | 8.18 | |
| WD 1136286 | DC | H | 4630 | 9.12 | |
| WD 1153+135 | DC | He/H | 4830 | 8 | 0.3 |
| WD 1257+037 | DA | H | 5640 | 8.22 | |
| WD 1300+263 | DC | H | 4360 | 8.16 | |
| WD 1313198 | DC | He/H | 5110 | 8.24 | 1.7 |
| SDSS J1313+0226 | DC | H | 4230 | 8 | |
| WD 1334+039 | DA | H | 5030 | 8.01 | |
| WD 1345+238 | DA | H | 4690 | 7.91 | |
| WD 1346+121 | DC | He/H | 4710 | 8 | 0.9 |
| WD 1444174 | DC | He/H | 4820 | 8.31 | 0.7 |
| WD 1602+010 | DC | H | 4880 | 8 | |
| WD 1656062 | DA | H | 5550 | 8.09 | |
| WD 1820+609 | DA | H | 4900 | 7.97 | |
| WD 2002110 | DC | He/H | 4640 | 8.23 | 0.3 |
| WD 2048+263 | DA | H | 5110 | 7.65 | |
| SDSS J21160724 | DC | He/H | 4650 | 8 | 0.3 |
| WD 2248+293 | DA | H | 5650 | 7.65 | |
| WD 2251070 | DZ | He | 4790 | Blackbody | |
| WD 2316064 | DC | H | 4700 | 8.18 | |
| WD 2343481 | DA | H | 5130 | 8 | |
| WD 2345447 | DC | He/H | 5330 | 8.70 | 2.0 |
| pure H | pure H | Best-fit | Best-fit | |
|---|---|---|---|---|
| Filter | Mean | Wt-Mean | Mean | Wt-Mean |
| B | ||||
| V | ||||
| R | ||||
| I | ||||
| J | ||||
| H | ||||
| K | ||||
| IRAC1 | ||||
| IRAC2 | ||||
| IRAC3 | ||||
| IRAC4 |