Quiescent Isolation: The Extremely Extended HI Halo of the Optically Compact Dwarf Galaxy ADBS 113845+2008
Abstract
We present new optical imaging and spectroscopy and H i spectral line imaging of the dwarf galaxy ADBS 1138452008 (hereafter ADBS 1138). This metal-poor (Z 30% Z⊙), “post-starburst” system has one of the most compact stellar distributions known in any galaxy to date (B-band exponential scale length 0.57 kpc). In stark contrast to the compact stellar component, the neutral gas is extremely extended; H i is detected to a radial distance of 25 kpc at the 1019 cm-2 level (44 B-band scale lengths). Comparing to measurements of similar “giant disk” dwarf galaxies in the literature, ADBS 1138 has the largest known H i-to-optical size ratio. The stellar component is located near the center of a broken ring of H i that is 15 kpc in diameter; column densities peak in this structure at the 3.5 1020 cm-2 level. At the center of this ring, in a region of comparatively low H i column density, we find ongoing star formation traced by H emission. We sample the rotation curve to the point of turn over; this constrains the size of the dark matter halo of the galaxy, which outweighs the luminous component (stars gas) by at least a factor of 15. To explain these enigmatic properties, we examine “inside-out” and “outside-in” evolutionary scenarios. Calculations of star formation energetics indicate that “feedback” from concentrated star formation is not capable of producing the ring structure; we posit that this is a system where the large H i disk is evolving in quiescent isolation. In a global sense, this system is exceedingly inefficient at converting neutral gas into stars.
Subject headings:
galaxies: dwarf — galaxies: ISM — galaxies: starburst — galaxies: individual (ADBS 1138452008)1. Introduction
Blue compact dwarf (BCD) galaxies are intrinsically faint, (e.g., M17) compact (optical radii of a few kpc or smaller) systems that are undergoing strongly concentrated active star formation. Their interstellar media typically produce strong nebular emission lines that suggest sub-solar abundances, as is common for low-mass galaxies in a general sense (e.g., Skillman et al., 1989; Salzer et al., 2005; Lee et al., 2006). The active star formation regions are typically superposed on an underlying, lower-surface brightness red stellar population. Thus, as expected, BCDs have higher central surface brightnesses than do more quiescent dwarf irregular (dIrr) galaxies. Further, the underlying stellar populations in BCDs are also more compact than those in dIrr’s (Salzer & Norton, 1999), the optical disk scale lengths being systematically shorter.
As expected from their elevated star formation rates, most BCDs contain plentiful neutral gas. When compared with more quiescent dIrr galaxies of similar luminosity, BCDs typically have H i masses that are roughly twice as large (Salzer et al., 2002). Like the stellar component, this H i gas is in general more centrally concentrated than in the dIrr population. The H i distributions are often strongly peaked at or near the location of the starburst region (van Zee et al., 1998).
These properties suggest that BCDs are simply small galaxies with centrally-concentrated mass distributions. Thus, the growing number of low-mass galaxies with extended H i disks (e.g., Carignan & Freeman, 1988; Bajaja et al., 1994; Young & Lo, 1996; Hunter et al., 1998; van Zee, 2004; Warren et al., 2004; Begum et al., 2005) might be simplistically interpreted as a collection of relatively quiescent dIrr systems where the mass is more evenly distributed throughout the disk than in BCDs. Likewise, a centrally-concentrated H i or stellar distribution might be the signpost of a BCD.
Strong departures from this simple paradigm would be found in star forming galaxies that have extreme stellar and gaseous properties: the compact stellar bodies typical of BCDs and the extended H i gas disks typical of more quiescent irregular galaxies. While examples of BCDs with large H i envelopes exist (e.g., NGC 2915; Meurer et al. 1994, 1996), we do not yet have sufficient statistics on the resolved characteristics of the gaseous components of BCD systems to determine if such remarkable properties are common or rare. Further, few systems with extremely compact stellar populations (optical scale lengths 1 kpc) have been identified to date; such stellar distributions are exceptional even among the BCD class.
To explore this uncharted territory, we present in this work new optical and H i spectral line observations of ADBS1138452008 (hereafter ADBS 1138), an extremely compact BCD surrounded by an enormous H i disk. Initially discovered in the Arecibo Dual Beam Survey (ADBS) (Rosenberg & Schneider, 2000, 2002), it was subsequently cataloged as a UV-excess source in the 2nd KISO survey (Miyauchi-Isobe & Maehara, 2000). Its extremely compact nature was first recognized during a CCD imaging study of the ADBS galaxies (see section 2.1), which motivated us to carry out the more detailed study of this interesting system presented here. In addition to describing our new optical and radio data, this paper discusses the morphology and kinematics of the neutral gas, the nature of the H i ring and central depression, and different scenarios that may produce the curious features of the ISM in ADBS 1138.
2. Observations and Data Reduction
2.1. Optical Imaging and Spectroscopy

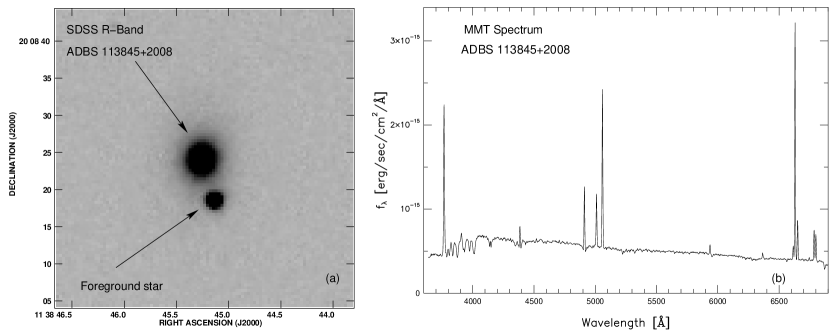
Optical imaging of ADBS 1138 through B, V and R filters was carried out using the WIYN 0.9-meter telescope111The WIYN 0.9-meter telescope is operated jointly by a consortium that includes the University of Florida, Indiana University, San Francisco State University, Wesleyan University, University of Wisconsin-Madison, University of Wisconsin-Oshkosh, University of Wisconsin-Stevens Point, and University of Wisconsin-Whitewater located on Kitt Peak. The data were obtained on 5 May 2003 as part of a larger program to study the optical properties of the full ADBS sample (Stevenson et al., in preparation). The exceptionally compact nature of this system was evident immediately. In fact, in our initial analysis of the CCD images we didn’t recognize ADBS 1138 as a galaxy at all, but rather took it to be a foreground star. Only after manipulating the image intensity and measuring the FWHM of several objects did we identify it as a galaxy. Figure 1(a), obtained from the Sloan Digital Sky Survey (Adelman et al., 2008), shows the immediate field surrounding the galaxy; note that it is only slightly more extended than the nearby foreground star to the southwest.
The measured B-band apparent magnitude of ADBS 1138 is 16.51. Assuming a distance of 42.1 Mpc (H0 = 73 km s-1 Mpc-1), the absolute magnitude of ADBS 1138 (corrected for foreground extinction of 0.097 mag) is MB 16.71. This corresponds to LB = 7.44 108 L⊙ (assuming M5.47; see Cox 2000). The system has a B-band exponential scale length of only 0.57 kpc (see Figure 2). This can be compared to a typical scale length of 1.54 0.22 kpc for other dwarfs in the ADBS sample with similar luminosities. Examination of both our WIYN 0.9-meter images and the SDSS data reveal a compact, featureless morphology. Furthermore, the galaxy appears to be quite isolated; no optical or H i-rich objects with a comparable redshift are located within 16′ of ADBS 1138 (half of the H i primary beam at 21 cm; see Section 2.2), corresponding to 195 kpc at the adopted distance.
We also obtained H narrow-band imaging with the WIYN 0.9-m telescope on 2 April 2005. The H emission from ADBS 1138 comes solely from the compact core of the galaxy, and is unresolved in our images. The measured flux derived from our image is 2.98 10-14 erg s-1 cm-2. After applying modest corrections for foreground Galactic extinction (A 0.06 mag, Schlegel et al. 1998), internal absorption in the galaxy, and [N II] nebular emission present in our narrow-band filter, we arrive at a corrected H flux of 3.65 10-14 erg s-1 cm-2. At our adopted distance this corrected flux corresponds to a luminosity of 7.75 1039 erg s-1. Applying the conversion to SFR from Kennicutt (1998), ADBS 1138 has a current SFR of 0.06 M⊙ yr-1.
Optical spectroscopy of ADBS 1138 was obtained with the MMT 6.5 m telescope on 5 February 2006222The MMT Observatory is a joint facility of the Smithsonian Institution and the University of Arizona using the Blue Channel Spectrograph and a 300 l/mm grating. A slit width of 1.5″ was employed, and the total integration time was 30 minutes, split between two exposures. Data processing followed standard practices; the wavelength scale was assigned using exposures of a HeNeAr lamp, and the flux scale was obtained by measurement of several spectrophotometric standard stars. The resulting spectrum, shown in Figure 1(b), allows us to estimate the nebular abundance of ADBS 1138 to be 30% Z⊙, using the “strong-line” method of Salzer et al. (2005). We measure an optical recession velocity of 3076 14 km s-1. H and [O III] emission lines are prominent; the spectrum also reveals Ca II K, Mg b, and Na D absorption features, and considerable absorption in the higher-order Balmer series transitions. Taken together, these features indicate the presence of a substantial population of older stars (e.g., Worthey & Ottaviani, 1997) and imply a higher SFR in the past than at the present epoch (i.e., that the system is in a “post-starburst” state). This important clue is discussed further in the sections that follow. We summarize salient properties of ADBS 1138 in Table 1.
| Property | Value | Reference |
|---|---|---|
| VHI (km s-1) | 3074 1 | This work |
| Vopt (km s-1) | 3076 14 | This work |
| Distance (Mpc)aaAssumes H0 = 73 km s-1 Mpc-1. | 42.1 4 | This work |
| MB | 16.71 | This work |
| (BV) | 0.59 0.13 | This work |
| Gal. Lat. (∘) | 72.0 | |
| Foreground E(BV) | 0.022 | Schlegel et al. (1998) |
| 12 log(O/H) | 8.3 0.3 | This work |
| Current SFR (M⊙ yr-1) | 0.06 | This work |
| H i Mass (109 M⊙) | 1.08 0.1 | This work |
| Dynamical MassbbMeasured at the last reliable point of the rotation curve. (1010 M⊙) | 3.8 0.8 | This work |
2.2. H i Spectral Line Imaging
The Very Large Array (VLA333The National Radio Astronomy Observatory is a facility of the National Science Foundation operated under cooperative agreement by Associated Universities, Inc.) was used to obtain H i spectral line data for ADBS 1138 as part of observing program AC 841. Observations were obtained in the C and D arrays on 2006 October 31 and 2007 March 30, respectively; integration times were 243 and 87 minutes for the target source during these two observing sessions. A total bandwidth of 1.56 MHz was used, with 128 channels separated by 12.2 kHz (2.58 km s-1). The data were reduced and calibrated using standard methods in the AIPS environment; analysis was performed using the AIPS, Miriad and GIPSY packages.
Two H i datacubes are created and analyzed after off-line Hanning smoothing to a velocity resolution of 5.2 km s-1. The “low-resolution” cube was created with natural weighting (ROBUST=5 in the AIPS IMAGR task) and then convolved to a circular beam size of 40″. The “high-resolution” cube was created with robust weighting (ROBUST=0.5) and then convolved to a circular beam size of 20″. The rms noise in the final cubes are 0.35 and 0.29 mJy Bm-1 for the natural and robust-weighted cubes, respectively. Following Jorsater & van Moorsel (1995) and Walter & Brinks (1999), we explicitly correct for the difference in areas between the the clean and dirty beams, resulting in accurate H i flux calibration of our interferometric data.
We create moment maps of the integrated H i emission and velocity structure using an approach similar to that advocated by Walter et al. (1997). First, the “low-resolution” cube was blanked at the 2 level. Channels containing line emission were then inspected individually, and we differentiate real from spurious emission by requiring structures to be present in 3 or more consecutive channels. This edited cube is then used to blank both the “low-” and “high-resolution” cubes, assuring that the same regions contribute to both final moment maps. The images of integrated H i emission, discussed in detail in § 3, probe column densities of 1019 cm-2.
During the reduction of the H i spectral line data, we averaged 19 line-free channels to produce a 1.4 GHz radio continuum image. This image has a beam size of 31″ 25″ and an RMS noise level of 0.27 mJy Bm-1. The 5 upper limit to the 1.4 GHz radio continuum flux density is derived to be S1.3 mJy. This is consistent with the NVSS non-detection (Condon et al., 1998). The expected thermal radio continuum flux density, based on the (foreground extinction-corrected) H flux, is between 0.04–0.06 mJy (depending on the adopted electron temperature; see Caplan & Deharveng 1986). Thus, even if nonthermal processes dominate the radio continuum flux, it is below our current sensitivity level to study in detail.
3. H i Emission in ADBS 113845+2008
3.1. H i Distribution
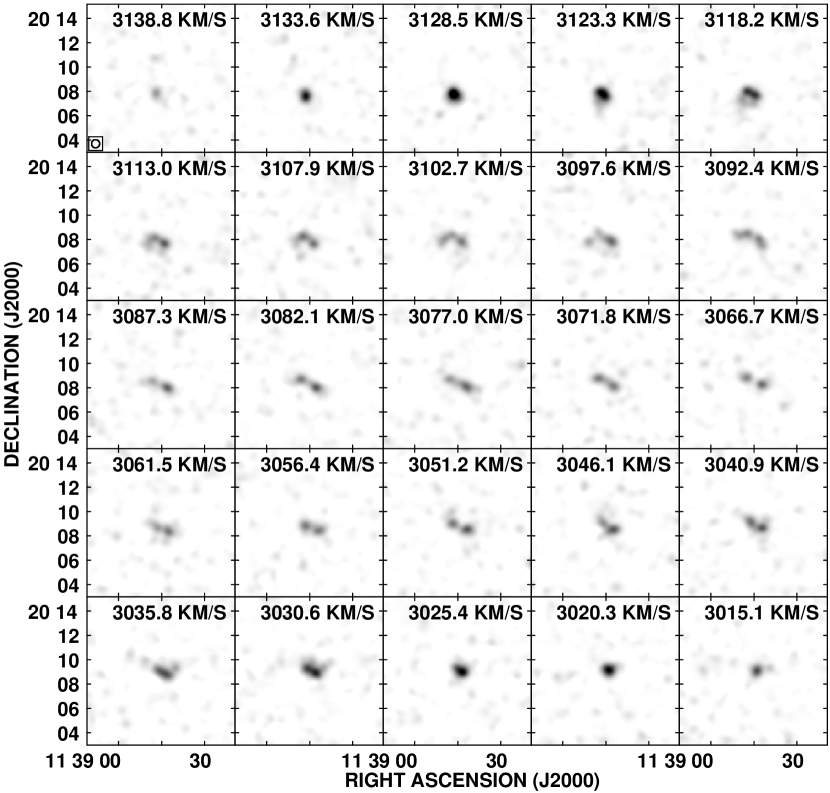
H i in ADBS 1138 is detected over the (Heliocentric) velocity range 30103140 km s-1; Figure 3 shows channel maps of H i emission in the central 25 channels of the cube. From these maps it is clear that the profile is double-peaked; this is verified when all emission defined as real (i.e., all emission contributing to the moment maps) is summed and plotted against velocity in the global H i profile shown in Figure 4. From this profile and rotation curve analysis (see below), we derive a systemic velocity of V 3074 1 km s-1 which is in excellent agreement with the measured optical velocity (see § 2.1).
Integrating under the H i profile, we derive a total H i flux S 2.58 0.26 Jy km s-1. This can be compared to the lower value of 1.98 Jy km s-1 derived from Arecibo observations for the ADBS (Rosenberg & Schneider, 2000). This discrepancy is easily explained as the H i source passing off the center of the Arecibo beam during the drift scan observations. The slightly lower systemic and optical velocities derived here (3074 and 3076 km s-1, respectively) compared to the value from the ADBS (3105 km s-1) agrees with this interpretation. Note that such disagreement between single-dish and interferometric observations were common in the ADBS sample; of the 31 galaxies observed by Rosenberg & Schneider (2000) with both the VLA and Arecibo, 85% have higher interferometric than single-dish H i fluxes. At the adopted distance of 42.1 Mpc, this flux integral translates to a total H i mass of (1.08 0.22) 109 M⊙. Combining with the B-band luminosity (7.44 108 L⊙) implies MH/LB 1.45.

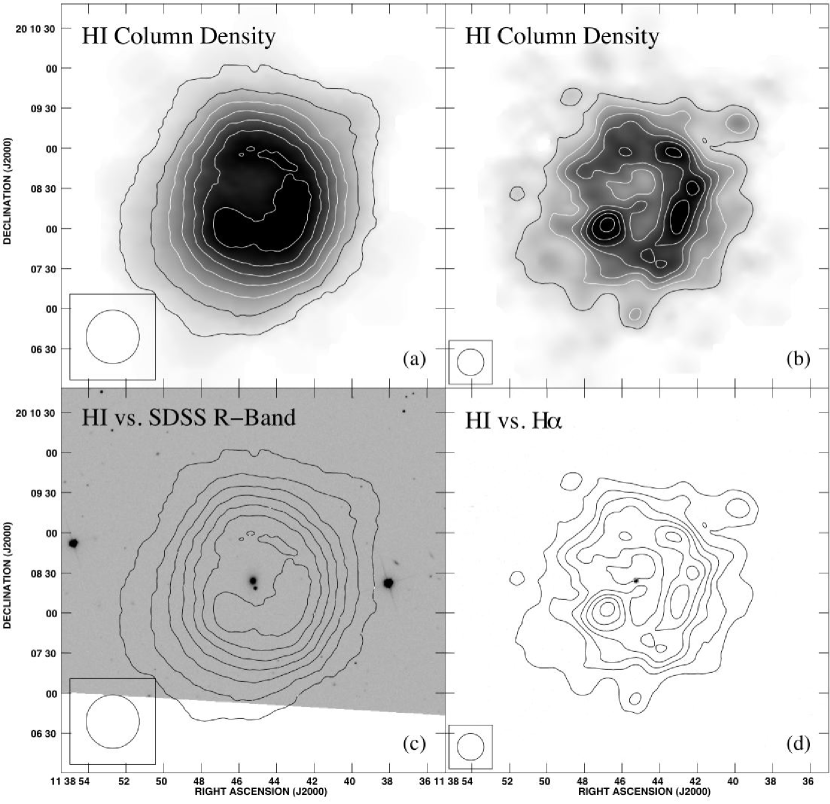
In Figure 5 we compare SDSS r-band and WIYN 0.9-m H emission-line images of ADBS 1138 to H i moment 0 images at “low-” (40″ beam) and “high-resolution” (20″ beam). It is immediately striking that neutral gas extends 125″ (25 kpc) from the optical component. Comparing to the B-band scale length (0.57 kpc), the H i disk is 44 times larger than the B-band exponential scale length.
Comparing to other “giant disk” dwarf galaxies in the literature, we conclude that ADBS 1138 is among the most extended H i systems known. Due to the very compact nature of ADBS 1138, and to potential contamination of a surface brightness estimate (e.g., when measuring the Holmberg radius) due to the bright foreground star in the southwest (see Figure 1), we choose for this comparison the ratio of H i size at the 1019 cm-2 level to the B-band exponential scale length. We denote this parameter as (H i/B); as shown in Table 2, other “giant disk” dwarf galaxies have similar, but slightly smaller values of this parameter. Each of these systems shows extreme properties when comparing the stellar and gaseous components.
The optical scale length of ADBS 1138 does not vary appreciably with wavelength in the SDSS bands (see also Figure 2. This suggests that we are likely observing the entire stellar component at these wavelengths. If the galaxy harbors an extended, low-surface brightness disk, then this component must have a surface brightness well below the sensitivity of our optical images (26.0, 25.5 mag arcsec-2 in the B and V bands, respectively). As a point of reference we note that deep optical imaging of 27 compact emission-line galaxies (which are a class of objects that are brighter than ADBS 1138) by Barton et al. (2006) finds extended, low surface brightness emission in only 1 case.
The highest column density gas in ADBS 1138 is located in a broken ring structure that is significantly beyond the optical component. Moving outward from the dynamical center (which corresponds closely with the stellar component; see detailed discussion in § 3.2), Figure 6 shows that the H i surface brightness peaks at a radius of 40″ (8 kpc). The H i surface brightness falls by nearly 50% moving inward toward the optical component. Therefore, the shell is 15 kpc in diameter, making it one of the largest such features known in any dwarf galaxy. The mass of gas in the H i ring, integrated radially from 5 to 12 kpc, is (5.20.6) 108 M⊙. Thus, this structure accounts for roughly half of the total H i mass in ADBS 1138.
Equally remarkable is the modest strength of the integrated H i emission. Examining the “high-resolution” column density map in Figure 5, H i column densities peak at values of 3.8 1020 cm-2 and fall below 2 1020 cm-2 at the location of the optical component of the galaxy. A number of authors have demonstrated a correlation between H i column density and ongoing star formation; the canonical “Schmidt star formation law” suggests that H i columns of 1021 cm-2 are strongly correlated with instantaneous star formation tracers, including H (see Skillman 1987, Kennicutt 1989, 1998b, and references therein).
The H image in Figure 5 shows that ADBS 1138 has spatially concentrated ongoing star formation (0.06 M⊙ yr-1). H emission is associated with recent massive star formation (i.e., stars with masses 10 M⊙ and main sequence lifetimes 20 Myr; see Kennicutt 1998a). However, at the physical resolutions of our H i data, we find star formation only in the central, low-column density region. We discuss the constraints our data offer on this puzzle in § 4.
3.2. H i Kinematics
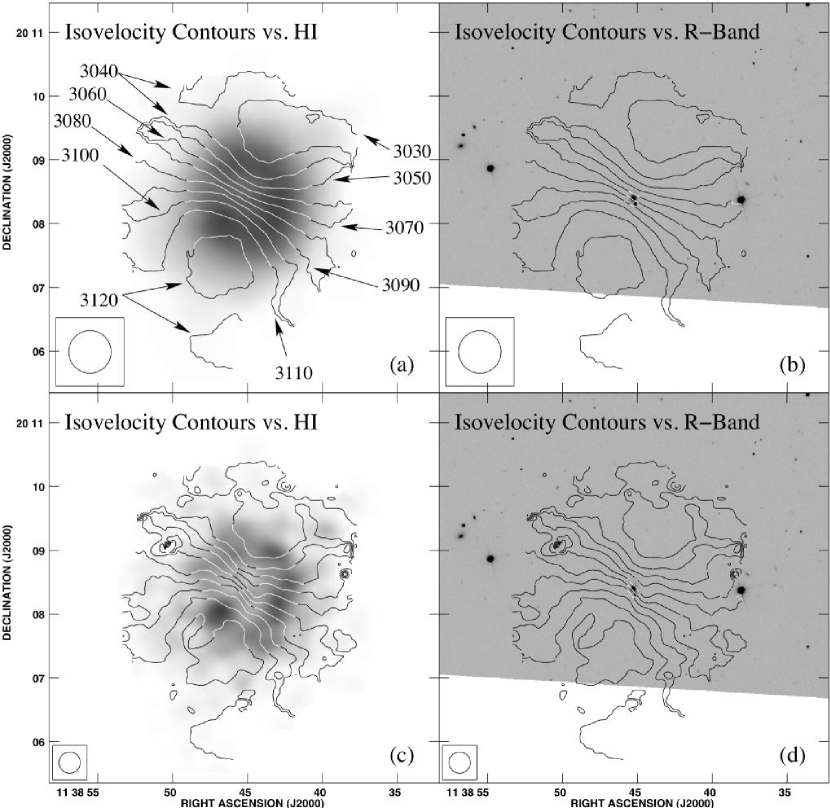
In Figure 7 we present the velocity structure of the ADBS 1138 system at 20″ and 40″ resolution. A general inspection shows that the system is undergoing well-ordered rotation throughout most of the inner disk (but note that the slope of the curve changes at our physical resolutions in the inner regions of the galaxy). Isovelocity contours appear evenly spaced and are mostly regular along the H i minor axis.
We fit this velocity field using tilted ring models via the ROTCUR task in GIPSY. While the size of the galaxy compared to our smaller beam size (20″) does not lend itself to detailed rotation curve analysis with large numbers of independent points, we can extract a clean first-order measurement of the large-scale kinematics of the neutral gas. ROTCUR fits the systemic velocity (Vsys), rotation velocity, position angle (P.A., measured as positive when rotating eastward from north), inclination i, and dynamical center position, each as a function of radius, to an observed velocity field.
We began by fitting the inclination of the galaxy. As is apparent from Figure 5, the inclination of the galaxy is small. It is well-known that an accurate measurement of i in face-on galaxies is difficult (Walter & Brinks, 2001). Initial ROTCUR fits to all parameters estimated i between 10∘ and 40∘, depending on the initial coordinates of the dynamical center position. We constrained the angle by forcing the fitted rotation velocities (proportional to sin(i)) to reach maxima commensurate with the observed velocity field. This narrowed the allowable range of inclinations to 28∘–32∘; we fixed i at 30∘ for the remainder of our analysis.
We then began fitting individual parameters of the rotation curve using annuli of different widths (5″, 10″, 20″). While the former two analyses do not provide independent points, they do allow us to gauge the observed small-scale changes in parameters that affect our analysis. We compare values for a given parameter using the fitted models at each resolution, and select a “best-fit” value that is consistent with all three fits. In most cases, the differences from one model to the next were negligible. Vsys (3074 1 km s-1) and the dynamical center position (11:38:45.3, 20:08:26.5) were fit individually using this approach, and then held constant at all radii in subsequent model fits. The P.A., which is allowed to vary as a function of radius, was then fit with all other parameters held constant. Once values were obtained for each parameter, a final rotation curve was derived with all of the above variables held constant and rotation velocity (only) allowed to vary.
| Galaxy | (H i/B)aaDefined as the ratio of H I size at the 1019 cm-2 level to the B-band exponential scale length. | Reference |
|---|---|---|
| DDO 154 | 21 | Carignan & Beaulieu (1989), Carignan & Purton (1998) |
| NGC 2915 | 23bbFrom Meurer et al. (1996), quoted as the ratio of H I size at the 5 1019 cm-2 level to the B-band exponential scale length. | Meurer et al. (1996) |
| UGC 5288 | 27 | van Zee (2004) |
| NGC 3741 | 39 | Bremnes et al. (2000), Begum et al. (2005) |
| ADBS 1138452008 | 44 | This work |
The derived rotation curves are presented in Figure 8. There we show two curves, derived using annuli of 10″ and 20″, respectively. We stress that only the lower resolution points are completely independent (i.e., separated by a full beam width). The 10″ curves agree with the 20″ curves at all radii and provide an indication of the rotation properties at radii 4 kpc. Note that we show curves derived for the receding and the approaching sides individually, and the curve derived by averaging the two sides together. No significant differences were found in the rotation curves of the two halves of the galaxy. We discuss the implications of the derived rotation curves in § 3.3.
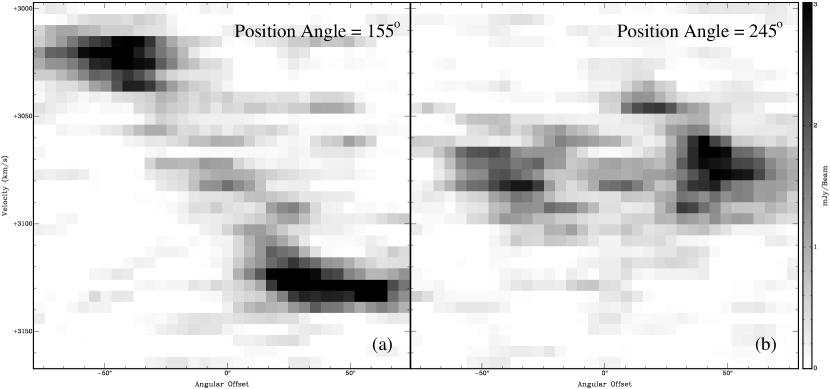
Inspecting the H i moment zero images in Figure 5, it is tempting to interpret the ring-like distribution of neutral gas as an expanding shell. To explore this possibility, we use the KARMA visualization package to examine position-velocity and radius-velocity diagrams of the H i in ADBS 1138. Examining the kinematic information in the radius-velocity plane has the advantage of integrating radially across a putative shell structure in a datacube. If a perfectly symmetric, expanding shell were present in a given datacube, one would see half of an ellipse in radius-velocity space. If this radial integration does not include a coherent, expanding structure, then one will have H i emission at a continuous range of velocities as a function of radius (i.e., the “ellipse” will be closed).
From Figures 5 and 6 it is obvious that a broken, roughly spherical structure exists in the ISM of ADBS 1138 at a distance of 7.5 kpc from the dynamical center. However, our kinematic analysis of this structure does not show the unambiguous signs of expansion. A major-axis (position angle 155∘, measured East of North) position-velocity diagram (see Figure 9) does show the H i column density enhancement at this radius, with mostly coherent H i gas at intermediate radii. Similarly, a minor-axis (position angle 245∘) position-velocity cut (see also Figure 9) shows higher columns at the same radius, with gas at roughly the same velocity from one side of the galaxy to the other (as expected, based on the well-behaved velocity field in the inner regions of the galaxy; see Figure 7). Radius-velocity diagrams do not show the characteristic elliptical structure that would be expected if the H i ring was in fact expanding along the line of sight. We note that this galaxy is observed at a small inclination (i was fixed at 30∘ in the rotation curve analysis above); for nearly face-on galaxies there might be structures that are expanding in the disk (perpendicular to the line of sight) but whose mass outflow perpendicular to the disk is small (hence undetectable).


3.3. Dark Matter in ADBS 113845+2008
The rotation curves in Figure 8 show ordered rotation in the central regions. This behavior continues out to a radius of 50″ (10 kpc), at which point there is a pronounced change to differential rotation at larger radii. Using these curves it is straightforward to estimate the dynamical mass of the system. Assuming the rotational velocities shown are for neutral gas on circular orbits, we find that the dynamical mass included within 50″ (10 kpc; Vrot 100 km s-1) is 2.3 1010 M⊙. At the last measured point of the rotation curve (r 100″ 20 kpc, Vrot 90 km s-1) the dynamical mass increases to 3.8 1010 M⊙. We estimate the uncertainties on these dynamical mass values to be 20%.
As derived in § 3.1, the total H i gas mass is (1.08 0.22) 109 M⊙. Accounting for primordial Helium increases the neutral gas mass to (1.46 0.30) 109 M⊙. Due to the metal-poor nature of the ISM in ADBS 1138, and the known problems of measuring molecular gas masses in such conditions, we make no explicit correction for such material and consider the H i He to constitute all of the cool gas in ADBS 1138.
A stellar mass estimate is needed to calculate the total luminous mass and to infer the ratio of dark to luminous matter. Using our WIYN 0.9-m photometry (MB = 16.71, MV = 17.30, MR = 17.67, after foreground extinction corrections) and the models presented in Bell & de Jong (2001), we can infer stellar mass-to-light ratios for a range of galaxy and stellar population characteristics. Unfortunately we do not have infrared imaging of ADBS 1138 that would extend the color baseline and reduce scatter due to differential extinction and recent star formation (see the discussion in Bell & de Jong 2001 and application in Lee et al. 2006). As such, we stress that our stellar mass is only roughly constrained at this time.
We estimate the stellar mass of ADBS 1138 as follows. First, the extinction corrected colors and luminosities are calculated: (BR) 0.96; (BV) 0.59; LV 7.02 108 L⊙; LR 6.03 108 L⊙. Next, we calculate the stellar mass-to-light ratio and the stellar mass for multiple metal-poor model sets in Bell & de Jong (2001). Averaging these results for each of the (BR) and (BV) colors, and using the dispersion among them as an indicator of uncertainty, we approximate the stellar mass of ADBS 1138 to be (9.9 5.0) 108 M⊙ [using the (BR) colors] and (1.4 0.7) 109 M⊙ [using the (BV) colors]. Since the (BR) color baseline is larger (see above), we adopt a stellar mass of (1 0.5) 109 M⊙ for ADBS 1138. Repeating this procedure with colors derived from SDSS photometry, we find excellent agreement with this value (well within the errorbars).
Combining our total gas mass measurement (see above) and this (coarse) stellar mass estimate, we find that the dynamical mass exceeds the luminous mass by a factor of 9 (at a radius of 10 kpc) to 15 (at the last measured point of the rotation curve). Like many dwarf galaxies, ADBS 1138 is a dark matter dominated system. We apparently have sampled the turn-over of the outer rotation curve (see Figure 8); this suggests that we have measured the bulk of the galaxy’s dark matter halo.
4. The Recent Evolution of ADBS 113845+2008
ADBS 1138 presents intriguing problems: 1) How can star formation proceed at the current time in regions far below the “canonical” star formation threshold column density of 1021 cm-2? 2) What gives rise to a giant ordered disk that only forms stars in the very central region? In this section we discuss two potential evolutionary scenarios for this system. In the first we consider “inside-out” processes: here we assume that the structures we observe in the neutral gas disk are a result of star formation processes. In the second we consider “outside-in” scenarios, where we assume that the large H i disk has been stable for a significant fraction of a Hubble time, and that the recent star formation we observe is a result of small-scale stochastic effects that caused the neutral gas to attain critical density only in the very innermost regions.
4.1. “The Inside-Out Evolutionary Scenario”
We first consider the “inside-out” scenario wherein the ring-like H i distribution is the result of “feedback” from recent star formation. If a recent star formation episode was sufficiently energetic, one might expect the mechanical luminosity from stellar winds and SNe to be driving H i away from the stellar component. Numerous nearby dwarf galaxies have interstellar media displaying such kinematic structures (e.g., Puche et al. 1992, Kim et al. 1999, Walter & Brinks 1999, Ott et al. 2001, and references therein).
The depressed column densities around the optical component (compared to “canonical” expectations based on the ongoing star formation; see references above), coupled with the apparent “post-starburst” nature of the galaxy, make this scenario appealing. The compact stellar component implies that all mechanical energy input from previous bursts would be highly concentrated spatially; ADBS 1138 appears to possess the necessary conditions for the creation of a large H i shell in a low mass galaxy. Here, we can exploit the kinematic information available in our spectral line data to discern if the neutral gas is in fact being driven outward from the galaxy.
It would be instructive to consider the energetics necessary to create such a coherent structure in the ISM. Ideally we would have the signature of expansion of the ring; using this velocity and the observed size of the structure one can obtain a first-order estimate of the requisite energy and age from basic first principles. However, in the case of ADBS 1138, we do not detect expansion and thus have no such estimate of the velocity; this relegates us to a first-order estimate of the ring energetics. We begin by assuming that the extended H i envelope of ADBS 1138 existed with more or less its current physical size at the beginning of a putative (presumably violent) starburst episode that was concentrated in the central region (coincident with the optical component). The low column densities throughout the extended disk are not unlike those found in the outer disks of nearby dwarf galaxies with extended H i envelopes (Hunter et al., 1998). We then assume that the mass of gas in the ring was distributed uniformly throughout the central region of the galaxy, presumably providing plentiful neutral gas that gave rise to the starburst event inferred from the spectrum shown in Figure 1.
As shown in § 3.1, the mass of gas in the H i ring is (5.20.6) 108 M⊙. Assuming a symmetric potential interior to and inclusive of the ring, this mass has a potential energy of 1054 erg at the present time. For this gas to be moved radially outward a distance of 7.5 kpc as a result of spatially and temporally concentrated star formation, the kinetic energy inputs of some thousands of SNe would be required. Given a characteristic starburst duration of 100 Myr (Cannon et al., 2003; Weisz et al., 2008; Mc Quinn et al., 2009), a constant-velocity expansion rate of 70 km s-1 is inferred; a longer-duration burst would decrease the constant expansion velocity.
It is interesting to note that expanding shells in other galaxies have been found that require energies of roughly the same order as those inferred here (e.g., Ott et al., 2001). However, this interpretation is seriously weakened by the lack of observed expansion in the ring itself. Of course it is possible that the kinetic energy of the once-expanding ring has been expended, that pressure equilibrium with the surrounding ISM has been reached, and that the expansion has stopped. Without a definitive measurement of expansion we must estimate the total mechanical energy input from previous star formation and subsequent stellar evolution. Coupled with the enormous size of the ring compared to the stellar component, we conclude that the ring structure in ADBS 1138 was most likely not created by concentrated star formation alone.
We again draw attention to the size of the ring structure; the radius of 7.5 kpc greatly exceeds the physical sizes of some of the largest H i structures that have been attributed to stellar evolution processes (e.g., NGC 6822 - de Blok & Walter 2000; Holmberg I - Ott et al. 2001). Examples of “ring-like” galaxies have been identified in the literature, either on the basis of a visually-obvious depression and surrounding ring of higher column densities (e.g., Simpson et al. 2005) or on the basis of radially-integrated H i surface density profiles (e.g., Walter et al. 2007). Centrally-concentrated star formation is argued to produce the observed structures in some of these galaxies, even in cases where no expansion is detected. Thus, what makes ADBS 1138 remarkable is not the rarity of ring structures in dwarf galaxies, but rather the comparative sizes of the optical and gaseous components. We stress that the optical component of ADBS 1138 (measured by the B-band exponential scale length) is more than 40 times smaller than the extended H i halo (measured as the average radius at which the column density falls to the 1019 cm-2 level). Ongoing star formation is detected only in the compact optical component.
4.2. “Outside-In” Evolutionary Scenario
The shortcomings noted above lead us to consider an alternative, “outside-in” scenario for the recent evolution of ADBS 1138. We postulate that the extended, relatively tenuous (i.e., low column density) H i disk has remained stable for essentially a Hubble time, with star formation occurring only in very localized regions. In most respects the H i disk in ADBS 1138 is like the H i disks typically associated with low-mass galaxies: coherent and ordered rotation, with sub-critical column densities throughout most of the disk. Few locations within this extended neutral gas halo have attained the requisite gas densities to initiate star formation; at present, the only such location is the very innermost region of the disk. Given the very compact stellar component in the optical bands, it follows that star formation has likely been concentrated in this very inner region over the lifetime of the galaxy.
However, at this physical resolution, we do not detect high column density H i gas at the location of the optical component (though molecular gas may be present; see discussion below). We thus postulate that localized star formation has been efficient at depleting the neutral gas in this central region. Whatever H i gas that gave rise to the present (and past) star formation at this location is either very spatially concentrated (and thus undetected due to beam smearing effects at our resolution) or has been consumed in the star formation process. In contrast, the vast majority of the disk is made up of tenuous, sub-critical gas undergoing ordered rotation that is not associated with ongoing star formation. We thus further postulate that the global star formation has been exceedingly inefficient.
While the efficiency with which stars are formed in the ISM has been long-studied (e.g., Thronson & Telesco, 1986), it is difficult to state with certainty the “average” efficiency of star formation in dwarf galaxies. van Zee et al. (1997) find differences in the implied star formation efficiencies between a sample of low surface brightness dwarfs and “normal” gas-rich dwarfs, but no apparent distinction between the two samples based on the strength of current star formation. Thus, star formation in dwarfs appears to be a stochastic process: where dense neutral gas is located, stars will form. The physical mechanism(s) that initiate(s) this process are widely debated. Two of the most common drivers speculated to be operating in dwarfs are interactions and turbulence; we briefly discuss both mechanisms below.
Galaxy-scale interactions are widely postulated to compress gas in galaxies, thereby triggering starbursts (e.g., Barnes & Hernquist, 1992; Mihos & Hernquist, 1996; Sanders & Mirabel, 1996). In massive disk galaxies in group environments, this process is frequent; this is a well-studied driver of galaxy evolution. However, in low-mass galaxies, the role of interactions is more difficult to quantify. We know that interactions of dwarfs with massive systems leads to disruption and accretion of the dwarf by the more massive system (e.g., Mihos & Hernquist, 1994). However, the frequency and results of mergers or interactions between two low-mass systems are not constrained observationally. Assuming that such scenarios occur (requiring either close pairs of galaxies, or neutral gas clouds of roughly dwarf galaxy mass interacting with dwarfs), it is logical to assume similar impacts in the low-mass galaxies as those seen in the more massive systems.
This scenario is attractive in that it provides a simple explanation for the observed properties of the ADBS 1138 system. In such a model, at some time in the past, a low-mass object underwent a strong interaction with the neutral gas disk of this system. The interaction drives gas into the inner disk, at which point critical gas density is achieved and stars begin to form in earnest.
At the present time, ADBS 1138 appears to be an isolated galaxy. Searching our “low-resolution” datacube we find no (gas-rich) companion or interacting galaxy at our current sensitivity level. We note that the VLA primary beam at 21 cm (32′) corresponds to a circular field size of radius 195 kpc at our adopted distance. Any relatively massive (MHI 107 M⊙) companion within this projected separation would have been detected in our data. If such an interaction scenario is correct, then the lack of a (gas-rich) companion might be explained by either the process occurring long ago (allowing the H i disk time to recover stability) or by the companion being completely accreted in the central regions of the galaxy.
Alternatively, turbulent motions in the ISM of ADBS 1138 may have initiated and sustained star formation in the inner disk. It is widely suggested that the ISM of dwarf galaxies are fractal in nature, with turbulence playing an important role in regulating the star formation process (e.g., Vogelaar & Wakker, 1994; Elmegreen & Efremov, 1998; Rhode et al., 1999; Westpfahl et al., 1999; Mac Low & Klessen, 2004; Joung & Mac Low, 2006). However, we also note that direct comparisons of simple turbulent models with observations sometimes are more successful in massive spirals than in irregulars (Hunter et al., 1998).
If the inner disk of ADBS 1138 contains substantial turbulent motion, then this conceivably could lead to ongoing star formation. “Feedback” from this star formation will unleash mechanical energy into the ISM, potentially contributing to the turbulent nature of the ISM and thereby sustaining the star formation within the disk. Given the difficulties of completely removing the ISM from dwarf galaxies that are undergoing star formation events (e.g., Mac Low & Ferrara, 1999), such a scenario appears to be a viable (though overly simplistic) model of the evolution of ADBS 1138.
We note that there is likely a molecular component of the ISM to which we are not sensitive with these data. Moving inward through the disk, the ISM may simply become predominantly molecular inside of 7.5 kpc; examples of this transition are numerous (e.g., Walter et al., 2008). This may provide a logical explanation for the ring structure and for the depressed column densities in the central region. This putative molecular gas must still be relatively tenuous, since we only observe ongoing star formation in one relatively small region within the ring. While there may be widespread molecular gas inside the ring, only the innermost 1 kpc appears to have had sufficient densities to support star formation within the past 20 Myr. Based on the nebular abundance (30% Z⊙), and the known problems of studying molecular gas at low metallicities (e.g., Taylor et al., 1998), studying the morphology and kinematics of this molecular gas will be difficult (see also the study by Leroy et al. 2005 and references therein). Considering the low dust contents typically associated with metal-poor dwarfs (e.g., Draine et al., 2007; Engelbracht et al., 2008), it is unlikely that ADBS 1138 hosts undetected or embedded star formation (although examples have been identified; see Cannon et al. 2006).
We wish to stress that we do not advocate for the youth of ADBS 1138; we have no evidence that this is a “primordial” galaxy. On the contrary, we see evidence for an older stellar population in our spectrum. Unfortunately, the large distance to ADBS 1138 (42 Mpc) precludes resolved stellar population work that would provide characteristics of this older stellar population. Rather than being a “young” galaxy, we postulate that ADBS 1138 is an apparently rare system in the local universe; the large H i disk is very stable and shows no signs of recent tidal interaction. The star formation in the very innermost region of the disk (where the red stellar population is located) was stronger in the past.
Taken as a whole, the lines of evidence provided by H i spectral line and optical imaging paints a very intriguing picture. ADBS 1138 is a relatively massive system compared to other dwarfs (e.g., Mateo, 1998). The tenuous H i appears to be very stable and to be happily evolving in isolation at the present time. In the very innermost region, the requisite conditions for star formation were met; we speculate that a low-mass merger event or turbulent processes may have been important in initiating and/or regulating this star formation. We favor an “outside-in” scenario to explain the observed features of ADBS 1138; while this model is simplistic and has shortcomings, it appears to be in better agreement with the data than the “inside-out” models discussed in § 4.1
5. Conclusions
We have presented new optical imaging and spectroscopy and H i spectral line imaging of the intriguing BCD galaxy ADBS 1138. This system displays extreme characteristics that differentiate it from the “typical” dwarf galaxy in the local universe. First, from optical imaging, this system harbors ongoing star formation in an extremely compact stellar distribution. The B-band exponential scale length is only 0.57 kpc. While more compact systems have been found, both among the BCD and the “ultra-compact dwarf” populations, the latter are typically “threshed” systems that are the remnant nucleii of disrupted dwarf galaxies (Drinkwater et al., 2003). ADBS 1138 is one of the most optically compact, isolated, star-forming dwarf galaxies known to date.
The compact optical component is in stark contrast to the extremely extended neutral gas disk. The H i disk is 44 times larger than the B-band exponential scale length; this makes ADBS 1138 the most H i-extended galaxy known. If a low surface brightness stellar component exists, it must be very faint indeed; we find very little variation of optical scale length with SDSS observing band. Sensitive mid-infrared imaging would be insightful to probe the total stellar extent of the system.
The H i morphology is dominated by a broken ring 7.5 kpc in radius, centered on the optical component. Nowhere in the galaxy do H i column densities rise above the “canonical” star formation surface density threshold of 1021 cm-2 (though beam smearing effects may be important). Rather, the optical component occupies only the very innermost portion of an otherwise stable, extended H i disk. The resolution of our data (20″ = 4.08 kpc) precludes a detailed, spatially resolved Toomre Q analysis (e.g., Martin & Kennicutt, 2001). However, recent studies of nearby galaxies have shown close agreement between H i column density and Toomre Q parameter as predictors of locations of active star formation (e.g., de Blok & Walter, 2006); higher spatial resolution observations would allow more detailed analysis of the stability of the large H i disk in ADBS 1138.
We investigate the kinematics of this ring structure in both position-velocity and radius-velocity space. We find no clear signatures of large-scale expansion of this feature. While very coarse estimates of the energy required to create the ring are available from simple potential arguments, we are unable to definitively conclude that coherent star formation and subsequent stellar evolution is responsible for the creation of this ring feature. Based on optical spectra that show “post-starburst” characteristics, this scenario is appealing: a compact stellar distribution would imply spatially concentrated energy input by massive star evolution. However, given the physical size and the kinematically static nature of the ring, we seek an alternative explanation for the ring’s origin.
We consider evolution in the “outside-in” sense, where the H i disk has been stable for essentially a Hubble time, and where localized, stochastic effects have initiated the growth of the stellar population. We speculate on two possible mechanisms of this ongoing star formation: minor-minor merger/interaction or interstellar turbulence. While the distance of ADBS 1138 precludes resolved stellar population work that would more accurately constrain the age of the stellar population, we infer that this is not a young galaxy. Rather, we have discovered an apparently rare object that appears content to evolve in quiescent isolation; inefficient global star formation has produced a system with a very concentrated stellar population but with an enormously extended H i disk.
Within the inner disk, the neutral gas is undergoing the ordered rotation that is typical of many dwarf galaxies. We sample the rotation curve past the point where it turns over, indicating that we have determined the size of the dark matter halo of this system. Simple arguments yield a total dynamical mass of (2–4) 1010 M⊙ (depending on the selected distance from the dynamical center). This outweighs the luminous matter (gas stars, without an explicit estimate of the molecular gas mass) by at least a factor of 15.
The curious properties of ADBS 1138 raise important questions. What fraction of emission-line dwarfs display such compact optical bodies? Are large H i halos common amongst such systems, or is ADBS 1138 unique? How are large, quiescent H i disks formed and maintained? Are the low column densities found in ADBS 1138 typical of those in compact dwarfs? Is the neutral-to-molecular transition more efficient in certain regions of these systems than in more extended dwarfs? Are ring structures in the ISM indicative of this transition, do they arise from the combined effects of stellar evolution, or do they signify another (as yet unidentified) process that shapes the ISM? A detailed study of the gaseous components of a more complete sample of optically compact systems would be exceptionally fruitful in addressing these important questions.
References
- Adelman et al. (2008) Adelman-McCarthy, J., et al. 2008, ApJS, 175, 297
- Bajaja et al. (1994) Bajaja, E., Huchtmeier, W. K., & Klein, U. 1994, A&A, 285, 385
- Barnes & Hernquist (1992) Barnes, J. E., & Hernquist, L. 1992, ARA&A, 30, 705
- Barton et al. (2006) Barton, E. J., van Zee, L., & Bershady, M. A. 2006, ApJ, 649, 129
- Begum et al. (2005) Begum, A., Chengalur, J. N., & Karachentsev, I. D. 2005, A&A, 433, L1
- Bell & de Jong (2001) Bell, E. F., & de Jong, R. S. 2001, ApJ, 550, 21
- Bremnes et al. (2000) Bremnes, T., Binggeli, B., & Prugniel, P. 2000, A&AS, 141, 211
- Cannon et al. (2003) Cannon, J. M., Dohm-Palmer, R. C., Skillman, E. D., Bomans, D. J., Côté, S., & Miller, B. W. 2003, AJ, 126, 2806
- Cannon et al. (2006) Cannon, J. M., et al. 2006, ApJ, 647, 293
- Caplan & Deharveng (1986) Caplan, J., & Deharveng, L. 1986, A&A, 155, 297
- Carignan & Freeman (1988) Carignan, C., & Freeman, K. C. 1988, ApJ, 332, L33
- Carignan & Beaulieu (1989) Carignan, C., & Beaulieu, S. 1989, ApJ, 347, 760
- Carignan & Purton (1998) Carignan, C., & Purton, C. 1998, ApJ, 506, 125
- Condon et al. (1998) Condon, J. J., Cotton, W. D., Greisen, E. W., Yin, Q. F., Perley, R. A., Taylor, G. B., & Broderick, J. J. 1998, AJ, 115, 1693
- Cox (2000) Cox, A. N. 2000, Allen’s Astrophysical Quantities,
- de Blok & Walter (2000) de Blok, W. J. G., & Walter, F. 2000, ApJ, 537, L95
- de Blok & Walter (2006) de Blok, W. J. G., & Walter, F. 2006, AJ, 131, 363
- Draine et al. (2007) Draine, B. T., et al. 2007, ApJ, 663, 866
- Drinkwater et al. (2003) Drinkwater, M. J., Gregg, M. D., Hilker, M., Bekki, K., Couch, W. J., Ferguson, H. C., Jones, J. B., & Phillipps, S. 2003, Nature, 423, 519
- Elmegreen & Efremov (1998) Elmegreen, B. G., & Efremov, Y. N. 1998, arXiv:astro-ph/9801071
- Engelbracht et al. (2008) Engelbracht, C. W., Rieke, G. H., Gordon, K. D., Smith, J.-D. T., Werner, M. W., Moustakas, J., Willmer, C. N. A., & Vanzi, L. 2008, ApJ, 678, 804
- Hunter et al. (1998) Hunter, D. A., Wilcots, E. M., van Woerden, H., Gallagher, J. S., & Kohle, S. 1998a, ApJ, 495, L47
- Hunter et al. (1998) Hunter, D. A., Elmegreen, B. G., & Baker, A. L. 1998b, ApJ, 493, 595
- Jorsater & van Moorsel (1995) Jorsater, S., & van Moorsel, G. A. 1995, AJ, 110, 2037
- Joung & Mac Low (2006) Joung, M. K. R., & Mac Low, M.-M. 2006, ApJ, 653, 1266
- Kennicutt (1989) Kennicutt, R. C., Jr. 1989, ApJ, 344, 685
- Kennicutt (1998) Kennicutt, R. C., Jr. 1998a, ARA&A, 36, 189
- Kennicutt (1998) Kennicutt, R. C., Jr. 1998b, ApJ, 498, 541
- Kim et al. (1999) Kim, S., Dopita, M. A., Staveley-Smith, L., & Bessell, M. S. 1999, AJ, 118, 2797
- Lee et al. (2006) Lee, H., Skillman, E. D., Cannon, J. M., Jackson, D. C., Gehrz, R. D., Polomski, E. F., & Woodward, C. E. 2006, ApJ, 647, 970
- Leroy et al. (2005) Leroy, A., Bolatto, A. D., Simon, J. D., & Blitz, L. 2005, ApJ, 625, 763
- Mac Low & Ferrara (1999) Mac Low, M.-M., & Ferrara, A. 1999, ApJ, 513, 142
- Mac Low & Klessen (2004) Mac Low, M.-M., & Klessen, R. S. 2004, Reviews of Modern Physics, 76, 125
- Martin & Kennicutt (2001) Martin, C. L., & Kennicutt, R. C., Jr. 2001, ApJ, 555, 301
- Mateo (1998) Mateo, M. L. 1998, ARA&A, 36, 435
- Mc Quinn et al. (2009) Mc Quinn, K. B. W., et al. 2009, ApJ, in press (arXiv:astro-ph/0901.2361)
- Meurer et al. (1994) Meurer, G. R., Mackie, G., & Carignan, C. 1994, AJ, 107, 2021
- Meurer et al. (1996) Meurer, G. R., Carignan, C., Beaulieu, S. F., & Freeman, K. C. 1996, AJ, 111, 1551
- Miyauchi-Isobe & Maehara (2000) Miyauchi-Isobe, N. & Maehara, H. 2000, PNAOJ, 6, 1
- Mihos & Hernquist (1994) Mihos, J. C., & Hernquist, L. 1994, ApJ, 425, L13
- Mihos & Hernquist (1996) Mihos, J. C., & Hernquist, L. 1996, ApJ, 464, 641
- Ott et al. (2001) Ott, J., Walter, F., Brinks, E., Van Dyk, S. D., Dirsch, B., & Klein, U. 2001, AJ, 122, 3070
- Puche et al. (1992) Puche, D., Westpfahl, D., Brinks, E., & Roy, J.-R. 1992, AJ, 103, 1841
- Rhode et al. (1999) Rhode, K. L., Salzer, J. J., Westpfahl, D. J., & Radice, L. A. 1999, AJ, 118, 323
- Rosenberg & Schneider (2000) Rosenberg, J. L., & Schneider, S. E. 2000, ApJS, 130, 177
- Rosenberg & Schneider (2002) Rosenberg, J. L., & Schneider, S. E. 2002, ApJ, 567, 247
- Salzer & Norton (1999) Salzer, J. J., & Norton, S. A. 1999, The Low Surface Brightness Universe, 170, 253
- Salzer et al. (2002) Salzer, J. J., Rosenberg, J. L., Weisstein, E. W., Mazzarella, J. M., & Bothun, G. D. 2002, AJ, 124, 191
- Salzer et al. (2005) Salzer, J. J., Lee, J. C., Melbourne, J., Hinz, J. L., Alonso-Herrero, A., & Jangren, A. 2005, ApJ, 624, 661
- Sanders & Mirabel (1996) Sanders, D. B., & Mirabel, I. F. 1996, ARA&A, 34, 749
- Schlegel et al. (1998) Schlegel, D. J., Finkbeiner, D. P., & Davis, M. 1998, ApJ, 500, 525
- Simpson et al. (2005) Simpson, C. E., Hunter, D. A., & Knezek, P. M. 2005, AJ, 129, 160
- Skillman (1987) Skillman, E. D. 1987, NASA Conference Publication, 2466, 263
- Skillman et al. (1989) Skillman, E. D., Kennicutt, R. C., & Hodge, P. W. 1989, ApJ, 347, 875
- Taylor et al. (1998) Taylor, C. L., Kobulnicky, H. A., & Skillman, E. D. 1998, AJ, 116, 2746
- Thronson & Telesco (1986) Thronson, H. A., Jr., & Telesco, C. M. 1986, ApJ, 311, 98
- van Zee et al. (1997) van Zee, L., Haynes, M. P., Salzer, J. J., & Broeils, A. H. 1997, AJ, 113, 1618
- van Zee et al. (1998) van Zee, L., Skillman, E. D., & Salzer, J. J. 1998, AJ, 116, 1186
- van Zee (2004) van Zee, L. 2004, Bulletin of the American Astronomical Society, 36, 1495
- Vogelaar & Wakker (1994) Vogelaar, M. G. R., & Wakker, B. P. 1994, A&A, 291, 557
- Walter et al. (1997) Walter, F., Brinks, E., Duric, N., & Klein, U. 1997, AJ, 113, 2031
- Walter & Brinks (1999) Walter, F., & Brinks, E. 1999, AJ, 118, 273
- Walter & Brinks (2001) Walter, F., & Brinks, E. 2001, AJ, 121, 3026
- Walter et al. (2007) Walter, F., et al. 2007, ApJ, 661, 102
- Walter et al. (2008) Walter, F., Brinks, E., de Blok, W. J. G, Bigiel, F., Kennicutt, R. C., Thornley, M., & Leory, A. 2008, AJ, 136, 2563
- Warren et al. (2004) Warren, B. E., Jerjen, H., & Koribalski, B. S. 2004, AJ, 128, 1152
- Weisz et al. (2008) Weisz, D. R., et al. 2008, ApJ, 689, 160
- Westpfahl et al. (1999) Westpfahl, D. J., Coleman, P. H., Alexander, J., & Tongue, T. 1999, AJ, 117, 868
- Worthey & Ottaviani (1997) Worthey, G., & Ottaviani, D. L. 1997, ApJS, 111, 377
- Young & Lo (1996) Young, L. M., & Lo, K. Y. 1996, ApJ, 462, 203