Photoionized mixing layer models of the diffuse ionized gas
Abstract
It is generally believed that O stars, confined near the galactic midplane, are somehow able to photoionize a significant fraction of what is termed the “diffuse ionized gas” (DIG) of spiral galaxies, which can extend up to 1– 2 kpc above the galactic midplane. The heating of the DIG remains poorly understood, however, as simple photoionization models do not reproduce the observed line ratio correlations well or the DIG temperature. We present turbulent mixing layer models in which warm photoionized condensations are immersed in a hot supersonic wind. Turbulent dissipation and mixing generate an intermediate region where the gas is accelerated, heated and mixed. The emission spectrum of such layers are compared with observations of Rand (ApJ 462, 712) of the DIG in the edge-on spiral NGC 891. We generate two sequence of models that fit the line ratio correlations between [S ii]/H, [O i]/H, [N ii]/[S ii] and [O iii]/H reasonably well. In one sequence of models the hot wind velocity increases while in the other the ionization parameter and layer opacity increases. Despite the success of the mixing layer models, the overall efficiency in reprocessing the stellar UV is much too low, much less than 1%, which compels us to reject the TML model in its present form.
Subject headings:
Line: formation – Hydrodynamics – Turbulence – Galaxies: individual: NGC 891– ISM: lines and bands1. Introduction
The vast majority of the free electrons in the ISM of the Milky Way reside in a thick ( pc scale height) diffuse layer, which fills about 20% of the ISM volume, with a local midplane density of about 0.1 . Such a phase is now known to be a general feature of external star-forming galaxies, both spirals (e.g., Walterbos 1998; Otte et al. 2001, 2002) and irregulars (e.g., Hunter & Gallagher 1990; Martin 1997). It is referred to as the warm ionized medium (WIM) or the diffuse ionized gas (DIG). For edge-on spirals, only in the more actively star-forming galaxies does the gas manifest itself as a smooth, widespread layer of emission detectable above the H ii region layer (Rand 1996). It is generally believed that O stars, confined primarily to widely separated stellar associations near the Galactic midplane, are somehow able to photoionize a significant fraction of the ISM not only in the disk but also within the halo, 1– 2 kpc above the midplane. The heating of the WIM or DIG remains poorly understood, however. As shown by Madsen, Reynolds & Haffner (2006), the temperatures of the Galactic WIM is 2 000 – 3 000 K higher than that of Galactic H ii regions. Interestingly, the ratios of forbidden lines such as [S ii], [N ii] or [O i] with respect to H have been shown to anticorrelate with the WIM/DIG H surface brightness (e.g. Rand 1998, hereafter R98; Madsen, Reynolds & Haffner 2006). The fainter the emission brightness, the higher these ratios become. A similar trend is found with scale height above the disk in edge-on galaxies. Reynolds et al. (1999: RHT) propose that an increase in gas temperature may suffice to explain such increase in line ratios. The detailed study by Collins & Rand (2001) of the DIG in four edge-on galaxies suggests, however, that a systematic increase in ionization, at least of the fraction of O, might be required as well to account for the observed trends.
Turbulent mixing layers (hereafter TML) induced by a hot wind is one of the mechanisms considered by R98 to provide supplemental ionization and heating. It allowed the author to satisfactorily reproduce the line ratios observed in the DIG of the edge-on spiral NGC 891 (situated at Mpc). In order to obtain a reasonable fit, however, the mixing layer model had to be combined with a varying proportion of matter-bounded photoionized condensations. In this composite model, the photoionization models were taken from J. Sokolowski (more information can be found in Bland-Hawthorn et al. 2001) while the mixing layer calculations were borrowed111In particular, the model of SSB with =25 , K and depleted gas metallicities. from Slavin, Shull & Begelman (1993: hereafter SSB). In the current work, we propose two improvements to the heuristic composite model introduced by R98: a) an integrated model: the mixing layer and the matter-bounded photoionized condensations are calculated as a single gas component submitted to an external ionizing flux, b) better turbulence microphysics: rather than considering a single TML temperature given by the geometrical mean of the warm and hot phases, we derive a temperature structure for the TML using the mixing length scheme presented by Cantó & Raga (1991), later implemented in the emission line code mappings ic (Binette et al. 1999).
The paper is organized as follows. The equations describing a turbulent mixing layer and their implementation in the code mappings ic are discussed in § 2. The results obtained from calculations of the TML structure and of its emission line spectrum are presented in § 3 and compared with the line ratios from the DIG of NGC 891. A brief discussion follows in § 4.
2. Modeling turbulent mixing layers
2.1. Previous works on TML
It is not so clear what exactly the difference is between “standard” shock wave heating (i.e., heating and/or ionization due to the passage of a single, well defined shock wave), and the heating that takes place in a compressible, turbulent mixing layer. In particular, it is not entirely clear whether such a turbulent layer actually generates a number of weak shock waves, or whether it has a turbulent cascade ending in turbulent dissipation without the appearance of shock waves.
The initial work on the theory of astrophysical turbulent mixing layers was presented by Kahn (1980) in the context of Herbig-Haro jets. Kahn studied the linear and quadratic perturbation theory of the interface at the edge of a jet flow. The linear theory was studied by a number of authors in considerable detail in the context of extragalactic jets in both the gas dynamic and the magnetohydrodynamic contexts (see, e.g., the review of Bodo 1998). For the radiative Herbig-Haro jet case, numerical simulations have been carried out, e.g., by Rossi et al. (1997) and by Stone, Xu & Hardee (1997). Analytic models based on the standard “turbulent viscosity” approach (with a turbulent viscosity parameterized with a simple, “mixing length” approximation) were computed by Cantó & Raga (1991) and Noriega-Crespo et al. (1996). Also, Dyson et al. (1995), Lizano & Giovanardi (1995) and Taylor & Raga (1995) computed models that included more or less detailed treatments of the chemistry associated with mixing layers. However, these models did not include a proper calculation of the ionization state and line emissivity of the ionized regions of these flows. Binette et al. (1999) adopted the mixing layer scheme developed by Raga & Cantó (1997) and incorporated the ionization evolution of all the species considered and the integration of the full emission line spectrum from the mixing layer. These initial calculations were intended to explain the spectrum from small excitation knots observed in Herbig-Haro objects.
In the context of of the interstellar and the intracluster medium, Begelman and Fabian (1990) proposed a prescription for evaluating the temperature of a turbulent mixing layer. In a subsequent work, SSB used the same prescription to calculate the emission line spectrum from such layers. Their model included radiative transfer, which allowed these authors to consider the effect of the ionizing photons emitted by the mixing layer itself. These calculations were used by R98 in his study of the NGC 891 DIG.
For the current work, we adopted the mixing length prescription of Binette et al. (1999), described below. We also incorporated radiative transfer, which will allow us to considers the impact of ionizing photons that originate not only from the internal diffuse field produced by the mixing layer, but from external sources as well, such as the ionizing UV from H ii regions.
2.2. A mixing length approach
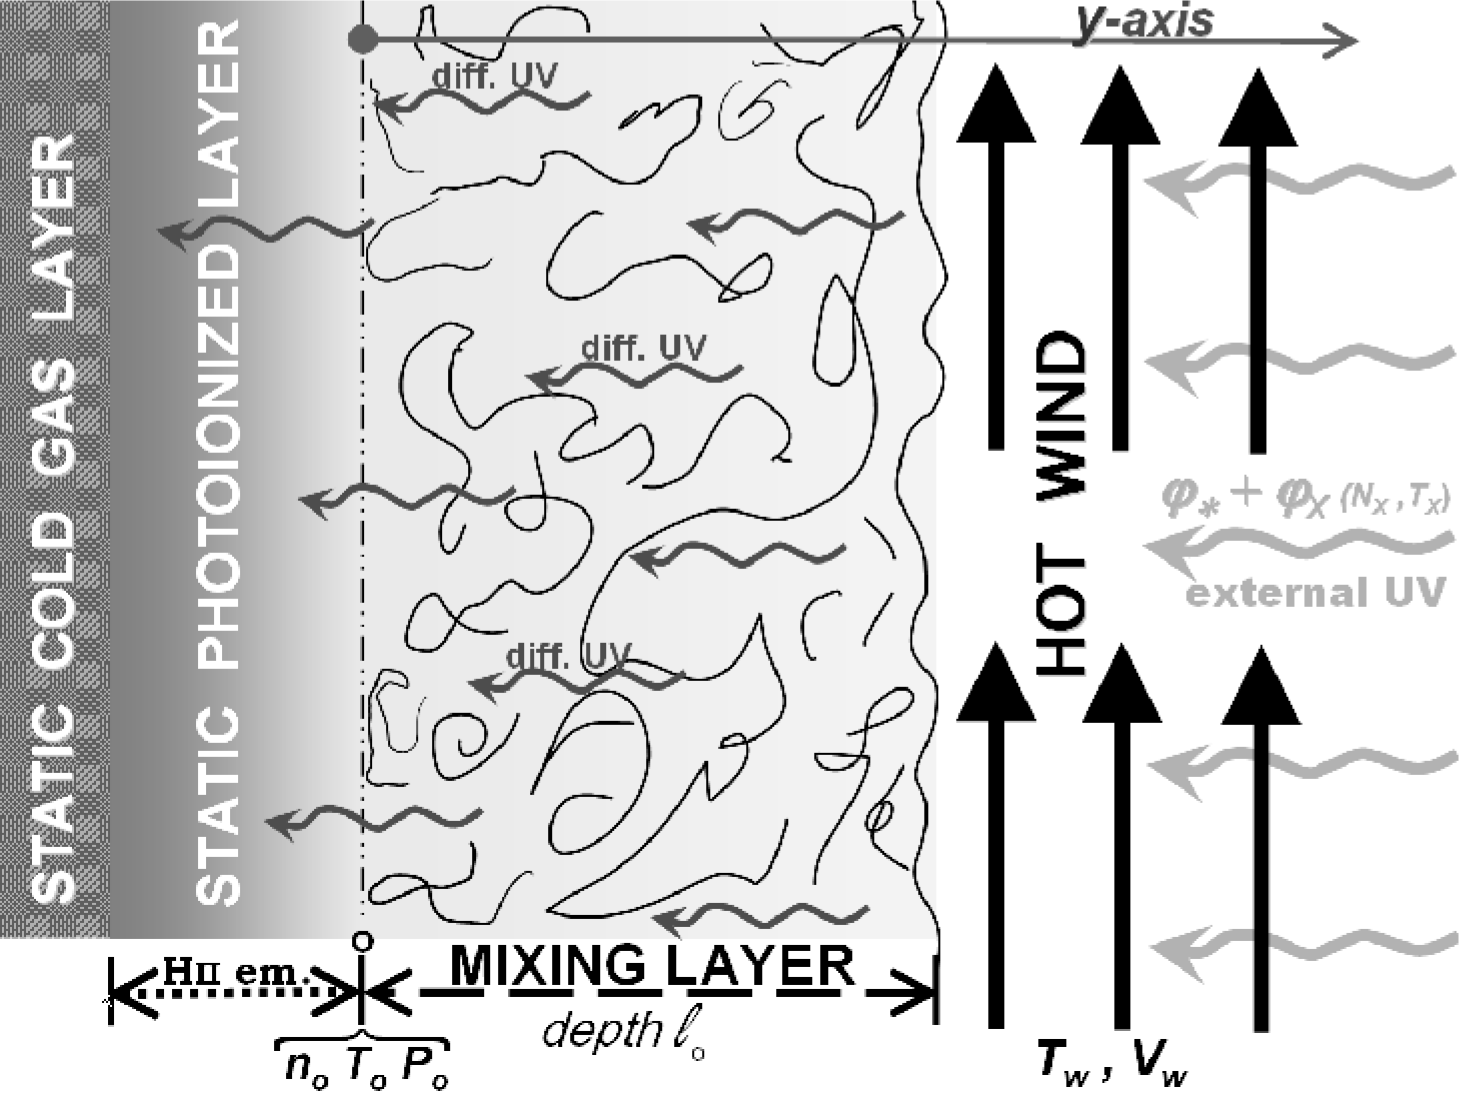
For simplicity, we assume an infinite plane interface, along which a hot wind of temperature is flowing supersonically with velocity with respect to a static warm gas layer of hydrogen number density and temperature . The turbulent mixing layer that develops between the hot and warm phases has a geometrical thickness , as described in the diagram of Fig. 1. For the case of a thin, steady state, high Mach number radiative mixing layer, the advective terms along the direction of the mean flow can be neglected with respect to the corresponding terms across the thickness of the mixing layer (see Binette et al. 2009 for a more detailed description). Under this approximation, the momentum and energy equations can be written as:
| (1) | |||
| (2) |
where is a coordinate measured from the onset of the mixing layer (see Fig. 1), the bulk flow velocity along the x-axis as a function of , and are the radiative energy loss and gain per unit volume, respectively, and and are the turbulent viscosity and conductivity, respectively, which are assumed to be constant throughout the cross-section of the mixing layer. Eq. 1 can be integrated to obtain the linear Couette flow solution:
| (3) |
where is the thickness of the TML and the mean velocity of the hot wind (directed parallel to the static warm phase’s surface). This solution can be substituted in Eq. 2, which can then be integrated to derive the temperature cross-section across the layer.
Within the TML, we consider the equations governing the fractional abundance of each species . This abundance must satisfy the equation:
| (4) |
where is the net sink term (including collisional ionization, radiative and dielectronic recombination, charge transfer… and processes which populate the current species) of the species . The turbulent diffusivity, , is of order unity and assumed to be position-independent. At the inner and outer boundaries of the mixing layer, the ionization fractions are set by the equilibrium values.
To complete the description of the mixing layer, we require lateral pressure equilibrium (which determines the density of the flow along the axis ), and calculate the turbulent viscosity with a simple, mixing length parametrization of the form:
| (5) |
where and are the mass density () and sound speed (respectively) averaged222The subindex denotes averages across the mixing layer, see Appendix A. over the cross-section of the mixing layer, is the geometrical thickness of the mixing layer (Fig. 1).
From the work of Cantó & Raga (1991), the value of the proportionality constant is , as clarified in Appendix A. This is the required value for a supersonic mixing layer model to match the opening angle of of subsonic, high Reynolds number laboratory mixing layers in the limit in which the jet Mach number tends to one. Cantó & Raga (1991) also find that mixing layer models with this value for reproduce the opening angle of mixing layers in jets with Mach numbers333It is customary to express in terms of the wind Mach number, , where is the adiabatic sound speed in the static layer., , of up to 20. Our treatment of the TML can be extended to cover the subsonic case by replacing in Eq. 5 by , whenever (see Appendix A).
Considering that the turbulent conduction and diffusion Prandtl numbers are of order one, we can compute the conduction coefficient as (where is the heat capacity per unit mass averaged across the mixing layer cross-section) and the diffusion coefficient as . In this way, we obtain a closed set of second order differential equations, Eqs. (2) and (4), which can be integrated with a simple, successive overrelaxation numerical scheme.
2.3. TML calculations with the multipurpose code mappings ic
We use the code mappings ic (Ferruit et al. 1997) to compute the radiative energy loss term and the photoheating term (Eq. 2) at each position across the TML. At both the inner and outer boundaries of the mixing layer, we assume equilibrium ionization of the different species, while across the layer, our simple overrelaxation scheme is used to determine the ionization fractions (Eq. 4). For the ion diffusion of each species , the spatial differential equations are converted to temporal equations, with the use of pseudo-time steps , where is the average H number density. This allows us to use the temporal algorithm previously described in Binette & Robinson (1987) for determining the spatial diffusion of the ionic species.
The radiative transfer is determined by integrating (from the hot layer down to ) the intensity of the UV diffuse field that the layer produces, assuming the outward only approximation. Any external UV radiation impinging from the external side is simply added to the diffuse field at the onset of the integration. The intensity of the external ionizing field is defined by the ionization parameter as follows:
| (6) |
where is the speed of light, the flux number of ionizing photons impinging on the TML, and , the total H density at . The flux is the sum of two components: resulting from external UV sources such as hot stars and due to the X-ray diffuse field generated by the hot wind (of column and average temperature ). The absorption processes that are taken into account in the transfer equations across the TML include all the relevant photoelectric cross-sections of the ions present.
Collins & Rand (2001) used a method based on [N ii]6583 to estimate the gas temperature and, by bootstrapping, they could infer the ionization fractions of N and other species. They find that the hydrogen ionization fraction in NGC 891 is as high444Comparable values were inferred for the DIG in the Milky Way by Reynolds et al. (1998) using [O i]6300. as 0.55– 0.80. Because H is fairly ionized and since X-ray ionization is very inefficient in comparison with UV radiation, we infer that their role relative to the soft UV flux from stars must be relatively unimportant. We therefore neglected the term by setting to a negligible value.
For all the calculations presented in this work, the mixing layers are considered immersed in the radiation field that escapes from H ii regions located in the disk. This picture assumes that disk H ii regions are on the whole matter-bounded. According to Beckman et al. (2000), Zurita et al. (2002) and Relaño et al. (2002), the fraction of Lyman photons that escape giant H ii regions (labeled “leakage fraction” in § 3.2) may lie in the range of 30– 50%. The impact of photoionization on our TML model can be inferred from the internal behavior of across the layer, where is defined as follows:
| (7) |
The quantity is zero when the temperature corresponds to the equilibrium value and tends toward unity when cooling becomes much stronger than heating. In our calculations, we iteratively determine at until is obtained.
After computing the emission line spectrum of a given TML, mappings ic offers the option of separately computing the emission lines generated by the inner photoionized layer (i.e. in Fig. 1) where equilibrium ionization prevails. A simple isobaric photoionization model is calculated in this case, using the radiation field that has not been absorbed by the mixing layer. The total line spectrum from all the layers is then given by the sum of the line intensities from both the TML and the static equilibrium photoionization calculation. For all the models studied, however, whenever a static photoionized layer was included, it dominated the total spectrum and dwarfed the spectral signature of the turbulent layers. In order to enhance the contribution of the TML and successfully fit the ratios observed in NGC 891, the static equilibrium region must be obviated and the total thickness of the emission layer becomes equal to that given by the turbulent layer alone. This might come about in a 3D geometry if the cold gas were to reside in the core of dense condensations whose area is much smaller than that of the surrounding turbulent layers.
Since the mixing layer is isobaric, with pressure , the density profile depends on the behavior of the temperature within the layer itself. The value of is set by two quantities evaluated at the inner TML boundary (): the density and the equilibrium temperature . To be definite, a density of was adopted that applies to all models presented in this work. At such a low density, the low density regime fully applies and the calculated line ratios are therefore independent of the actual value used, provided the product is conserved. Our models are appropriate for any density . When the external parameters (, and ) are kept constant, TML models turn out to be equivalent whenever the product of the H density and thickness is the same. Therefore, at least in the low density limit regime typical of the DIG, it is sufficient to specify the quantity555The quantity is a convenient model descriptor. However, it is a bad estimator of the true integrated H column, which is a lot smaller since the density is not constant but decreases as the temperature rises with thickness (Fig. 1). = to uniquely define a model.
We found that the temperature of the hot wind is not a critical parameter of the TML models. Its value can be varied and still result in a sequence of equivalent models (i.e. with similar line ratios), provided the value of is kept constant. For this reason, we adopted the same value of K for all the models presented in this work.
To summarize, in order to compute solutions to the mixing layer, we must first define the external radiation field and then specify the values of the following parameters: the mixing layer’s , the ionization parameter, , and finally the velocity of the hot wind, , and its temperature, which we kept constant at K.
3. Modeling the DIG in NGC 891
3.1. The gas abundances
Unless otherwise specified, the abundances of the elements are solar (Anders & Grevesse 1989) and have the following values: (He, C, N, O, Ne, Mg, Si, S, Ca, Ar, Fe) relative to H (by number). Depleted or oversolar metallicities resulted in line ratios difficult to reconcile with the forbidden line ratios observed in NGC 891.

3.2. The ionizing spectral energy distribution
The first step consists of defining the spectral energy distribution (sed) of the ionizing radiation field reaching the DIG. A useful constraint is provided by the observed He i 5876/H ratio. In a previous observational work on NGC 891, Rand (1997) measured a ratio of , which he estimated implies a ratio of He ionizing photons to H ionizing photons, /, of about 0.08. To be consistent with this datum, Rand favors a stellar temperature of 37 500 K. In the calculations presented here, we adopt a similar temperature of 38 000 K. The atmosphere models used in mappings ic are from Hummer & Mihalas (1970). As in R98, we assume that only a fraction of the stellar radiation escapes the H ii regions in the spiral disk to reach the DIG. To be definite, we have set the leakage fraction to 20%. To compute this modified sed, we have computed a plane-parallel photoionization model and extracted the photon spectrum at a depth where 80% of the ionizing photons have been used up. The diffuse ionizing radiation from the slab itself has been included. The resulting sed is shown in Fig. 2 (solid line). Because this modified sed contains few ionizing photons beyond 24.6 eV, the mixing layer model presented below is characterized by an ratio as low as . This suggests a higher stellar temperature for NGC 891 than considered here and in Rand (1997), or a larger leakage fraction than assumed above.
We have verified that the stellar temperature can be raised up to 40 000 K without exceeding the observed He i/H value (assuming the same leakage fraction). For the DIG in the Milky Way, He i 5876/H is observed to be significantly smaller, lying in the range 0.01– 0.04 (Madsen et al. 2006).

3.3. TML temperature and ionization structure
In Fig. 3 we present the behavior of the temperature as well as of the imbalance between cooling and heating (, see Eq. 7) as a function of thickness within a representative mixing layer calculation. For this model, the hot wind velocity is 84 , while the ionization parameter is and the layer’s column . The inner boundary is characterized by an equilibrium temperature of K. As illustrated in Fig. 3, due to the very hot wind temperature (), increases monotonically to reach unity at as a result of the cooling term becoming progressively dominant relative to the photoheating term.
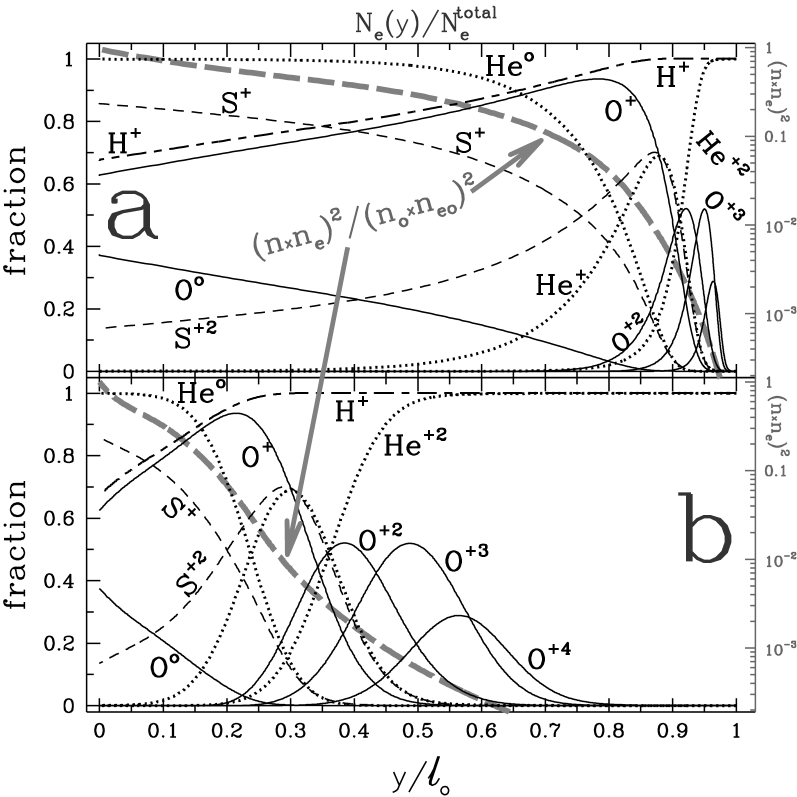
The ionization structure within the same TML is shown in Fig. 4. The static layer if it was present would have ionization fractions quite similar to those found at the extreme left in this figure. Line intensities depend on temperature, but scales also with density square. Since the quantity decreases strongly with increasing thickness (see thick grey dashed line), the local emissivities likewise decrease markedly towards the right. It is therefore apparent that any emission from [O iii] or any other species with similar or higher ionization potential are produced in this model only within the mixing layer, and not within the static layer. This would of course be different if a significantly higher stellar temperature was chosen.
3.4. DIG line ratio trends in NGC 891
For comparison with TML models we selected the work of R98 on the DIG in NGC 891. The data on this object present the following advantages: the spectral data are homogeneous, they are of sufficient quality to reveal subtle intrinsic correlations among the line ratios observed at different positions across and along the disk of this edge-on spiral, finally, mid-infrared halo and disk observations with the Spitzer Space Telescope are now available (Rand et al. 2008). We postulate that the line ratio correlations are a direct manifestation of the DIG excitation mechanism rather than positional changes in gas metallicity or in effective stellar temperature.
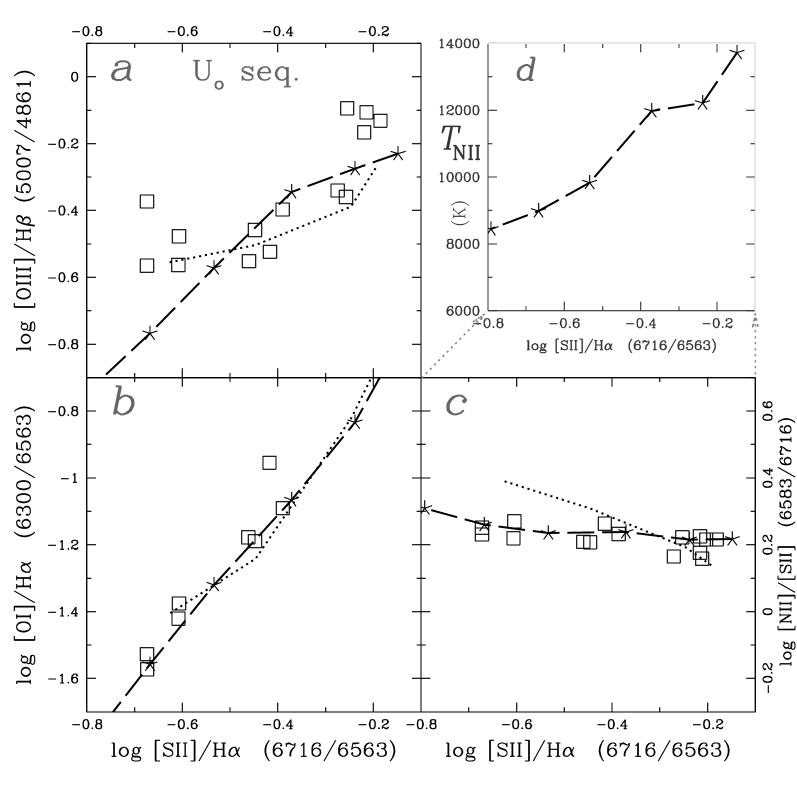
To optimize the comparison with models, we present the line ratios in Fig. 5 in a format which reveals the essential trends found by R98 in his long slit data. The three ratios [O iii]/H (5007/4861), [O i]/H (6300/6563) and [N ii]/[S ii] (6583/6716) are all plotted against the same ratio [S ii]/H (6716/6563). The [O iii]/H line ratio lies below unity in all measurements (panel a). What is most striking about the data is that not only do the forbidden line intensities [O i], [N ii] increase along with [S ii]/H, but the high excitation [O iii]/H ratio as well. Such a behavior runs counter to the predictions of simple photoionization models where [O iii]/H increases markedly when the ionization parameter is increased, while the ratios [S ii]/H, [O i]/H or [N ii]/H all decrease. This leads to the proposition by R98 and Collins & Rand (2001) that another ionization process besides photoionization is likely to be involved. With the Milky Way DIGs, the derived temperatures are found to increase along with the increase of the forbidden lines relative to H or H (e.g. Madsen et al. 2006). According to RHT, a systematic temperature increase might be all that is necessary to reproduce the increase in the forbidden line intensities. Again, this runs counter to predictions of simple photoionization models where the temperature is quite insensitive to changes in the value of . Hence various authors have concluded in the existence of a new heating (e.g. RHT) and possibly ionizing mechanism (e.g. R98) in addition to photoionization. For the sake of completeness, we included an inset in Fig. 5 (panel d) where the [N ii] temperature computed in models is plotted against [S ii]/H. We may reasonably expect that any realistic DIG models should show a significant temperature gradient in such a diagram.
3.5. Specific TML calculations
We carried out an extensive exploration of the parameter space in order to determine the parameter range that could best reproduce the trends present in Fig. 5. As in previous studies, we concur that the layer has to be matter-bounded, otherwise the [O i]6300/[S ii]6716 ratio would significantly exceed the observed values. Furthermore, for the calculations to show a significant departure from steady-state photoionization as a result of turbulent dissipation and ionization mixing, it required an extremely thin layer, with a column of order only. This raises concerns about the efficiency of turbulent dissipation to contribute significantly to the DIG emission, as discussed in § 4. Because the TML layer in the composite model of R98 was decoupled from the photoionized component, the author was free to adopt a much larger column of in his matter-bounded photoionization calculations.

A characteristic of the DIG is its relatively weak [O iii] line intensity, which favors relatively small values for the ionization parameter when considering photoionization (e.g. Sokolowski & Bland-Hawthorn 1991). In the case of the composite TML models of R98, the author has employed values that varied between to . In the TML regime that we have explored, we are lead towards similar values, with typically at . We find that the [O iii] flux is the result of turbulent dissipation rather than of photoionization. On the other hand, low ionization species responsible for lines such as [O ii], [N ii], [S ii]… are mostly caused by photoionization, but the additional heating due to turbulent dissipation causes these lines to become much brighter. In fact, if a static layer (see Fig. 1) with such a low value of was present behind the TML, the overall line ratios would lie near [N ii]/[S ii]=0.93, [S ii]/H=0.087 and [O i]/H=0.013. Therefore, these ratios would all lie outside the boundaries from the three line diagrams a, b and c of Fig. 5. If we relied only only photoionization (without any TML) to fit the observations, we would have to adopt a much harder ionizing sed (but see § 3.2) to provide the necessary heating and the ionization up to O+2.
3.5.1 The – sequence
In Fig. 5, we superpose a sequence of TML models to the data, in which the wind velocity is progressively increased in locked steps, by 0.1 dex, from to 133 (corresponding to Mach numbers increasing from =2.53 to 13.5). The column was set to and to . In that sequence, the forbidden line ratios of [O iii]/H and [S ii]/H increase with increasing . We note that the temperature inferred from the [N ii] (5755/6583) line ratio, , increases slightly along with [S ii]/H, as shown in the upper right inset (panel ). Overall, the trends in line ratios are well reproduced, better in fact than with the composite (photoionization+TML) model of R98, which is represented by the dotted line. R98 showed that the line ratios not only correlate with decreasing H surface brightness, but also with increasing height above the disk of NGC 891. If the sequence of models were a valid description of the long-slit measurements of R98, this would imply that the wind velocity is increasing with .
3.5.2 The – sequence
Alternatively, it is possible to reproduce the line ratio correlations by varying the ionization parameter instead of . In Fig. 6, we show a sequence of models in which both and increase666Such a sequence is achieved by increasing both quantities and in lock steps, while keeping constant. in lock steps by 0.2 dex, while is kept constant at 85 . The initial values of and are and , respectively, while the final values are 10 times larger. Varying in locked steps with the ionization parameter limits the variations in H i opacity, which is desirable otherwise the TML layers either get too thin or reach a regime in which photoionization takes over. In the sequence shown in Fig. 6, we have ensured that photoionization does not become the dominant process. In fact, [O iii] and the other forbidden lines actually decrease as is increased. For instance, [O iii] gets weaker as increases because the average gas temperature where it is produced decreases along the sequence from 51 500 to 40 300 K. This sequence of models shows a [N ii] temperature gradient (Fig. 6d) that is stronger than in the previous sequence (Fig. 5d). When compared to the data on NGC 891, the behavior of the [O iii]/H ratio is not as closely fit as in the – sequence, but the fit of the other line ratios are better.
3.6. Other DIG observations
Although this study focuses on NGC 891, fitting similar line ratio trends in other objects is certainly achievable. In itself, this does not validate TML models, since the main reason for this is the higher number of free parameters that can be varied and which were already numerous in the alternative case of pure photoionization.
Although forbidden line ratios with respect to H or H increase with height above the midplane in NGC 891, this behavior is not repeated in all spirals. Cases for instance where [O iii]/H decreases or reverse trend with height are well documented in the studies of Miller & Veilleux (2003), Otte et al. (2002) and Collins & Rand (2001). In their studies of face-on M33, Voges & Walterbos (2006) find sudden changes in this ratio. Within the perspective of TML models, these observations bring new constraints to the interpretations that models are able to provide. For instance, in cases where [O iii]/H decreases with z, we find it improbable that could be decreasing with height, as required by the – sequence (Fig. 5). In the case of the – sequence (Fig. 6), however, a TML interpretation would imply that is increasing with height, which could only come about if the ambient gas pressure decreases faster with z than the local ionizing flux.
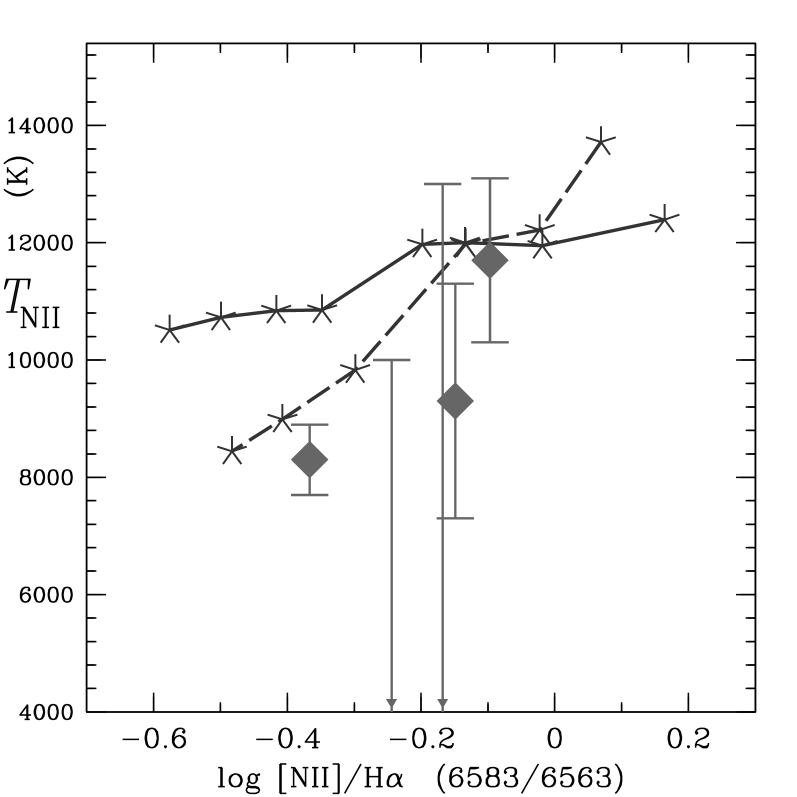
The direct measurement of the [N ii] temperature is difficult owing to the intrinsic weakness of the [N ii]5755 lines. The [N ii] (5755/6583) line ratio has nevertheless been determined in the Milky Way for three DIG sight lines (Madsen et al. 2006; Reynolds et al. 2001). The inferred temperatures are plotted in Fig. 7. The two upper limits for NGC 891, as determined by Rand (1997), are also plotted. The comparison of these three temperatures by Madsen et al. (2006) with those of ‘classical’ H ii regions confirms that the DIGs are approximately 2000– 3000 K warmer than H ii regions. The TML models presented in this work are overlayed in Fig. 7. Despite the scarce data, the comparison with models is encouraging insofar as it shows that turbulent dissipation and mixing can provide the extra heating required by the Galactic DIGs.
With the TML models presented in this work, in which none of the [O iii] emission is the result of photoionization but rather due to turbulent mixing and dissipation, we find that [O iii] is produced at a depth of very high electron temperature. The behavior of the [O iii] (4363/5007) line ratio in models shows that in both sequences the increase in [O iii] is caused by an increase in average777Because of the steep temperature gradient across the TML, the integrated [O iii] (4363/5007) line ratio represents an ‘average’ temperature that is strongly biased towards layers where the gas is densest rather than being close to the temperature where the fraction of O+2 peaks (see behavior of in Fig. 4). temperature, from to 52 000 K. These values are much higher than those characterizing the [N ii] emission zone, to the extent that the [O iii]4363 line flux is between the value of the [N ii]5755 flux and half of it. In principle, measuring a high [O iii] temperature or not would provide a strong discriminant for or against TML models.
3.7. The mid-infrared [Ne ii] 12.81 m and [Ne iii] 15.56 m lines
Mid-infrared observations of NGC 891 using the Spitzer Space Telescope has been reported by Rand et al. (2008). Of particular interest are the measurements of the [Ne ii] 12.81 m, [Ne iii] 15.56 m and [S iii] 18.71 m fluxes of the DIG in the halo (2 measurements) as well as in the disk (1 measurement). Interestingly, the observed [Ne iii]/[Ne ii] ratio increases with height by a factor of three. This is qualitatively similar to the trends revealed by the optical ratios of [S ii]/H or [O iii]/H. Our two TML sequences has [Ne iii]/[Ne ii] increasing along with [O iii]/H, but the increase is only a factor two. The maximum values reached for the ratio [Ne iii]/[Ne ii] are 0.067 and 0.070, for the – sequence and – sequence, respectively. This is about 4.5 times too weak with respect to the observed halo value of 0.31. In his analysis, Rand et al. (2008) adopted a Ne/O abundance 2.5 times higher ratio than the solar value (§ 3.1). Changing our abundance set might resolve this discrepancy.
4. Discussion
A photoionized turbulent mixing layer can reproduce the line ratio trends observed by R98, if it is matter-bounded. Our work confirms the initial intuition of R98 who mixed two causally unrelated ionized components in ad hoc proportions: a TML component and a matter-bounded photoionized component. The main advantage of our integrated model is that the ionized slab considered is submitted in a self-consistent manner to both excitation mechanisms: turbulent dissipation and photoionization. Adjusting the parameters so that the observed line ratios can be reproduced, however, comes at a price. The thickness of the TML layer becomes so small that the overall efficiency in generating emission lines becomes a concern. This can be illustrated as follows. From the definition of , the ionizing photon flux impinging on our putative mixing layer of area is , where is and . In the case of pure photoionization, assuming ionization equilibrium, the H luminosity is given by where is a measure of the reprocessing efficiency, that reaches unity in the case of an ionization-bounded layer, where all the ionizing photons are absorbed. When the LHα from the TML models are compared to that expected from this simple relationship, we find that the – sequence is characterized by an efficiency that goes from 0.013 to 0.0031, as is increased. In the case of the – sequence, goes from 0.0013 to 0.027, as and are increased. What is most problematic, is that the efficiency is lowest when turbulent dissipation is maximized, that is, in the regime where the [O iii]/H ratio is highest, whether we consider the – sequence of Figs. 5 or the – sequence of Fig. 6. The efficiencies at the high [O iii]/H end are only 0.0031 and 0.0013, for the – sequence and – sequence, respectively.
Such an efficiency is uncomfortably low. This can be illustrated by using the observations of NGC 891 by Rand (1997). With the long-slit perpendicular to the galactic plane of edge-on NGC 891, the author measured an H surface brightness of at an height =2 kpc, where the [O iii]/H/ ratio peaks. Assuming a distance of Mpc (1 arcsec=46 pc), the slit, perpendicular to the galactic plane, crosses the mid-plane of NGC 891 at 4.6 kpc from the nucleus. We adopt 1″ as the reference spatial scale. We integrate along the thickness of the layer, which we assume extends at most over 9 kpc along the line of sight, so that the layer area exposed to the UV flux arising from the midplane becomes 46 pc arcsec-1 9 000 pc. The surface brightness derived from the LHα expression above becomes: , where is the number of projected TML layers per arcsec (at =2 kpc) along the slit. Hence, . For an efficiency of 0.0013 and with =0.4, matching the observed surface brightness implies the unreasonable number of layers888For this particular model, the layer’s geometrical thickness is cm, which in any case leaves no space for the hot wind to flow if is large. per arcsec along the slit, assuming a density typical of the DIG in the Milky Way (=1). Even if one raises this density by an order of magnitude, too many layers are still required. For higher density values beyond that, there would not be enough O stars to account for the required ionizing flux.
To summarize, it is possible to contrive the values of the parameters describing TML models so that the observed trends in line ratios are reproduced reasonably well. However, the efficiencies of any successful models appear downright too insignificant. In its current form our TML model is therefore invalidated. We may speculate that the gradient in temperature between the hot wind and the warm photoionized gas is so steep that the mixing length approach explored by Cantó & Raga is not directly applicable to the very hot wind surrounding the DIG. Values for the constant (Eq. 5) about two orders of magnitude larger would be required so that turbulent mixing and dissipation could operate over a layer’s thickness much larger than the very small values found in the current model.
Appendix A The derivation of constant
From Eq. A3 in Cantó & Raga (1991), we obtain that the turbulent viscosity coefficient is given by:
| (A1) |
where is given by with and (see their Eqs. 27, 30 and 36). and correspond to the adiabatic sound speed in the hot wind and in the static layer, respectively. The subindex denotes averages across the mixing layer. Cantó & Raga (1991) refer to the case as the ‘mixing layer limited’ case while the ‘jet limited’ case corresponds to
In the case where , since in the isobaric case , after multiplying the numerator and denominator by , we can rewrite the above expression as
| (A2) |
In the notation used in this Paper, the constant simply corresponds to the ratio . In the transonic case or when , we replace in Eq. A2 by . It turns out that the value of used by Binette et al. (1999) is a factor 3 too large. This can be corrected by dividing by 3 the values of the layer’s thickness, , quoted in their paper.
References
- (1) Anders, E., & Grevesse, N. 1989, Geochim. Cosmochim. Acta 53, 197
- Beckman et al. (2000) Beckman, J. E., Rozas, M., Zurita, A., Watson, R. A., & Knapen, J. H. 2000, AJ, 119, 2728
- Begelman & Fabian (1990) Begelman, M. C., & Fabian, A. C. 1990, MNRAS, 244, 26
- Binette & Robinson (1987) Binette, L., & Robinson A. 1987, A&A, 177, 11
- Binette et al. (1999) Binette, L., Cabrit, S., Raga, A., & Cantó, J. 1999, A&A, 346, 260
- Binette et al. (2009) Binette, L., Drissen, L., Úbeda, L., Raga, A.C., Robert, C., Krongold, Y. 2009, A&A, in press
- Bland-Hawthorn et al. (1997) Bland-Hawthorn, J., Freeman, K. C., & Quinn, P. J. 1997, ApJ, 490, 143
- Bodo (1998) Bodo, G.: 1998 in Astrophysical Jets: Open Problems, Massaglia S., Bodo G. (eds.), Amsterdam, Gordon and Breach, p. 161
- Cantó & Raga (1991) Cantó, J., & Raga, A. C. 1991, ApJ, 372, 646.
- Collins & Rand (2001) Collins, J. A., & Rand, R. J. 2001, ApJ, 551, 57
- Dyson et al. (1995) Dyson, J. E., Hartquist, T. W., Malone, M. T., & Taylor, S. D. 1995, RevMexAA (Conf. Series), 1, 119
- Ferruit et al. (1997) Ferruit, P., Binette, L., Sutherland, R. S., & Pecontal, E. 1997, A&A, 322, 73
- (13) Hummer, D. G., & Mihalas, D. 1970, MNRAS, 147, 339
- Hunter & Gallagher (1990) Hunter, D. A., & Gallagher, J. S., III 1990, ApJ, 362, 480
- Kahn (1980) Kahn, F., 1980, A&A, 83, 303
- Lizano & Giovanardi (1995) Lizano, S., Giovanardi, C., 1995, ApJ447, 742
- Madsen et al. (2006) Madsen, G. J., Reynolds, R. J., & Haffner, L. M. 2006, ApJ, 652, 401
- Martin (1997) Martin, C. L. 1997, ApJ, 491, 561
- Miller & Veilleux (2003) Miller, S. T., & Veilleux, S. 2003, ApJ, 592, 79
- Noriega-Crespo et al. (1996) Noriega-Crespo, A., Garnavich, P.M., Raga, A. C., Cantó, J., Böhm, K. H., 1996, ApJ 462, 804
- Otte et al. (2001) Otte, B., Reynolds, R. J., Gallagher, J. S., III, & Ferguson, A. M. N. 2001, ApJ, 560, 207
- Otte et al. (2002) Otte, B., Gallagher, J. S., III, & Reynolds, R. J. 2002, ApJ, 572, 823
- Raga & Cantó (1997) Raga, A. C., & Cantó, J.: 1997, in Molecules in Astrophysics: Probes and Processes, Van Dishoeck E. (ed.), Dordrecht: Reidel, p. 89
- Rand (1996) Rand, R. J. 1996, ApJ, 462, 712
- Rand (1997) Rand, R. J. 1997, ApJ, 474, 129
- Rand (1998) Rand, R. J. 1998, ApJ, 501, 137 (R98)
- Rand et al. (2008) Rand, R. J., Wood, K., & Benjamin, R. A. 2008, ApJ, 680, 263
- Relaño et al. (2002) Relaño, M., Peimbert, M., & Beckman, J. 2002, ApJ, 564, 704
- Reynolds et al. (1998) Reynolds, R. J., Hausen, N. R., Tufte, S. L., & Haffner, L. M. 1998, ApJ, 494, L99
- Reynolds et al. (2001) Reynolds, R. J., Sterling, N. C., Haffner, L. M., & Tufte, S. L. 2001, ApJ, 548, L221
- Reynolds et al. (1999) Reynolds, R. J., Haffner, L. M., & Tufte, S. L. 1999, ApJ, 525, L21 (RHT)
- Rossi et al. (1997) Rossi, P., Bodo, G., Massaglia, S., Ferrari, A. 1997, A&A, 321, 672
- Slavin et al. (1993) Slavin, J. D., Shull, J. M., & Begelman, M. C. 1993, ApJ, 407, 83 (SSB)
- Sokolowski & Bland-Hawthorn (1991) Sokolowski, J., & Bland-Hawthorn, J. 1991, PASP, 103, 911
- Stone, Xu & Hardee (1997) Stone, J.M., Xu, J., Hardee, P. E. 1997, ApJ, 483, 136
- Taylor & Raga (1995) Taylor, S. D., Raga, A. C. 1995, A&A, 296, 823
- Voges & Walterbos (2006) Voges, E. S., & Walterbos, R. A. M. 2006, ApJ, 644, L29
- Walterbos (1998) Walterbos, R. A. M. 1998, Publications of the Astronomical Society of Australia, 15, 99
- Zurita et al. (2002) Zurita, A., Beckman, J. E., Rozas, M., & Ryder, S. 2002, A&A, 386, 801