Theoretical Aspects of Charge Correlations in -(BEDT-TTF)
Abstract
A review is given on the theoretical studies of charge correlations in -(BEDT-TTF). Various studies show that within a purely electronic model on the -type lattice with the on-site and the nearest neighbor and interactions, the diagonal stripe, -axis three-fold, and the vertical stripe charge correlations are favored in the regime , , and , respectively. In the realistic parameter regime of , there is a competition between -axis three fold state and the diagonal stripe state. Since these are different from the experimentally observed -axis three fold and the horizontal stripe charge correlations, additional effects have to be included in order to understand the experiments. The electron-lattice coupling, which tends to distort the lattice into the -type, is found to favor the horizontal stripe state, suggesting that the occurrence of this stripe ordering in the actual materials may not be of purely electronic origin. On the other hand, distant electron-electron interactions have to be considered in order to understand the -axis three fold correlation, whose wave vector is close to the nesting vector of the Fermi surface. These studies seem to suggest that the minimal model to understand the charge correlation in -(BEDT-TTF) may be more complicated than expected. Future problems regarding the competition between different types of charge correlations are discussed.
Keywords: -(BEDT-TTF), charge correlation, electron-electron interaction, random phase approximation, Fermi surface
1 Introduction
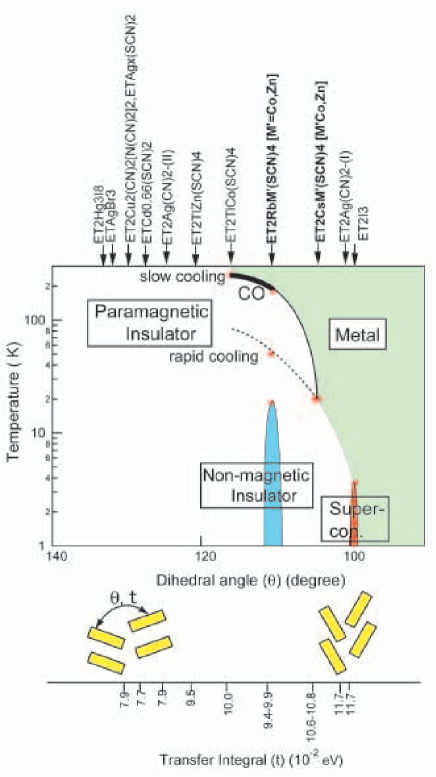
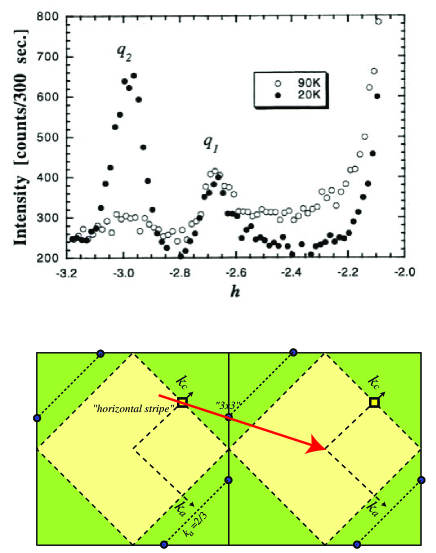
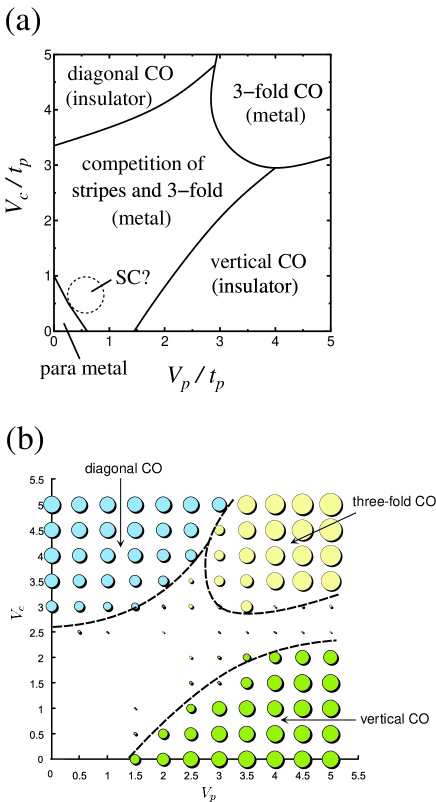
In recent years, charge correlations, i.e., orderings and fluctuations have been one of the central issues in the physics of organic materials [1, 2, 3]. -(BEDT-TTF)[4] is one of the most interesting families of organic compounds that exhibit short- or long-range charge correlations. The crystal structure of -(BEDT-TTF), where BEDT-TTF = bis(ethylenedithio)tetrathiafulvalene, consists of a stack of alternating layers of BEDT-TTF and the anion . In the BEDT-TTF layers, the molecules form an anisotropic triangular lattice, and the anion controls the angle between the BEDT-TTF molecules, which in turn determines the band structure. Mori and coworkers [5, 6] obtained the electronic phase diagram in the angle-temperature space as shown in figure 1, [7] which shows the wide variety of this series of materials, ranging from charge-ordered insulators such as RbZn(SCN)4 to the superconductor I3. Further interest in this series of compounds has arisen by the observation of giant nonlinear transport for Cs(SCN)4 (Co, Zn), which causes the material to act as an organic thyristor [8, 9]. There, it has been pointed out that the coexistence of two types of short range charge correlations with modulation wave vectors and (in units of the reciprocal lattice primitive vectors in the , , and directions; the and directions are shown in figure 2) plays an important role in this phenomenon. The charge modulation is often referred to as horizontal stripe ordering since this wave vector corresponds to a stripe-type charge modulation, where the stripes run in the horizontal direction (figure 3). The modulation corresponds to a charge correlation with respect to the - unit cell, as shown in figure 4. At high temperatures, a diffuse X-ray spot is observed at [10, 11], while the structure develops as the temperature is lowered, and the system becomes more insulating (figure 5). When an electric field is applied, the horizontal stripe ordering is degraded, resulting in a recovery of the metallic behavior and thus the nonlinear transport. Related to this phenomenon is the observation of lattice modulation with wave vector for CsCo(SCN)4 at a pressure of 10 kbar, which has been attributed to a pressure induced charge density wave because the modulation wave vector coincides with the nesting vector of the Fermi surface [11].
For Rb(SCN)4 (Co,Zn) also, two types of charge correlation are involved. At high temperatures in the metallic phase, diffuse X-ray spots are observed at and , which suggests the presence of short-range charge correlation (figure 4) [12, 13]. Some anomalies have also been observed in the nuclear magnetic resonance experiments in a similar temperature range [14, 15]. At around 200 K, the system undergoes a metal-insulator transition, accompanied by a structural phase transition to the so-called phase [16], in which the unit cell is doubled in the direction [6, 12, 13, 14, 15, 17, 18, 19]. In the phase, X-ray diffraction measurements have revealed that long-range horizontal stripe charge ordering with the modulation wave vector takes place [5, 6, 12, 13].
Theoretically, the origin of these charge correlations has been an issue of great interest [2]. A number of analytical and numerical studies have been performed using the extended Hubbard model (coupled with the lattice in some cases) described in the following section. In the present paper, we review theoretical studies on the charge correlations in -(BEDT-TTF).
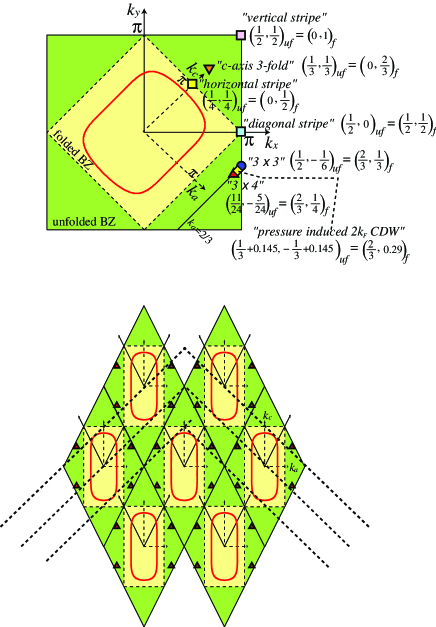
2 Theoretical model
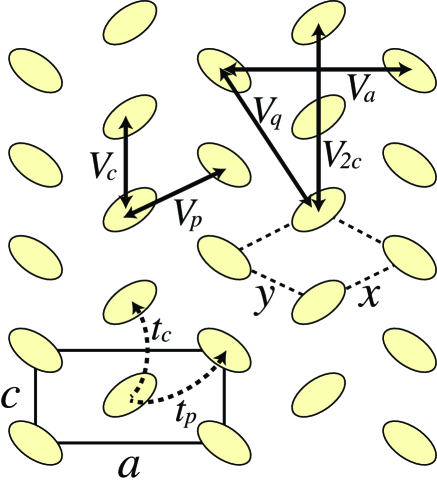
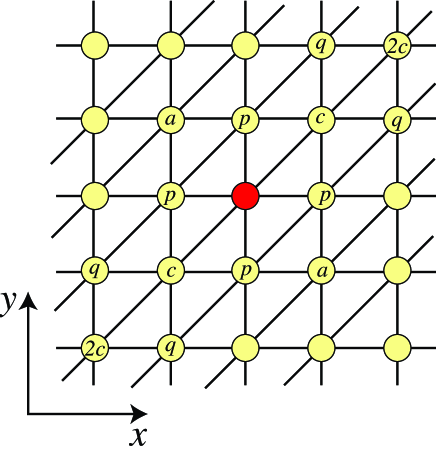
In this section, we describe an electronic model of -(BEDT-TTF), where each molecule is considered as a “site” in the tight binding approximation. In the lattice structure of -(BEDT-TTF) shown in figure 2, the direction of the molecules alternates along the axis resulting in the rectangular - unit cell, but this alternation is irrelevant as far as the hopping integrals in the tight binding model are concerned. Therefore, we can consider a unit cell (-) which is half the size of the usual unit cell, thereby obtaining the effective lattice structure shown in figure 6. The corresponding Brillouin zone becomes unfolded, and the relation between the unfolded and folded Brillouin zone is shown in figure 7. Here, the wave vectors are given in units of the reciprocal lattice primitive vectors, and the subscripts and indicate whether the reciprocal vectors are those of the unfolded or folded Brillouin zone, respectively. The wave vector of the experimentally observed horizontal stripe charge ordering is in the unfolded Brillouin zone. The wave vector at which the diffuse X-ray spots are observed in the high temperature regime lie on the diagonal line labeled as , which satisfies in the unfolded Brillouin zone. Since these wave vectors correspond to charge correlation with threefold periodicity in the -axis direction (figure 4), we will call these the “-axis threefold” charge correlation.
Important progress in understanding the origin of the charge correlations in -(BEDT-TTF) was made by Seo, who included the nearest neighbor off-site repulsions and in the model Hamiltonian (see figure 2)[16] in addition to the on-site interaction , which had already been considered in the seminal studies of organic conductors by Kino and Fukuyama [20] and Seo and Fukuyama [21]. Mori estimated the interaction parameters by directly calculating the Coulomb interaction using the highest occupied molecular orbitals of BEDT-TTF, neglecting the screening effect [22]. This estimation shows that ( is slightly smaller than ), while interactions , , and are also of significant size compared with and .
A number of theoretical studies on the charge correlations in -(BEDT-TTF) have been performed using the extended Hubbard model on the lattice shown in figure 6 [23], where the Hamiltonian is given in the form
| (1) |
where creates an electron with spin at site , and . The band filling, i.e., the average number of electrons per site (molecule), is fixed at in accord with the actual material. In figure 6, the letters , , , denote the relative positions with respect to the red site at the center, and we use these letters to specify the range of the hopping integrals and the off-site repulsive interactions. For the kinetic energy terms, we consider hoppings and , where is taken as the unit of energy. Cs(SCN)4 (Co, Zn) has small values of , while Rb(SCN)4 (Co, Zn) and CsCo(SCN)4 under pressure have relatively large values of to [11].
3 Stripe-type charge correlations
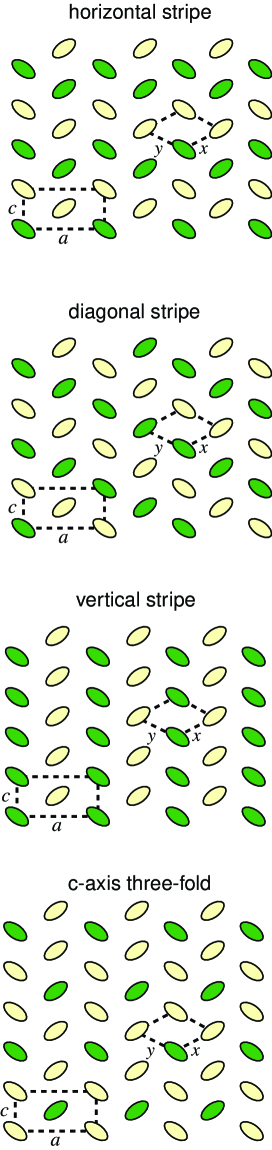
Three types of stripe-type charge correlations, vertical, horizontal, and diagonal (figure 3), were proposed by Seo [16]. The wave vectors of the three patterns correspond to , , and , respectively. Intuitively, the horizontal and diagonal stripe states are favored when is small, while the vertical stripe state is favored when is small, as can be understood from figure 3. In ref. [16], the energies of various types of charge correlation patterns were calculated within the mean field approximation. The calculation shows that the diagonal stripe is more stable than the horizontal and vertical stripe states when is small, while the vertical stripe state is stable for small . Exact diagonalization studies on these stripe orders have also been performed [24, 25].
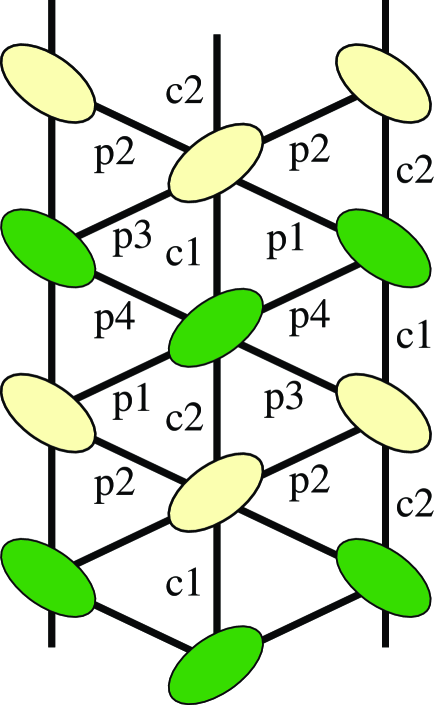
Seo further showed that the horizontal stripe state is much stabler in the phase of the crystal structure than in the phase, where the hopping integrals are modulated as shown in figure 8 [26] In this lattice structure, one-dimensional chains of molecules connected by the large hopping are weakly coupled by other small hoppings. In Seo’s calculation, the competition between the diagonal and horizontal stripe states was subtle, but the resulting effective spin Hamiltonian in the horizontal stripe phase is a quasi-one-dimensional Heisenberg chain along the hopping integral, which explains the Bonner-Fisher type temperature dependence of the magnetic susceptibility [5, 6]. From this viewpoint, Seo concluded that the horizontal stripe ordering is the most probable state in the insulating phase of Rb(SCN)4. This was later confirmed by X-ray experiments [12, 13] as mentioned in the introduction.
4 Competition between stripe and threefold charge correlations
4.1 -axis threefold state
After the seminal study by Seo [16], Mori performed an analysis in the static limit (where the band structure is neglected), and pointed out the possibility of the nonstripe-type charge correlation shown in figure 3 [22], which has threefold periodicity in the -axis direction. We will call this the “-axis threefold” charge correlation. The corresponding wave vector is . In real space, the -axis threefold state is favored when and because this configuration minimizes the energy cost of and , as can be seen from figures 2 and 3.
Kaneko and Ogata extended Seo’s mean field study to take into account the possibility of this -axis threefold state [27]. They found that this state has a lower energy than the vertical, diagonal, and horizontal stripe states when and . Hotta and coworkers used exact diagonalization for a spinless half-filled model, which can be considered as an effective model of -type compounds in the large on-site limit, and they showed the presence of -axis threefold charge correlation for [28, 29].
A variational Monte Carlo study by Watanabe and Ogata [30], and a later density matrix renormalization group study by Nishimoto et al. [31] revealed the phase diagram of the model in - space with and . In the variational Monte Carlo study, the energy of each ordered state was calculated and compared, while in the density matrix renormalization group study, the real-space charge modulation was directly observed. As shown in figure 9, the two approaches give similar results, where the -axis threefold state appears in a regime with between the diagonal () and vertical stripe () regimes.
A random phase approximation (RPA) analysis gives a clear view, in the reciprocal space, as to why the -axis three fold state is favored in the regime, and also why the diagonal stripe is more favored than the horizontal stripe [32]. Within the RPA [33, 34, 35], the charge susceptibility is given as
| (2) |
Here is the bare susceptibility given by
| (3) |
with being the band dispersion given as
| (4) |
and is the Fermi distribution function. When the nesting of the Fermi surface is good, is maximized at the nesting vector. is the Fourier transform of the off-site repulsions, given as
| (5) | |||||
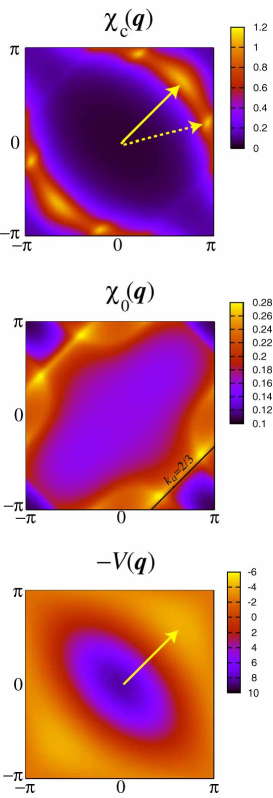
In figure 10, the RPA charge susceptibility for , , , , and is shown. This choice of corresponds to the case of Rb(SCN)4 (=Zn, Co) or CsCo(SCN)4 under pressure. One notices that there is a peak at , which corresponds to in the original Brillouin zone, namely, the modulation wave vector of the -axis threefold correlation. This is due to a peak in near as shown in figure 10. Namely, although is maximized around , the effect of is strong in the denominator of the RPA charge susceptibility eq.(2), thereby minimizing the denominator and maximizing at . In addition to the -axis threefold peak, a subdominant peak also appears around the wave vector close to , i.e., the wave vector of the diagonal stripe. This is due to a combination of two effects: (i) takes large values in the region extending from the nesting vector position toward , and (ii) the region where takes large values tends to extend toward , particularly when . A similar result is also obtained for smaller values of , although the subdominant peak near becomes relatively weaker. Such a two-peak structure has also been found in the dynamical charge correlation function calculated using exact diagonalization, where peaks at low energies are found at and [31].
Udagawa and Motome [36] further investigated the temperature dependence of these peak structures in the charge susceptibility, and showed that the peak is nearly temperature-independent, while the peak near increases in magnitude as the temperature is lowered. This is because the peak is mainly due to the nearest-neighbor electron-electron interaction, while the peak is related to the Fermi surface nesting, which becomes more effective at low temperatures. From this temperature dependence, they claimed that these peaks correspond to the two diffuse X-ray spots observed in Cs(SCN)4 (Co, Zn) [10, 11] (figure 5), although the wave vectors are different.
4.2 Effect of electron-lattice couplings
As seen in the previous section, a purely electronic model on the -type lattice fails to reproduce the horizontal stripe charge correlation observed experimentally. Following the line of Seo’s study [16], Kaneko and Ogata [27] performed a mean-field analysis on the lattice structure, where competition between the -axis threefold state and the horizontal stripe was found to take place.
Tanaka and Yonemitsu took into account Peierls-type electron-lattice couplings, and performed a Hartree-Fock calculation [37]. They showed that the horizontal stripe state is stabilized by a self-consistently determined lattice distortion into the phase when . The stabilization of the horizontal stripe state by electron-lattice coupling has been further supported by an exact diagonalization study by Miyashita and Yonemitsu [38].
Udagawa and Motome included the Su-Schrieffer-Heeger type electron-phonon interaction, which also takes into account the effect of the lattice distortion, and performed a Hartree-Fock calculation [36]. They found that the horizontal stripe state is stable for sufficiently large electron-phonon couplings.
Note that although these calculations succeed in reproducing the horizontal stripe charge correlation, the competing candidates considered therein do not include the -axis threefold correlation observed experimentally.
4.3 -axis threefold charge correlation
As seen in the previous subsections, models that consider only , , and as electron-electron repulsions have a tendency toward the -axis threefold state formation in the realistic parameter regime of . This state competes with the diagonal (horizontal) correlation in the absence (presence) of electron-lattice coupling [39]. Correspondence between the -axis threefold charge correlation and the experimentally observed short range -axis threefold charge correlation has often been discussed, but the wave vectors of the two threefold correlations are different.
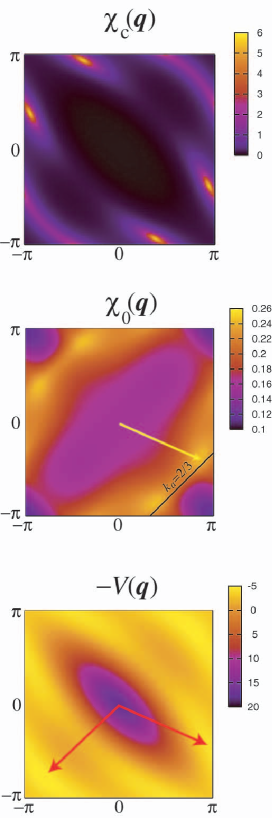
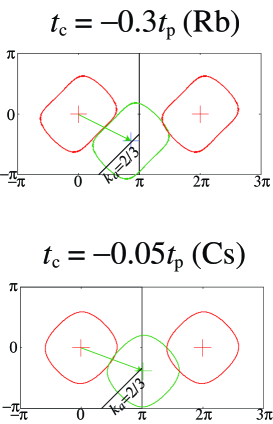
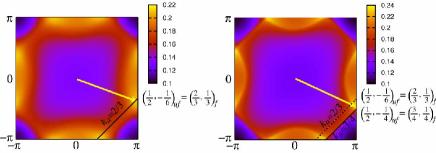
Kuroki performed an RPA analysis on a model that considers the distant interactions , , and in order to investigate the origin of the -axis threefold correlation [32]. In figure 11, the charge susceptibility for is shown, where a peak is found near the -axis threefold correlation wave vectors. Here only the result for certain values of , , and is shown, but in ref. [32] it was found that similar results are obtained within a certain range of , , and values that are smaller than and . This result can be understood as follows. In the presence of the distant interactions, is now broadly maximized in a region that includes the nesting vector position, as shown in figure 11. Therefore, the denominator in eq.(2) is now minimized at a position close to the nesting vector, resulting in a charge susceptibility peak position that nearly coincides with the diffuse X-ray spot positions. As mentioned in the introduction, the relevance of the Fermi surface nesting to the -axis threefold correlation had already been pointed out in ref. [11]. Thus, the -axis threefold charge correlation, within this scenario, should be considered as being conceptually different from the -axis threefold charge ordering in that it is not related to the Fermi surface.
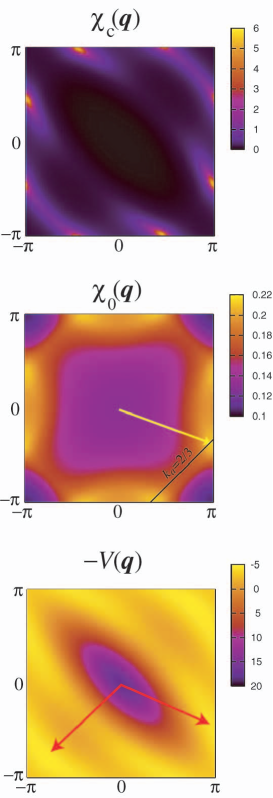
In figure 12, the result for with the other parameters having the same values as those in figure 11 is shown. This choice of corresponds to Cs(SCN)4 at ambient pressure [11]. In this case, the peak position of the charge susceptibility moves toward the unfolded Brillouin zone edge, i.e., closer to , compared with the case when . This is because the nesting vector is closer to , as can be seen in the figure of , which in turn can be understood from the Fermi surface shown in figure 13. This tendency appears to be consistent with the experimental finding that diffuse X-ray spots at high temperatures are observed at in Cs(SCN)4 at ambient pressure, while they are at in Cs(SCN)4 under pressure and in Rb(SCN)4.
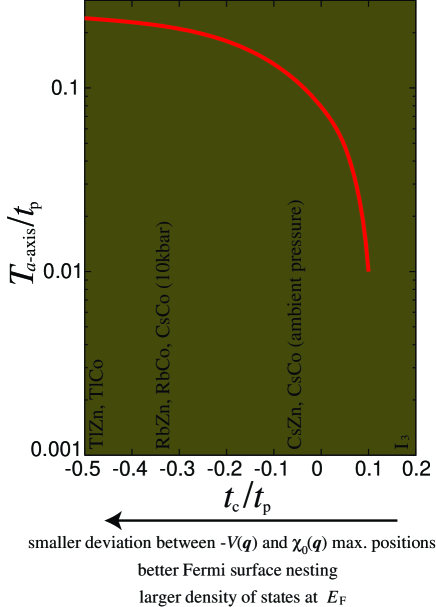
In figure 14 the temperature at which the RPA charge susceptibility diverges at a certain is shown as a function of [32]. decreases with increasing (from to ), and sharply drops when . In fact, the increase in induces several effects. First, the nesting of the Fermi surface is degraded (see figure 13), second, the nesting vector deviates from the region where is maximized, and third, the density of states near the Fermi level becomes smaller. These factors together deteriorate the charge ordering. The decrease in the density of states with increasing has also been pointed out in ref. [40]. Figure 14 is reminiscent of the phase diagram of the -(BEDT-TTF) family obtained by Mori et al. [6], where charge ordering takes place for compounds having large negative such as Rb(SCN)4, while it does not occur for compounds having small or positive [41, 42, 43] such as I3. However, note that in figure 14, the charge susceptibility diverges at a modulation wave vector close to the nesting vector of the Fermi surface (around for ), while the charge ordering temperature in the experimental phase diagram is that for the ordering, i.e., the horizontal stripe state. The resemblance between the two figures suggests a relationship between the horizontal stripe and the -axis threefold correlations. This may also be consistent with an experimental analysis under uniaxial pressure, which concluded that the value of is the key factor that dominates the occurrence of horizontal charge ordering [44]. A possible relation between the -axis threefold and the horizontal stripe orderings will be mentioned in the next subsection.
4.4 Future problems regarding the competition
Since the distant electron-electron interactions , , and are found to be necessary to reproduce the experimentally observed -axis threefold charge correlations, it is reasonable to assume that the related experimental observations have to be understood within such a model.
One problem to be resolved is the temperature dependences of the two diffuse X-ray peaks observed in CsCo(SCN)4 [11]. Since the peak in the charge susceptibility partially originates from the Fermi surface nesting in the scenario described in the previous subsection, the maximum value of the peak increases with decreasing temperature, which is inconsistent with the experimental observation that the X-ray peak corresponding to the -axis threefold charge fluctuation is nearly temperature-independent below 90K [11]. Regarding this problem, it is possible that the anions, which are not taken into account in previously studied models, may play some role. Namely, in the X-ray scattering experiment, diffuse sheets (or planes) along the and the directions are observed at room temperature below, which is considered to be due to the effect of anions (the diffuse sheets are shown in the lower panels of figure 5 and figure 7) [10]. Actually, the wave vectors (-axis three fold) and (horizontal stripe) are on these diffuse sheets, and they “grow” from these sheets as the temperature is lowered, suggesting the relevance of the anions. Kuroki considered the effect of these diffuse sheets phenomenologically by adding a term that enhances the charge susceptibility along the line to the denominator of eq.(2), and he found that the maximum value of the charge susceptibility saturates at low temperatures [45]. This is because the wave vector at which takes its maximum gradually moves away from toward as the temperature is lowered as shown in figure 15 (note that the nesting is less good for the case of CsCo(SCN)4), so that the cooperation between the diffuse sheets and the Fermi surface nesting becomes degraded.
Another problem is the origin of the horizontal stripe charge correlation. As mentioned in the previous sections, in the absence of the distant interactions , , and , the horizontal stripe state is shown to be favored by electron-lattice coupling that distorts the lattice structure into the -type. Nevertheless, it remains a future problem as to whether this conclusion holds in the presence of the distant interactions. Moreover, even if the origin of the horizontal stripe in the Rb salt is the lattice distortion, the development of the horizontal stripe correlation at low temperatures in the Cs salt, where such a distortion has not been observed experimentally, remains puzzling. Related to this point, Kuroki pointed out the possibility that the horizontal stripe charge correlation arises from the -axis threefold correlation [32]. For the case of the Cs salt, although the nesting vector is close to at high temperatures, it moves toward (note that we are adopting the folded Brillouin zone scheme here) upon lowering the temperature as mentioned above. Thus, at low temperatures, we have two different nesting vectors close to and . Their coexistence in the momentum space might result in a modulation having the wave vector , which corresponds to that of the horizontal stripe. This may be considered as a kind of “” correlation in that the wave vectors and are close to the nesting vectors of the Fermi surface, namely, the “” wave vectors at low temperatures. Investigation of the occurrence of the horizontal charge correlation due to the interplay between such a “” correlation and the electron-lattice couplings (including the interaction with anions) will serve as an interesting future area of research.
There are several studies in which the pairing symmetry of superconductivity in I3 has been discussed [30, 32, 35, 46]. Since this superconductivity lies in the vicinity of the charge-ordering phase in Mori’s electronic phase diagram (figure 1), one may expect the occurrence of unconventional superconductivity due to charge fluctuations. In such a case, the form of the gap function strongly depends on the wave vector dependence of the charge fluctuation. For instance, in a model that considers electron-electron interactions up to nearest neighbors, the coexistence of spin and charge fluctuations results in competition between spin-singlet -wave-like pairing and triplet -wave-like pairing [30, 35]. On the other hand, in the model that takes into account the next nearest neighbor interaction, the gap function can be more complicated [32]. Since it can be expected that the many body interactions do not depend strongly on the anions (although the band structure does), one must discuss the pairing symmetry for I3 using a Hamiltonian with appropriate interactions that correctly reproduces the competition between the -axis threefold and the horizontal stripe charge correlations in the case of Rb and Cs salts. In this sense, the superconducting pairing symmetry should be theoretically determined after the origin of the charge correlations is completely understood.
5 Conclusion
In the present paper, we have reviewed theoretical studies on the charge correlations in -(BEDT-TTF)(SCN)4. It now seems clear that within the purely electronic model on the -type lattice with the on-site and the nearest neighbor and interactions, the diagonal stripe, -axis threefold, and vertical stripe charge correlations are favored in the regimes , , and , respectively. In the realistic parameter regime of , there is competition between the -axis threefold state and the diagonal stripe state. Since these are different from the experimentally observed -axis threefold and the horizontal stripe charge correlations, additional effects have to be taken into account to understand the experimental results. The electron-lattice coupling, which tends to distort the lattice into the -type, is found to favor the horizontal stripe state, suggesting that the occurrence of this stripe state in actual materials is not of purely electronic origin.
On the other hand, the inclusion of the electron-lattice coupling does not explain the presence of the short-range -axis threefold charge correlation, and we have to add distant (next-nearest-neighbor) electron-electron repulsions to understand this phenomenon. Related to this point, a transport experiment has indicated that the repulsive interaction in -(BEDT-TTF)Zn(SCN)4 (Cs,Rb) is long-range [47]. In fact, the presence of such a distant interaction has also been pointed out theoretically [48, 49, 51] for quasi-one-dimensional organic compounds (TMTSF)2X in the context of coexisting spin and charge density waves [52, 53] and spin triplet pairing superconductivity [50, 51, 54, 55, 56, 57, 58]. Quite recently, Tahara et al. estimated the electron-electron interaction in -(BEDT-TTF) from a first principles calculation, and also obtained a long ranged interaction [59]. Thus, it is possible that the long-range nature of the electron-electron interaction may be common in these organic materials.
So far there have been few theoretical studies that take into account the distant electron-electron interactions; thus, it is not clear whether competition between the -axis threefold and horizontal stripe states takes place in the presence of electron-lattice couplings in such models. At the present stage, one cannot completely rule out the possibility that strong correlation effects that are not taken into account in RPA or mean-field analysis may result in the horizontal stripe state in the presence of distant interactions. Also, as mentioned in section 4.4, it is possible that the anions, which have not been taken into account in theoretical models so far, play some role in the occurrence of these charge correlations. The minimal theoretical model may be more complicated than expected, and more theoretical study must be carried out to fully understand the physics of charge correlations in -(BEDT-TTF).
References
- [1] Takahashi T, Nogami Y, and Yakushi K 2006 J. Phys. Soc. Jpn. 75 051008.
- [2] Seo H, Merino J, Yoshioka H, and Ogata M 2006 J. Phys. Soc. Jpn. 75 051009.
- [3] The term “charge ordering” is usually used in a sense that it is not related to the Fermi surface, while a “charge density wave” occurs as a result of Fermi surface nesting. As mentioned in the present article, the origin of the experimental observation regarding the charge correlation in -(BEDT-TTF) is still controversial, so that we cannot definitely state whether or not the Fermi surface is related to these phenomena at the present stage. Thus, in the present article, we mainly use the term “charge correlation” when we need to include various possibilities as the origin of these phenomena.
- [4] For a review on the systematic classification of the lattice structure of BEDT-TTF salts, see, for example, Seo H, Hotta C, and Fukuyama H 2004 Chem. Rev. 104 5005.
- [5] Mori H, Tanaka S, Mori T, and Maruyama Y 1995 Bull. Chem. Soc. Jpn. 68 1136.
- [6] Mori H, Tanaka S, and Mori T 1998 Phys. Rev. B 57 12023.
- [7] Mori H 2006 J. Phys. Soc. Jpn. 75 051003.
- [8] Inagaki K, Terasaki I, Mori H, and Mori T 2004 J. Phys. Soc. Jpn. 73 3364.
- [9] Sawano F, Terasaki I, Mori H, Mori T, Watanabe M, Ikeda N, Nogami Y, and Noda Y 2005 Nature 437 522.
- [10] Nogami Y, Pouget J -P, Watanabe M, Oshima K, Mori H, Tanaka S, and Mori T 1999 Synth. Met. 103 1911.
- [11] Watanabe M, Nogami Y, Oshima K, Mori H and Tanaka S 1999 J. Phys. Soc. Jpn. 68 2654.
- [12] Watanabe M, Noda Y, Nogami Y, and Mori H 2004 J. Phys. Soc. Jpn. 73 116.
- [13] Watanabe M, Noda Y, Nogami Y, and Mori H 2005 J. Phys. Soc. Jpn. 74 2011.
- [14] Miyagawa K, Kawamoto A, and Kanoda K 2000 Phys. Rev. B 62 R7679.
- [15] Chiba R, Yamamoto H, Hiraki K, Takahashi T, and Nakamura T 2001 J. Phys. Chem. Solids 62 389.
- [16] Seo H 2000 J. Phys. Soc. Jpn. 69 805.
- [17] Mori H, Tanaka S, Mori T, Kobayashi A, and Kobayashi H 1998 Bull. Chem. Soc. Jpn. 71 797.
- [18] Tajima H, Kyoda S, Mori H and Tanaka S 2001 Synth. Met. 120 757.
- [19] Yamamoto K, Yakushi K, Miyagawa K, Kanoda K, and Kawamoto A 2002 Phys. Rev. B 65 85110.
- [20] Kino H and Fukuyama H 1995 J. Phys. Soc. Jpn. 64 2726.
- [21] Seo H and Fukuyama H 1998 J. Phys. Soc. Jpn. 67 1848.
- [22] Mori T 2003 J. Phys. Soc. Jpn. 72 1469.
- [23] There have also been studies on a model that neglects , such as Hanasaki K and Imada M 2005 J. Phys. Soc. Jpn. 74 2769 or Mckenzie R H, Merino J, Marston J B and Sushkov O P 2001 Phys. Rev. B 64 085109, where strong correlation effects beyond the mean-field level are studied.
- [24] Clay R T, Mazumdar S, and Campbell D K 2002 J. Phys. Soc. Jpn. 71 1816.
- [25] Merino J, Seo H, and Ogata M 2005 Phys. Rev. B 71 125111.
- [26] In the theoretical studies of refs. [27] and [37], the lattice is not presented correctly, but the calculations are performed on the correct lattice. This has been confirmed by private communications with H. Aizawa, Y. Nogami, M. Watanabe, E. Yukawa, M. Ogata, Y. Tanaka, and K. Yonemitsu.
- [27] Kaneko M and Ogata M 2006 J. Phys. Soc. Jpn. 75 014710.
- [28] Hotta C, Furukawa N, Nakagawa A, and Kubo K 2006 J. Phys. Soc. Jpn. 75 123704.
- [29] Hotta C and Furukawa N 2006 Phys. Rev. B 74 193107.
- [30] Watanabe H and Ogata M 2006 J. Phys. Soc. Jpn. 75 063702.
- [31] Nishimoto S, Shingai M, and Ohta Y 2008 Phys. Rev. B 78 035113.
- [32] Kuroki K 2006 J. Phys. Soc. Jpn. 75 114716.
- [33] Kobayashi A, Tanaka Y, Ogata M, and Suzumura Y 2004 J. Phys. Soc. Jpn. 73 1115.
- [34] Scalapino D J, Loh E, and Hirsch J E 1987 Phys. Rev. B 35 6694.
- [35] Tanaka Y, Yanase Y, and Ogata M 2004 J. Phys. Soc. Jpn. 73 319.
- [36] Udagawa M and Motome Y 2007 Phys. Rev. Lett. 98 206405.
- [37] Tanaka Y and Yonemitsu K 2007 J. Phys. Soc. Jpn. 76 053708; 2008 J. Phys. Soc. Jpn. 77 034708.
- [38] Miyashita S and Yonemitsu K 2007 Phys. Rev. B 75 245112.
- [39] In ref. [28], the horizontal stripe is found to be more competitive than the diagonal stripe. Since the spinless fermion model is adopted in this study, this may be the origin of the discrepancy.
- [40] Hotta C 2003 J. Phys. Soc. Jpn. 72 840.
- [41] Mori H, private communications.
- [42] Kobayashi H, Kato R, Kobayashi A, Nishio Y, Kajita K, and Sasaki W 1986 Chem. Lett. 833.
- [43] Tamura M, Yakushi K, Kuroda H, Kobayashi A, Kato R, and Kobayashi H 1988 J. Phys. Soc. Jpn. 57 3239.
- [44] Kondo R, Higa M, Kagoshima S, Hoshino H, Mori T, and Mori H 2006 J. Phys. Soc. Jpn. 75 044716.
- [45] Kuroki K, unpublished.
- [46] Merino J and Mckenzie R H 2001 Phys. Rev. Lett. 87 237002.
- [47] Takahide Y, Konoike T, Enomoto K, Nishimura M, Terashima T, Uji S, and Yamamoto H M 2006 Phys. Rev. Lett. 96 136602.
- [48] Kobayashi N and Ogata M 1997 J. Phys. Soc. Jpn. 66 3356; Kobayashi N, Ogata M, and Yonemitsu K 1998 J. Phys. Soc. Jpn. 67 1098.
- [49] Tomio Y and Suzumura Y 2000 J. Phys. Soc. Jpn. 69 796.
- [50] For a review, e.g., Kuroki K 2006 J. Phys. Soc. Jpn. 75 051013.
- [51] Tanaka Y and Kuroki K 2004 Phys. Rev. B 70 060502.
- [52] Pouget J -P and Ravy S 1996 J. Phys. I 6 1501.
- [53] Kagoshima S, Saso Y, Maesato M, Kondo R, and Hasegawa T 1999 Solid State Commun. 110 479.
- [54] Kuroki K, Arita R, and Aoki H 2001 Phys. Rev. B 63 094509.
- [55] Kuroki K and Tanaka Y 2005 J. Phys. Soc. Jpn. 74 1694.
- [56] Fuseya Y and Suzumura Y 2005 J. Phys. Soc. Jpn. 74 1263.
- [57] Nickel J C, Duprat R, Bourbonnais C, and Dupuis N 2005 Phys. Rev. Lett. 95 247001.
- [58] Aizawa H, Kuroki K, and Tanaka Y 2008 Phys. Rev. B 77 144513.
- [59] Tahara D, Nakamura K, and Imada M 2008 Physical Society of Japan Meeting September.