Suzaku Spectroscopy of Vela Shrapnel B
Abstract
We present the X-ray observation of Vela shrapnel B with the XIS on board the Suzaku satellite. The shrapnel is one of several ejecta fragment-like features protruding beyond the primary blast wave shock front of the Vela supernova remnant. The spectrum of shrapnel B is well-represented by a single-temperature thin-thermal plasma in a non-equilibrium ionization state. The elemental abundances of O, Ne, and Mg are found to be significantly higher than the solar values, supporting that shrapnel B originates from supernova ejecta. The abundances of O, Ne, and Mg relative to Fe are enhanced above their solar values, while that of Si relative to Fe are at their solar values. This abundance pattern is similar to that in shrapnel D, except that the enhancements of the lighter elements are less prominent, suggesting more extensive mixing with the interstellar medium (ISM) in shrapnel B. The contribution of the ISM is considered to be larger at the trailing region, because the absolute abundances of some elements there are depleted relative to those at the shrapnel’s head.
Subject headings:
ISM: individual (Vela SNR) — supernova remnants — X-rays: ISM1. Introduction
Supernova (SN) explosions are prominent phenomena through which heavy elements are released into interstellar space. The ejected materials often constitute fragments, or ejecta knots, although their creation mechanism has not been well-understood. In fact, such fragments of ejecta have been discovered from several supernova remnants (SNRs): e.g., Tycho (Decourchelle et al. 2001), Cas A (Laming & Hwang 2003; Fesen et al. 2006), Pup A (Winkler & Kirshner 1985; Katsuda et al. 2008), and G292.0+1.8 (Park et al. 2007). As mentioned below, the Vela SNR (catalog ) is also one of the most interesting SNRs from which some candidates of ejecta fragments can be observed.
The Vela SNR is considered to be the remnant of a Type II-P SN explosion of the progenitor star with the mass of 25 (Gvaramadze 1999). The age of the SNR has been estimated to be yr from the spin down rate of PSR B0833–45 (the Vela pulsar: Taylor et al. 1993), which is associated with the SNR (e.g., Weiler & Sramek 1988). Since this SNR has the largest angular size (: Aschenbach et al. 1995; Lu & Aschenbach 2000) among observable SNRs, it is a very ideal target for studying the detailed structure of an old SNR.
Aschenbach et al. (1995) observed the entire Vela SNR in the ROSAT all-sky survey, and discovered six isolated fragment-like features, named “shrapnels” A to F, which have overrun the primary blast wave shock boundary. The opening angles of the shrapnels’ bow-shock features suggest them to be supersonically moving in tenuous ambient matter. The symmetry axis of each shrapnel traces back to the center of the SNR, which is very close to the Vela pulsar. Such a configuration suggests that the shrapnels are associated with the fossil material of the SN explosion; they had probably traveled behind the blast wave for a long time and passed its front at the late stage when the blast wave had decelerated. If they are really the clumps of the SN ejecta, it is expected that the chemical compositions of the shrapnels are abundant in heavy elements. Therefore, some of the shrapnels have been studied to reveal the metal abundances using several recent X-ray missions.
Shrapnel A is the most well-investigated one. Tsunemi et al. (1999a) observed the shrapnel with ASCA, and found a strong Si K-shell emission line with relatively weak emission from other elements. Then, the Chandra and XMM-Newton observations confirmed that the shrapnel is significantly over-abundant in Si, while the other elements, i.e., O, Ne, Mg, and Fe, have solar or sub-solar abundances (Miyata et al. 2001; Katsuda & Tsunemi 2006: hereafter KT06). They thus concluded that shrapnel A originated from a deep (Si-rich) layer of the progenitor star. The relative abundances among the heavy elements were found to be almost uniform in the entire shrapnel.
On the other hand, the ASCA spectra of shrapnel D, which is the brightest and largest among the six shrapnels, indicated over-abundances of O, Ne, and Mg (Tsunemi et al. 1999b). Using XMM-Newton, Katsuda & Tsunemi (2005; hereafter KT05) confirmed that the abundance ratios of O-Ne-Mg to Fe are significantly larger than solar, which is consistent with the view that this shrapnel is a fragment of the ejecta from a shallow layer of the progenitor.
Interestingly, several bright ejecta knots have been discovered in the northern part of the Vela SNR by the recent XMM-Newton observations (Miceli et al. 2008). They suggested that these knots would be “new” shrapnels hidden inside the Vela main shell by the projection effect. The relative abundances of these knots were found to be quite similar to those observed in shrapnel D; O, Ne, and Mg were much more abundant than those of the other elements.
Shrapnel B is another candidate of the ejecta fragment discovered with ROSAT all-sky survey, and the second brightest next to shrapnel D (Aschenbach et al. 1995). Although it was observed with ASCA, the elemental abundances could not be determined due to the poor photon statistics (Tsunemi et al. 1999b). In this paper, therefore, we investigate the chemical and physical properties of shrapnel B, by analyzing high quality spectral data obtained with Suzaku. In §2, we introduce the observation and data reduction procedure. The results of our analysis are presented in §3. Finally, we develop the discussion and summarize our findings in §4 and §5, respectively. We assume the distance to the Vela SNR to be 250 pc, following Cha et al. (1999). The errors quoted in the text and tables are at the 90% confidence level, and the error bars in the figures are for 1 confidence, unless otherwise noted.
2. Observation and Data Reduction
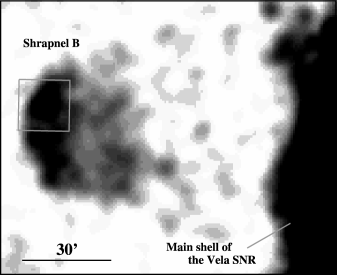
The 0.5–1.3 keV ROSAT PSPC image of shrapnel B (Figure 1) shows a clear bow shock structure. A part of Vela shrapnel B was observed by Suzaku on 2006 November 5–7 (Observation ID = 501085010). The field of view (FOV) of the observation is shown in the image of the entire region of shrapnel B.
In this paper, we concentrate on the data obtained with the X-ray Imaging Spectrometer (XIS: Koyama et al. 2007) on board Suzaku. The XIS consists of four X-ray charge coupled devices (CCD) at the foci of the four X-Ray Telescopes (XRT; Serlemitsos et al. 2007). All four XRTs are co-aligned to image the same region of the sky. The half-power diameter (HPD) of the XRT is , independent of the X-ray energy. Three of the CCDs (XIS0, 2, and 3) are Front-Illuminated (FI) sensors and the fourth (XIS1) is Back-Illuminated (BI). The latter has superior sensitivity in the 0.2–1.0 keV band with a significantly improved energy resolution compared to previous X-ray CCD cameras.
The XIS were operated in the normal full-frame clocking mode with spaced-row charge injection (SCI) technique (Uchiyama et al. 2008). For the following data reduction, the HEADAS software of version 6.5 was used. We employed the revision 2.0 data products, but reprocessed the data using the xispi software and the makepi files of 20080905. These files include the latest calibration results for the charge transfer inefficiency (CTI) and gain. We cleaned the reprocessed data following the standard screening criteria111http://heasarc.nasa.gov/docs/suzaku/processing/criteria_xis.html and obtained an effective exposure time of 58 ksec. Although all four sensors were active at the time of the observation, the XIS2 became inoperable soon after the use of the SCI technique. The energy scale of the XIS2 for the SCI-on mode was therefore not well calibrated (Uchiyama et al. 2008) and we do not use the data obtained by the XIS2 in the subsequent analysis.
3. Analysis and Results
3.1. Image
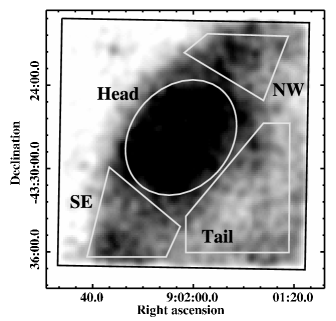
Figure 2 shows the XIS image in the 0.5–2.0 keV band. No significant diffuse emission is found above 2 keV, which suggests that the shrapnel is dominated by soft X-rays. An image of the non X-ray background (NXB) in the same energy band was obtained using the xisnxbgen software and subtracted from the raw image. The NXB data were constructed from the night-Earth database by sorting on the geomagnetic cut-off rigidity. The NXB-subtracted image was then divided by the exposure map constructed with the xissim software to correct for vignetting.
In this image, we can see the clear ridge structure of the shrapnel. The diffuse emission is the brightest at the center of the FOV and extends to the northwest and southeast. It is also extended to the opposite side of the rim (toward the main shell of the Vela SNR), although its surface brightness there is lower than in the other regions. Similar trailing features are found in shrapnels A and D (Miyata et al. 2001; KT05; KT06).
3.2. Spectrum
For a quantitative study of the physical properties, we extracted the XIS spectra from several regions indicated with solid lines in Figure 2—hereafter, “Head”, “Tail”, “NW”, and “SE”. We analyzed the spectra using XSPEC version 11.3.2, with the response matrix files (RMF) and ancillary response files (ARF) made using with the xisrmfgen and xissimarfgen software.
3.2.1 Background subtraction
Although there is a source-free region at the east edge of the FOV, it is too small to obtain a background spectrum with sufficient photon statistics. Therefore, we used “blank sky” data to estimate the background emission. The most suitable blank sky observation for our data is the offset observation for RX J0852–4622 (Obs. date = 2005 December 23, Obs. ID = 500010020), whose aim point (RA, Dec) = (9h00m31s, –43∘28′36′′) is only degrees from Vela shrapnel B. We applied the same data-screening criteria as we did for the shrapnel B data, obtaining an exposure time of ksec. To minimize the uncertainty due to the background subtraction, the background spectra were taken from the same detector coordinates as the source regions.
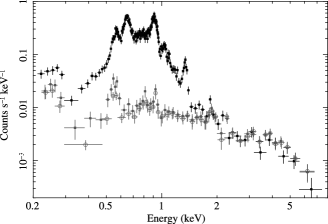
It is known that the energy resolution of the XIS is gradually degrading due to radiation damage while in orbit (Koyama et al. 2007). Also, the efficiency for the detection of soft X-rays has decreased because of the build-up of the contaminating material on the optical blocking filters (OBF) of the XIS due to out-gassing from the satellite. Since these effects vary with the time, we examined the differences in the XIS performance for the shrapnel B and blank sky observations. We found that the difference in energy resolution is negligible, at eV and eV (FWHM) at 0.5 keV for the shrapnel B and blank sky data, respectively. On the other hand, the column density of the accumulated contaminant (at the center of the CCDs) during each observation shows some differences as shown in Table 1. For the XIS0 and 1, the extinction column densities at the time of the source observation are twice as large as those for the blank sky, so there should be taken properly into account. We thus applied the following procedure before the background subtraction: (1) The NXB data from the same detector regions were subtracted from both of the source and blank sky spectra. (2) The NXB-subtracted spectra of the blank sky were corrected by multiplying the ratios between the efficiencies during the source and blank sky observations. For example, we show in Figure 3 the result for the Head region. The black and gray data points with filled squares are the NXB-subtracted XIS1 spectra from the source and blank sky data, respectively. After the efficiency correction, the blank sky spectrum is given as the gray crosses with open circles. The count rate of the soft X-rays (below keV) was significantly reduced, while that of the hard X-rays was not changed much.
| Observation (Date) | Contaminant | XIS0 | XIS1 | XIS3 |
|---|---|---|---|---|
| Vela shrapnel B | C ( cm-2) | 3.19 | 4.14 | 5.75 |
| (2006-11-05) | O ( cm-2) | 5.32 | 6.89 | 9.59 |
| RX J0852–4622 offset | C ( cm-2) | 1.53 | 2.20 | 4.45 |
| (2005-12-23) | O ( cm-2) | 2.55 | 3.66 | 7.41 |
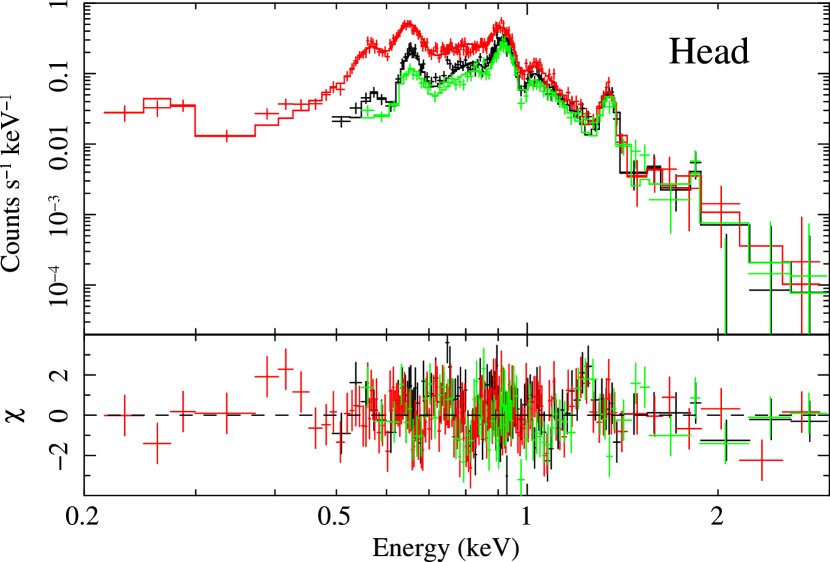
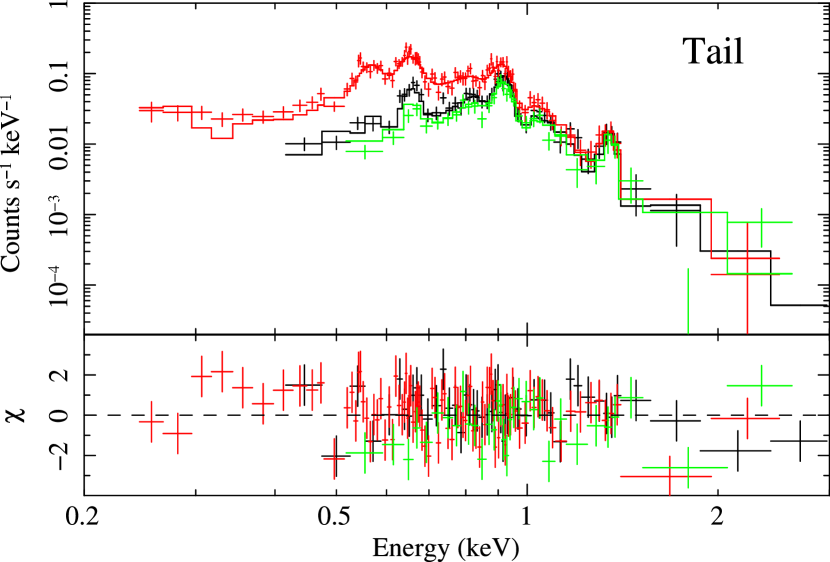
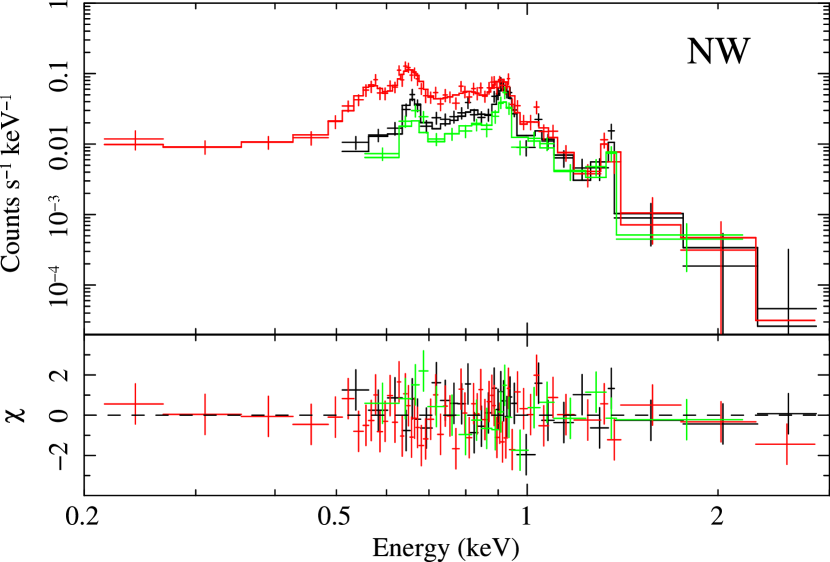
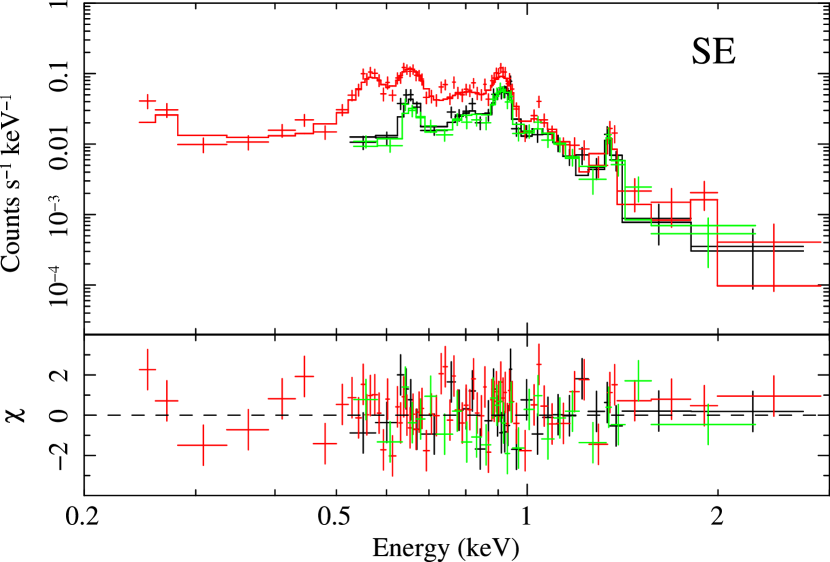
The background-subtracted spectrum of each region was obtained as shown in Figure 4. Several K-shell emission line blends, including OVII ( keV), OVIII ( keV), NeIX ( keV), NeX ( keV), and MgXI ( keV) were clearly resolved in each spectrum, clearly indicating origin in the optically thin-thermal plasma of the shrapnel.
3.2.2 Head region
| Parameter | Head | Tail | NW | SE |
|---|---|---|---|---|
| ( cm-2) | 1.3 (0.6–2.3) | 1.3 (fixed) | 1.3 (fixed) | 1.3 (fixed) |
| (keV) | 0.61 (0.55–0.68) | 0.69 (0.61–0.81) | 0.53 (0.43–0.66) | 0.75 (0.58–0.98) |
| O (solar) | 1.7 (1.3–2.2) | 0.77 (0.63–0.94) | 1.4 (0.9–1.9) | 1.3 (0.9–2.1) |
| Ne (solar) | 4.4 (3.5–5.8) | 1.8 (1.5–2.3) | 3.7 (2.3–6.7) | 3.2 (2.2–5.2) |
| Mg (solar) | 2.9 (2.3–4.0) | 1.3 (1.0–1.9) | 3.5 (2.0–5.3) | 2.6 (1.6–4.3) |
| Si, S (solar) | 1.5 (0.7–2.5) | 1.9 (1.2–2.9) | 3.4 (1.2–7.2) | 4.1 (2.3–5.7) |
| Fe, Ni (solar) | 1.4 (1.1–1.8) | 0.79 (0.63–0.98) | 1.4 (0.8–2.6) | 1.1 (0.8–1.9) |
| ( cm-3 s) | 4.2 (3.5–5.1) | 5.1 (3.6–8.5) | 3.4 (2.4–5.8) | 2.5 (1.7–3.6) |
| EMaaEmission measure (EM = ), where , , and are the electron and proton densities and the plasma depth, respectively. ( cm-5) | 3.6 (2.7–4.9) | 2.4 (2.0–2.9) | 2.7 (1.4–5.0) | 2.0 (1.1–2.9) |
| bbX-ray luminosity in the 0.2–2.0 keV band. ( ergs s-1) | 16.2 | 7.9 | 4.0 | 5.4 |
| /d.o.f. | 370/318 | 208/168 | 91/102 | 149/120 |
We first fitted the spectra of the Head region with a model for an absorbed optically thin-thermal plasma in collisional ionization equilibrium (CIE) (VAPEC: Smith et al. 2001). The absorption column density (), electron temperature (), and emission measure (EM) were treated as free parameters. The elemental abundances relative to the solar values (Anders & Grevesse 1989) of O, Ne, Mg, Si, and Fe were also allowed to vary freely. The abundances of S and Ni were linked to those of Si and Fe respectively, while those of the other elements were fixed to the solar values. Since the absolute gain of the XIS has a small uncertainty of eV (Koyama et al. 2007; Uchiyama et al. 2008), we allowed for a small offset in the photon-energy to the pulse-height gain relationship. With this model, we obtained a best-fit with keV and /d.o.f. = 428/319.
Although the spectra were relatively well reproduced by the CIE model, we also fitted a non-equilibrium ionization plasma model (VNEI with NEIvers 2.0: Borkowski et al. 2001). The ionization timescale (), where and are electron density and the time since the plasma was heated, was an additional free parameter in these models. Given that the value of /d.o.f. was significantly reduced to 370/318 (F-test probability was less than ), we considered that the NEI model better represents the Head spectra. The best-fit parameters and model are given in Table 2, and Figure 4 (top left), respectively. A relatively large disagreement between the data and model was found around 1.2 keV, which can be attributed to Fe-L emission lines missing in the plasma code (e.g., Brickhouse et al. 2000). The above fitting process required a gain offset of 4.4 eV only for the XIS1, which is within the allowable range. Although we also tried to fit the spectra by fixing the abundances of C and N to that of O, the result did not change significantly. The Ne and Mg abundances are enhanced by a factor of a few above the solar values. Although it is less prominent, the O is also over-abundant than the solar at a 3 confidence level.


3.2.3 Tail, NW, and SE regions
We next analyzed the spectra of the Tail region using the same model and assumption as for the Head region. We found that the best-fit result required a low interstellar absorption of cm-2 (the best-fit value was pegged at zero). This may be due to incomplete calibration information for the contamination layer on the OBF at the large off-axis angle region (Koyama et al. 2007). We thus fixed the column density to the best-fit value of the Head region ( cm-2) and fitted again. We obtained an acceptable result (/d.o.f. = 208/168) as given in Table 2. We note that all the parameter values are fully consistent with those derived for the case of was freely fitted. The elemental abundances of the Tail region are found to be significantly lower than those of the Head region, except for Si. If we fit the Tail spectrum fixing the abundances to the best-fit values for the Head region given in Table 2, the fit was statistically worse (/d.o.f. = 270/173) based on an F-test (probability of ), and thus was rejected. We therefore conclude that the abundances of some elements at the Tail region are really depleted relative to those at the Head region.
The spectra of the NW and SE regions were also fitted with the fixed. The best-fit parameters (listed in Table 2) were found to be consistent with those of the Head region, so that the elemental abundances are consistent with the values for the Head. Freely fitting the did not change these results, although the best-fit values were unreasonably low probably due to the same reason seen in the Tail spectrum.
4. Discussion
4.1. Chemical Composition
We have measured enhanced abundances of the heavy elements in Vela shrapnel B, for the first time, strongly supporting that shrapnel B is an ejecta fragment (originating from the explosion of the Vela SN), similar to shrapnels A and D (KT05; KT06). We note, however, that it is difficult to determine the absolute values of the elemental abundances, because the bremsstrahlung associated with high- ions contributes significantly to the continuum emission. Indeed, if we fix the O abundance to be 10 times solar and fit the Head spectrum, we obtain an acceptable /d.o.f. value of 409/319.
The derived relative abundances among the heavy elements are much more reliable, since they are mainly determined from the intensity ratios of the emission lines. Figure 5 shows the confidence contours for the abundances of O, Ne, Mg, and Si against that of Fe, derived from the spectrum of the Head region. We can see that the abundance ratios of Ne/Fe and Mg/Fe are enhanced over the solar values. Furthermore, the O/Fe ratio is also higher than unity at 99% confidence. These results match the nucleosynthesis yields of core-collapse SNe (e.g., Thielemann et al. 1996) rather than thermonuclear Type Ia SNe (e.g., Iwamoto et al. 1999). The obtained relative abundances (with 90% error) for the Head region are listed in Table 3, along with those for shrapnels A and D (KT05; KT06), for comparison. Shrapnel A is obviously dominated by Si, while shrapnel D is abundant in O, Ne, and Mg, which are synthesized exterior to the Si-rich layer of the progenitor. The abundance pattern of shrapnel B is relatively similar to those found in shrapnel D, except that the over-abundances of the lighter elements are less prominent. This suggests more significant mixing with the interstellar medium (ISM) in shrapnel B than in shrapnel D. The same interpretation has been advanced argued for some ejecta knots discovered around the northeast rim of the Vela SNR (Miceli et al. 2008) that have abundance patterns very similar to those of shrapnel B.
We find that the absolute abundances of O, Ne, and Mg in the Tail region are significantly lower than those in the Head and the other regions. This suggests that the contribution of the ISM is larger at the Tail region than elsewhere. Note that the FOV of the Suzaku observation covers a very limited portion of the shrapnel (see Figure 1). In order to investigate the more detailed spatial distribution of the elemental abundances, we need to observe a larger area of shrapnel B. This will help us to separate the ejecta and ISM components more clearly.
| Shrapnel BbbThe values for the Head region. | Shrapnel AccKatsuda & Tsunemi (2006). | Shrapnel DddKatsuda & Tsunemi (2005); Note that the Si abundance is assumed to be solar. | |
|---|---|---|---|
| O/Fe | 1.2 (1.1–1.3) | 0.4 | 4.6 |
| Ne/Fe | 3.1 (2.8–3.5) | 1.1 | 9.8 |
| Mg/Fe | 2.1 (1.7–2.4) | 1.0 | 10 |
| Si/Fe | 1.1 (0.4–1.8) | 3.8 | 0.7 |
4.2. Plasma Properties
The spectra from all the regions are found to be reproduced well by a NEI plasma model with a single electron temperature of keV. The obtained value is on the order of cm-3 s, which indicates that the plasma is far from CIE. The ROSAT study showed that the electron temperature of shrapnel B was keV (Aschenbach et al. 1995), which is significantly lower than our result. The ASCA study also derived a lower temperature of keV (Tsunemi et al. 1999b). These inconsistencies probably arise because the previous studies applied the CIE plasma model. Indeed, we obtain a similarly low temperature from the Suzaku spectrum using CIE models (see §3.2.2). The sum of the luminosities of the four regions is ergs s-1 in the 0.2–2.0 keV band. The ROSAT PSPC image (Figure 1) shows that the flux in the XIS FOV is of that of the entire shrapnel so that the total luminosity of shrapnel B is estimated to be ergs s-1.
Assuming an axially symmetric structure for the shrapnel, the emission depth of the plasma is roughly estimated to be cm at a distance of 250 pc. Therefore, using the best-fit elemental abundances given in Table 2, the EM of the Head and Tail regions correspond to the proton densities of 0.06 cm-3 and 0.05 cm-3, respectively. (A homogeneous density distribution is also assumed here.) These values are lower than the typical density of shrapnel D ( cm-3: KT05), which is generally consistent with our interpretation that shrapnel B is more significantly mixed with the ISM than is shrapnel D. For the Head region, the plasma mass is estimated to be , while the mass of the heavy elements is . Assuming a volume for the entire shrapnel of cm3 and a uniform density of 0.05 cm-3, the total mass in shrapnel B is . This is comparable to that of shrapnel A (Tsunemi et al. 1999a; KT06), although shrapnel B’s angular size is much larger. We note, however, that the plasma mass depends on the absolute abundances of heavy elements, which are difficult to determine the metal-rich plasma such as those in the Head region (as mentioned in §4.1). If we assume that the plasma is composed purely of metals (without H and He), the mass of the Head region decreases to .
For shrapnels A and D, the electron temperatures were found to decrease gradually toward the trailing regions of the fragments (KT05; 06). If the shrapnels are simply breakout features out of the blast wave, the temperature observed is expected to increase toward the center of the explosion. Therefore, KT06 argued that the higher temperature at the head regions supports the ejecta origin of the shrapnels. However, we do not find any significant temperature variation between the Head and Tail regions of shrapnel B. Follow-up observations of this shrapnel with a deep exposure and a large FOV are required to conclusively reveal the distribution.
5. Summary
We have analyzed Suzaku data of Vela shrapnel B. Utilizing the good sensitivity and spectroscopic performance of the XIS, we clearly detect several emission line blends from highly ionized heavy elements. The spectrum of the Head region is well fitted with an NEI plasma with an electron temperature of keV. The abundances of some heavy elements are found to be significantly enhanced above the solar values. This result strongly suggests that shrapnel B originates from the ejecta of the Vela SN. The abundances of O, Ne, and Mg relative to Fe are higher than the solar ratios. Shrapnel B can therefore be identified with the outer layer of the progenitor, similar to shrapnel D. However, the over-abundances of the lighter elements are less prominent than for shrapnel D, indicating that shrapnel B has been mixed with a larger mass of ISM than shrapnel D. The spectrum from the Tail region is reproduced by a similar model as the Head region, but with significantly lower absolute abundances of O, Ne, and Mg. This indicates a relatively large contribution from swept-up ISM for the Tail region. No significant temperature variation between the Head and the Tail regions is found. The total luminosity (in 0.2–2.0 keV band) and mass of the entire shrapnel are estimated to be ergs s-1, and , respectively.
References
- Anders & Grevesse (1989) Anders, E., & Grevesse, N. 1989, Geochim. Cosmochim. Acta, 53, 197
- Aschenbach et al. (1995) Aschenbach, B., Egger, R., & Trumper, J. 1995, Nature, 373, 587
- Borkowski et al. (2001) Borkowski, K. J., Lyerly, W. J., & Reynolds, S. P. 2001, ApJ, 548, 820
- Brickhouse et al. (2000) Brickhouse, N. S., Dupree, A. K., Edgar, R. J., Liedahl, D. A., Drake, S. A., White, N. E., & Singh, K. P. 2000, ApJ, 530, 387
- Cha et al. (1999) Cha, A. N., Sembach, K. R., & Danks, A. C. 1999, ApJ, 515, L25
- Decourchelle et al. (2001) Decourchelle, A., et al. 2001, A&A, 365, L218
- Fesen et al. (2006) Fesen, R. A., et al. 2006, ApJ, 636, 859
- Gvaramadze (1999) Gvaramadze, V. 1999, A&A, 352, 712
- Iwamoto et al. (1999) Iwamoto, K., Brachwitz, F., Nomoto, K., Kishimoto, N., Umeda, H., Hix, W. R., & Thielemann, F.-K. 1999, ApJS, 125, 439
- Katsuda et al. (2008) Katsuda, S., Mori, K., Tsunemi, H., Park, S., Hwang, U., Burrows, D. N., Hughes, J. P., & Slane, P. O. 2008, ApJ, 678, 297
- Katsuda & Tsunemi (2006) Katsuda, S., & Tsunemi, H. 2006, ApJ, 642, 917
- Katsuda & Tsunemi (2005) Katsuda, S., & Tsunemi, H. 2005, PASJ, 57, 621
- Koyama et al. (2007) Koyama, K., et al. 2007, PASJ, 59, 23
- Laming & Hwang (2003) Laming, J. M., & Hwang, U. 2003, ApJ, 597, 347
- Lu & Aschenbach (2000) Lu, F. J., & Aschenbach, B. 2000, A&A, 362, 1083
- Miceli et al. (2008) Miceli, M., Bocchino, F., & Reale, F. 2008, ApJ, 676, 1064
- Miyata et al. (2001) Miyata, E., Tsunemi, H., Aschenbach, B., & Mori, K. 2001, ApJ, 559, L45
- Park et al. (2007) Park, S., Hughes, J. P., Slane, P. O., Burrows, D. N., Gaensler, B. M., & Ghavamian, P. 2007, ApJ, 670, L121
- Serlemitsos et al. (2007) Serlemitsos, P. J., et al. 2007, PASJ, 59, 9
- Smith et al. (2001) Smith, R. K., Brickhouse, N. S., Liedahl, D. A., & Raymond, J. C. 2001, ApJ, 556, L91
- Taylor et al. (1993) Taylor, J. H., Manchester, R. N., & Lyne, A. G. 1993, ApJS, 88, 529
- Thielemann et al. (1996) Thielemann, F.-K., Nomoto, K., & Hashimoto, M.-A. 1996, ApJ, 460, 408
- Tsunemi et al. (1999a) Tsunemi, H., Miyata, E., & Aschenbach, B. 1999a, PASJ, 51, 711
- Tsunemi et al. (1999b) Tsunemi, H., Miyata, E., Hiraga, J., & Aschenbach, B. 1999b, Highlights in X-ray Astronomy, 310
- Uchiyama et al. (2008) Uchiyama, H., et al. 2008, arXiv:0810.0873 (accepted by PASJ)
- Weiler & Sramek (1988) Weiler, K. W., & Sramek, R. A. 1988, ARA&A, 26, 295
- Winkler & Kirshner (1985) Winkler, P. F., & Kirshner, R. P. 1985, ApJ, 299, 981