An Imaging and Spectroscopic Study of Four Strong Mg II Absorbers Revealed By GRB 060418
Abstract
We present results from an imaging and spectroscopic study of four strong Mg II absorbers of Å revealed by the afterglow of GRB 060418 at . These absorbers, at and , exhibit large ion abundances that suggest neutral gas columns characteristic of damped systems. The imaging data include optical images obtained using LRIS on the Keck I telescope and using ACS on board HST, and near-infrared -band images obtained using PANIC on the Magellan Baade Telescope and -band images obtained using NIRC2 with LGSAO on the Keck II telescope. These images reveal six distinct objects at of the afterglow’s position, two of which exhibit well-resolved mature disk morphology, one shows red colors, and three are blue compact sources. Follow-up spectroscopic observations using LRIS confirm that one of the disk galaxies coincides with the Mg II absorber at . The observed broad-band spectral energy distributions of the second disk galaxy and the red source indicate that they are associated with the absorbers at and , respectively. These results show that strong Mg II absorbers identified in GRB afterglow spectra are associated with typical galaxies of luminosity at impact parameter of kpc. The close angular separation would preclude easy detections toward a bright quasar. Finally, we associate the remaining three blue compact sources with the GRB host galaxy, noting that they are likely star-forming knots located at projected distances of kpc from the afterglow. At the afterglow’s position, we derive a 2- upper limit to the underlying SFR intensity of 0.0074 M⊙ yr-1 kpc-2.
1. Introduction
Quasars (QSOs) have long been exploited as bright, continuum sources with absorption-line spectra that can reveal the presence of intervening gas at high redshifts (Rauch et al. 1997; Wolfe et al. 2005). A subset of these absorbing systems offers the opportunity to study the halo gas and interstellar medium (ISM) of galaxies at a large range of evolutionary stages, independent of stellar luminosity. Spectroscopy of the optical afterglows of gamma-ray bursts (GRBs) has recently become an exciting alternative to quasar absorption line studies. The transient nature of GRB afterglows enables a more sensitive and systematic search for the stellar component of the GRB host, as well as any absorbing systems serendipitously aligned along that sightline. In contrast with quasar studies (where photons from the central source have ample time to illuminate the gas and dust along the line of sight), this presents an opportunity to compare the stellar and gaseous properties of high-redshift galaxies at a variey of galactocentric radii.
From detailed studies of gaseous properties alone, much insight has been gained about galaxy formation and gas dynamics in the early universe. Prochaska & Wolfe (1997) challenged the standard picture of galaxy formation (e.g. Kauffmann 1996; Mo et al. 1998) when they demonstrated that the neutral gas in damped Ly (DLA) systems of (e.g. Wolfe et al. 2005) exhibited kinematics favoring rotational dynamics, but with velocity widths too large to have arisen from overdensities in a universe filled with cold dark matter. Subsequent numerical simulations revealed that velocity fields from infall, accretion, and turbulence may also contribute to apparent rotation in the merging clumps of protogalaxies (Haehnelt et al. 1998). In addition to motions related to gravitational dynamics, some models of quasar absorption line systems (e.g. Mg II systems) invoke superwinds and outflows, especially to describe the most extreme velocity fields observed (Nulsen et al. 1998; Bond et al. 2001; Bouché et al. 2007).
While contributing significantly to our understanding of gas dynamics in and about galaxies, these past works share one commonality: they draw conclusions almost entirely from absorption properties. The primary difficulty is in associating a certain absorption spectrum with the appropriate galaxy, as seen in emission. Indeed, without the knowledge of a system’s stellar properties such as the systemic velocity, which is usually measured from nebular emission lines, it is difficult to distinguish between models involving the organized motion of outflows (Dong et al. 2003; Cox et al. 2006) and models that include virialized motions and gravitational accretion (Mo & Miralda-Escude 1996; McDonald & Miralda-Escudé 1999). Nevertheless, without a robust connection of a particular galaxy to a particular absorption spectrum, one cannot test claims of starbursts and superwinds against a galaxy’s morphology, luminosity, and color.
Such studies, however, are just beginning to be explored. While DLAs are known to exist, only a handful have been found (Møller et al. 2002; O’Meara et al. 2006) at redshifts . At , a larger sample of known DLA absorbing galaxies has been established (Rao et al. 2003; Chen & Lanzetta 2003), although roughly 40% of the low-redshift DLA population remain unidentified with their stellar counterpart. Likewise, the nature of the galaxies associated with strong Mg II absorption systems ( Å) detected along quasar sightlines has recently been scrutinized with a similar success rate (e.g. Bouché et al. 2007). Historically, the presence of a bright quasar has made it exceedingly difficult to detect the stellar counterparts of high-column-density absorbers along the sightline. The sample of known absorbing galaxies is inherently biased toward higher luminosities and higher impact parameters with a median angular distance to the background QSO of for known DLA galaxies ([e.g. Chen & Lanzetta 2003) and for strong Mg II absorbing galaxies ([e.g. Bouché et al. 2007). This inhearent bias makes the absorbers notoriously difficult to unambiguously identify. Yet these systems are crucial to our understanding of the baryonic content of galactic halos, and can help discriminate between competing scenarios for the nature of extended gas (e.g. Chen & Tinker 2008). The use of a transient GRB afterglow as the bright background source is one remedy to these past difficulties. The Swift satellite (Gehrels et al. 2004) has thus revolutionized the study of high-redshift starforming galaxies, having detected approximately 300 GRBs, of which were localized through their optical transients.
Immediate spectroscopic and imaging follow-up campaigns, as well as late-time deep imaging observations, are equally crucial to fully leverage such a fortuitous occurence. In recent years, dedicated campaigns have resulted in significant advancements in our understanding of the progenitors and host galaxies of GRBs. Early-time, spectroscopic follow-up observations have revealed the detailed chemical abundances and approximate dust contents and star formation histories of GRB hosts, through measurements of abundance ratios such as and (Savaglio 2006; Prochaska et al. 2007b). In addition, analysis of the time evolution of Fe II and Ni II excited and metastable populations has proven to be an excellent measure of the distance to the neutral gas along the sightline (Prochaska et al. 2006; Dessauges-Zavadsky et al. 2006; Vreeswijk et al. 2007); such analysis makes use of the UV-pumping of the kpc environment by the GRB itself to unambiguously identify the redshift of the host galaxy. Studies of the morphologies of GRB host galaxies, and of the offsets between GRB afterglows and the light of the putative host galaxy (Bloom et al. 2002) have hinted that GRB progenitors may be more massive than the progenitors of core-collapse supernova (Fruchter et al. 2006; Kelly et al. 2008).
However, we point out that much of the research done on GRB hosts to date has required the automation and high spatial-resolution afforded by the HST (Bloom et al. 2002; Castro et al. 2003; Jakobsson et al. 2003; Fynbo et al. 2005; Chen et al. 2009). The aforementioned investigation, which utilized HST observations taken at various times after the burst, required that the GRB afterglow positions were known with excellent accuracy (less than a few tenths arcsecond). In contrast, the Swift/UVOT regularly provides afterglow position estimates with uncertainties on the order of 0.5′′– equivalent to the half-light radii typical of high-redshift galaxies. Thus UVOT position estimates, while adequate for identifying the probable host, are inadequate for analyses of the burst’s local environment, or studies that require accurately known galactocentric radii. Both the shortfalls of Swift and the high demand for HST time underline the need for a new strategy of ground-based follow-up observations that can localize the afterglow with high accuracy.
In this work we demonstrate such a strategy. We employ a combination of low-resolution, early-time, automated observations from a 1 m telescope, and high-resolution, deep, late-time observations from m class telescopes, including laser guide star adaptive optics imaging. The data resulting from this combination of observations is exceptionally rich, and allows us to study the GRB’s host galaxy as well as any foreground absorbers along the afterglow’s sightline. We can study the morphologies and stellar properties of the host and foreground galaxies at near-infrared wavelengths with spatial resolutions comparable to the HST, and we can interpret these properties while knowing the galaxy’s gas contents at accurate galactocentric radii.
To showcase this strategy, which fuses the early-time results from teams like GRAASP111Gamma-Ray Burst Afterglows As Probes; http://www.graasp.org/ with long-term follow-up campaigns, we have analyzed the rich sightline toward GRB 060418 at . This sightline has the potential to contribute significantly to our understanding of Mg II absorption systems, as three intervening (), strong Mg II absorbers of rest-frame absorption equivalent width Å were discovered in the early-time high-resolution spectroscopic observations of the afterglow (Ellison et al. 2006; Prochaska et al. 2007a). While there is a known overabundance of Mg II systems along GRB sightlines compared to those along quasar sightlines (Prochter et al. 2006), a triplet of foreground Mg II absorbers is rarely observed along a single sightline and offers a unique opportunity to study the extended gas of three galaxy halos. In addition, the observed overabundance of Mg II absorbers remains unexplained, and partially motivated this work. Despite this overabundance, and despite the relative ease of identifying Mg II systems along GRB sightlines, only two spectroscopic confirmations of Mg II absorbers have ever been made toward GRBs (Jakobsson et al. 2004; Masetti et al. 2003). In this paper we announce the third such spectroscopic confirmation.
Finally, although we lack an HI column density measurement for the host galaxy of the burst and for the foreground absorbers222The Ly line is blueward of the atmospheric cutoff at redshifts below ., the large ion abundances observed in the Mg II absorbers suggest that these are likely DLAs. For example, the Mg II absorber at contains (Prochaska et al. 2007a). A solar abundance of the absorbing gas without dust depletion would imply an underlying total neutral gas column density of , and a 0.1 solar metallicity would imply . While we expect the GRB host to be a DLA galaxy, the foreground DLAs along this GRB sightline are fortuitous, and can be compared directly to the traditional DLA population discovered along quasar sightlines (termed QSO-DLAs). Thus, this one sightline adds appreciably to the small number of high-redshift DLAs with known stellar counterparts.
Throughout this paper we use and , and unless otherwise stated we adopt .
2. Observations
2.1. Imaging Observations
| Telescope/Instrument | Filter | Total Exposure Time | Mean FWHM | UT Date |
|---|---|---|---|---|
| Keck/LRIS | 30 min | 1.1′′ | 30 May 2006 | |
| Keck/LRIS | 10 min | 1.0′′ | 30 May 2006 | |
| Magellan/PANIC | 78 min | 0.3′′ | 19 May 2006 | |
| PAIRITEL | J | 300 sec | 2.8′′ | 18 April 2006 |
| Keck/NIRC2 LGSAO | 23 min | 0.08′′ | 22 June 2007 | |
| HST/ACS | F555W | 4386 sec | 0.1′′ | 12 July 2006 |
| HST/ACS | F625W | 8772 sec | 0.1′′ | 11 July 2006 |
| HST/ACS | F775W | 8772 sec | 0.1′′ | 12 July 2006 |
2.1.1 Early-Time Swift and PAIRITEL
On 18 April 2006 at 3:06:08 UT the Swift Burst Alert Telescope (BAT) triggered on GRB 060418 (Falcone et al. 2006a), providing a 3′ error circle localization centered at (RA, DEC) of (J2000)15 h 45 m 41 s, (J2000)03 d 38′ 35′′. About one minute later observations with the Swift X-Ray Telescope (XRT) resulted in an initial position estimate with a 5.8′′ error centered at (J2000)15 h 45 m 42.8 s, (J2000)03 d 38′ 26.1′′. This position was later refined by the Swift XRT team, resulting in a 4′′ error centered at (J2000)15 h 45 m 42.4 s, (J2000)03 d 38′ 22.8′′(Falcone et al. 2006b). Both XRT positions are consistent with the original BAT localization. An afterglow with mag was quickly discovered by the Swift UltraViolet and Optical Telescope (UVOT). The reported afterglow position is at the edge of the revised XRT error circle, at (J2000)15 h 45 m 42.60 s, (J2000)03 d 38′ 20.0′′with a error radius of about 0.5′′ (Falcone et al. 2006a).
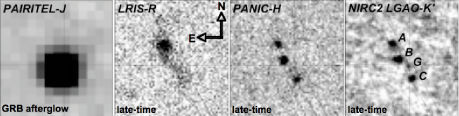
These Swift detections triggered the PAIRITEL 1.3 m automated telescope (Bloom et al. 2006) to slew toward GRB 060418 at 05:25:34 UT, where it began observations of the field, obtaining 13 300 s JHKs mosaics, acquired simultaneously in all three bands. The transient was well detected in the 300 s mosaics and faded over the next 6 hours of observations (Kocevski et al. 2006). We show one of the earlier 300 s -band mosaics in Fig. 1, zoomed in on the afterglow position. The mean seeing was 2.8′′ FWHM at band, and thus the dithered images were Nyquist sampled by the 1′′ pixels in the reconstructed mosaics.
2.1.2 Magellan -band Images Using PANIC
Follow-up observations of the field around GRB 060418 were performed on 19 May 2006 with the Persson’s Auxiliary Nasmyth Infrared Camera (PANIC; Martini et al. 2004) on the Magellan Baade telescope. We acquired twenty-six sets of three 60 s -band images for a total exposure time of 78 minutes. The images were processed using standard techniques. Each set of three 60 s images were initially median combined; the resulting 26 frames were registered to a common origin, filtered for deviant pixels, and stacked to form a final combined image using our own software.
Although the night was not photometric, the seeing quality was excellent, yielding a mean FWHM of 0.3′′. Photometric calibrations were performed using additional images of the same field obtained on 27 August 2007 under photometric conditions. The later data were calibrated to Persson standards (9172 and 9164; Persson et al. 1998). We show a portion of the final, stacked -band image in Fig. 1. At least three objects, all within ′′ of the afterglow position, are visible. We name these three objects , , and from north to south, and refer to them throughout the text. In § 5.2 we describe the photometric and spectroscopic properties of galaxies , , and , and discuss their association with known Mg II absorbers previously identified in early-time afterglow spectra.
2.1.3 Keck and Images Using LRIS
On 30 May 2006 we obtained additional imaging observations of the field surrounding GRB 060418 using the Low Resolution Imaging Spectrometer (LRIS; Oke et al. 1995) on Keck I. We took three 600 s exposures at band for a total integration time of 30 minutes, and we took one 10 minute exposure at band. The seeing conditions yielded FWHMs of 1.1′′ and 1.0′′ at and bands, respectively. These images were processed using standard techniques. The data were bias subtracted, flat fielded with dome flats, and calibrated with a Landolt standard field (PG2213; Landolt 1992). In Fig. 1 we present a 13′′ square region of the -band image showing the region of interest.
2.1.4 Keck Using NIRC2 LGSAO
Late-time follow-up observations were performed more than a year after the burst, on 22 June 2007, using laser guide star adaptive optics (LGSAO; Wizinowich et al. 2006) with the NIRC2 (Matthews & Soifer 1994) wide field camera (0.04′′/pixel) on Keck II. To maximize the camera efficiency and avoid sky saturation, we used three coadds and exposed for 20 seconds for a total integration time of 23 minutes at band. When using the wide field camera the diffraction limited PSF core is slightly undersampled at band, however the larger field of view was chosen to include a nearby 2MASS star (21′′ southeast). This star was especially valuable for image alignment, photometric calibration, and PSF estimation. The images were processed using standard infrared imaging techniques, including dark subtraction, flat fielding, and filtering for bad pixels. Before performing image alignment, we dewarped individual reduced frames using the prescription outlined in the NIRC2 online documentation.333http://www2.keck.hawaii.edu/inst/n2TopLev/post_observing/dewarp The mean FWHM of the AO-corrected PSF core is 0.08′′. A portion of the LGSAO image is shown in Fig. 1. Galaxies , , and are clearly detected and coincident in position with what is seen in the coadded PANIC -band image. We note a forth object, labeled , seen at the level between and on the plane of the sky. In § 5.1 we discuss the photometric properties of source . We interprete this object to be part of the GRB host galaxy. Throughout the text we will use the letter to indicate that an object is physically associated with the GRB host galaxy.
2.1.5 Optical Images in the HST/ACS Data Archive
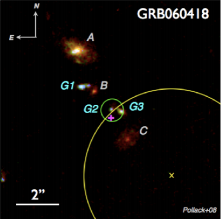
Between May and July of 2006, multiple observations of GRB 060418 were performed with the Hubble Space Telescope (HST) Advanced Camera for Surveys (ACS) using the F555W, F625W, and F775W filters (PID 10551; PI: S. Kulkarni). The imaging data are retrieved from the HST data archive and processed using the standard reduction pipeline. The first epoch of observations were carried out three weeks after the burst. The images show the fading afterglow which is absent in the images taken on 11 and 12 July 2006. The early-time observations confirm the astrometric position of the afterglow relative to other nearby galaxies (see § 3.1). The late-time observations complement our own ground based data in both frequency and resolution, and provide a view of the host galaxy and intervening systems that is unimpeded by the bright afterglow. The mean FWHM of the PSF for all three filters is approximately 0.1′′. In Fig. 2 we present a composite late-time image made from all three ACS filters, registered using stars in the field. The position of the faded afterglow is indicated with a pink plus sign. The three redder objects previously detected in our and images (objects , , and ) are again labeled on the ACS image. In addition, we identify three blueish objects, , , and , which we interpret to be components of the GRB host galaxy (see § 5.1).
In Table 1 we provide a journal of all imaging observations discussed in this section.
2.2. Spectroscopy
We performed spectroscopic observations with the LRIS 1′′ longslit on UT 16 August 2007 in the hopes of identifying the galaxies responsible for the GRB and intervening Mg II absorption along the sightline. Using the 680 dicrhoic we simultaneously took two 1830 s exposures through the 300/5000 grism (, ), and two 1800 s exposures through the 600/7500 grating (, ), for a total integration time of approximately 1 hour over the wavelength range . (Transmission through the 300/5000 grism drops substantially below 4000Å.) The data were processed with an IDL package customized for LRIS longslit reductions developed by J. Hennawi and J.X.P.444http://www.ucolick.org/xavier/LowRedux. The reduction includes standard bias subtraction and flat fielding, wavelength calibration using arc lamp observations taken the same night, and instrument flexure correction using cross-correlations of observed and archived sky spectra. The spectra were calibrated to vacuum wavelengths, corrected for the heliocentric motion, and fluxed using the spectrophotometric standard, BD33 2642. We did not correct the spectra for Galactic extinction, which is mag along this direction Schlegel et al. (1998).
Using a position angle of 30 degrees (East of North), we oriented the slit such that it would include light from all three nearby objects that had been discovered in emission prior to the date of these spectroscopic observations (objects , , and ).555The proprietary period for the HST ACS observations ended in November 2007, after these spectroscopic observations were carried out. In Fig. 1 we show the orientation of the slit relative to our ground-based data. Unfortunately, the slit did not include flux from the blueish object revealed by ACS and marked in Fig. 2. We now interpret to be a component of the GRB host (see § 5.1).
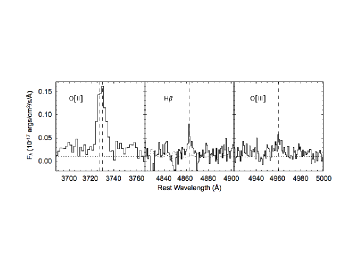
Continuum from just one galaxy was detected in these spectroscopic data, located at the position of object . The spectrum of this object is shown in Fig. 3. Nebular emission lines of [O II], H, and [O III] indicate that object has a redshift of , which corresponds to a velocity 109 km s-1 blueward of the MgII absorption signature imposed by an intervening system reported at (Ellison et al. 2006; Prochaska et al. 2007a). At this redshift, the [O III] falls in the forest of night sky lines at 8288 Å and we were unable to identify a robust line feature from the galaxy. The properties of galaxy and the identities of the other two MgII absorbers will be discussed in detail in § 5.2.
3. Analysis
3.1. Astrometry of Ground Based Images
An accurate interpretation of the GRB host galaxy complex and all intervening absorbers depends crucially on the accuracy of aligning the , , , , and images, and the astrometric precision in the position of the GRB afterglow relative to other objects at small angular distances. The large range of wavebands and spatial resolutions afforded by each image makes this a non-trivial task. In order to perform relative astrometric alignment of all of our ground based images, we first used SExtractor (Bertin & Arnouts 1996) to identify objects in each field. Objects in common in two images adjacent in wavelength space were used as inputs to the IRAF geomap package. We applied the astrometric solution created by geomap to the redder image in each pair using the geotran package. In this way we aligned pairs of images to each other, eventually forming an alignment between the , , , , and images. The relatively large fields of view of the PAIRITEL, LRIS and PANIC images (about 9′, 6′ and 3′, respectively) included numerous common galaxies and stars, allowing robust alignments with ′′. The much smaller field of view of the NIRC2 wide-field image (about 40′′) was just large enough to include one alignment star and one galaxy, other than galaxies , , and . However these objects were well spaced and the resulting alignment is accurate to within ′′.
After aligning all of the ground-based images, we performed absolute astrometry by correlating the positions of objects in the PAIRITEL image to sky coordinates from the 2MASS catalog666The absolute accuracy of the 2MASS catalog is mas (Skrutskie et al. 2006). using the imwcs program in WCSTools.777http://tdc-www.cfa.harvard.edu/software/wcstools/ The absolute astrometric position of the afterglow in the PAIRITEL image, as determined from this alignment procedure, fell within the 0.5′′, error radius of the reported Swift UVOT position (Falcone et al. 2006a). As shown in Fig. 1, the afterglow lies closest to object in the NIRC2 image; it is located 0.5′′ southeast of object on the plane of the sky between galaxies and , almost along a straight line. This fact was later confirmed by our analysis of the early-time archival ACS images, that show the afterglow fading during the first three months after the burst.
The afterglow was not coincident with the centroids of galaxies or 888Recall that the spectrum of galaxy shows that it is a foreground galaxy coincident with a Mg II absorber at .. If we suppose that objects or are associated with the host, their angular distances of 1.5′′ and 1.25′′ from the afterglow would require them to be separated from the afterglow by physical distances of at least kpc and 10 kpc, respectively. These distances are far beyond the half-light radii of typical high-redshift galaxies. Furthermore, if either object or were the host galaxy, the afterglow would be situated much farther from its host’s flux-weighted centroid than is typically observed. Bloom et al. (2002) calculated a median projected offset of 0.17′′ between afterglows and the flux-weighted centroids of the putative host galaxies for 20 GRBs, 16 of these afterglows are spectroscopically identified at with a median corresponding projected distance of kpc and a maximum of 6.2 kpc (corrected for ). This strongly suggests that galaxies and are not associated with the host. Since their chance alignment is more probable at lower redshifts, they are likely intervening galaxies, and strong absorbers due to their small impact parameters. Indeed, further evidence for this scenario is given in Section 4.
3.2. Galaxy Photometry
We performed photometry on every object in the ACS images within 5′′ of the burst – objects , , , , , and in Fig. 2. First we used SExtractor on the F775W filter to create a segmentation map. We used a low detection threshold (DETECT_THRESH) and deblending parameter to include as much of the light from each galaxy as possible, while still distinguishing between nearby objects. This segmentation map was used to sum the flux of each object in an algorithm developed by H.-W. C., which performs a local sky subtraction using adjacent sky pixels. To obtain accurate measurements of galaxy colors, we applied this same segmentation map to sum the flux of the objects in the two other ACS filters. We converted fluxes into magnitudes using the photometric parameters supplied by the HST header information. The magnitudes of each object are recorded in Table 2. They have been corrected for a rather large Galactic extinction using mag, reported in Schlegel et al. (1998). Where necessary we interpolated to find the extinction in the ACS bandpasses; the resulting values were mag, mag, and mag.
Photometry on objects in the LRIS and and PANIC images was less straightforward. None of the objects , , or are resolved or detected in these data, and only galaxy is well detected in the LRIS images; however knowledge of the complexity of this field guided our photometric measurements. By comparing the results from standard aperture photometry using varying aperture radii, with isophotal photometry using varying segmentation maps created by SExtractor, we were able to identify apertures that overestimated flux due to inclusion of nearby contaminating objects, and underestimated flux in specific seeing conditions. Apertures with 1.5′′ and 0.75′′ radii proved best for the LRIS and PANIC images, respectively. The magnitudes of each object are recorded in Table 2. These have been corrected for atmospheric extinction as well as Galactic extinction. Again, where necessary we interpolated to find the extinction in the specific bandpasses; the resulting Galactic extinction values were mag, mag, and mag.
We attempted to perform photometry on the objects detected in the NIRC2 LGSAO image, however the complexity of the AO PSF combined with the close angular spacing of all objects made this task extremely difficult. We were unable to recover any trusthworthy values. Future improvements in adaptive optics PSF determination would help remedy photometric measurements of extremely complex sightlines such as this one.
| Object | F555W**All HST magnitudes for each object are assumed to have a systematic error of at least 0.05 mag which exceeds the statistical uncertainty. | F625W**All HST magnitudes for each object are assumed to have a systematic error of at least 0.05 mag which exceeds the statistical uncertainty. | F775W**All HST magnitudes for each object are assumed to have a systematic error of at least 0.05 mag which exceeds the statistical uncertainty. | (′′) | ( kpc) | LRIS | LRIS | PANIC |
|---|---|---|---|---|---|---|---|---|
| 23.8 0.05 | 23.0 0.05 | 22.6 0.05 | 1.7 | 4.1 | 23.8 0.2 | 22.9 0.2 | 22.4 0.2 | |
| 26.9 0.16 | 26.1 0.05 | 25.2 0.05 | 0.7 | 2.0 | 25.0 | 24.0 | ||
| 25.4 0.07 | 24.7 0.05 | 23.9 0.05 | 1.2 | 2.8 | 24.8 0.3 | 24.0 0.2 | 22.5 0.2 | |
| 24.9 0.05 | 24.9 0.05 | 24.7 0.05 | … | … | … | |||
| 26.2 0.07 | 26.1 0.05 | 25.8 0.05 | … | … | … | |||
| 25.5 0.06 | 25.2 0.05 | 24.9 0.05 | … | … | 25.0 |
Note. — magnitudes of every object identified within 5′′ of the afterglow position. Objects are labeled in Figures 1 and 2. The magnitudes have been corrected for Galactic extinction using the values reported by Schlegel et al. (1998). Where necessary we interpolate to find the extinction in the specified bandpass. The extinction values used were: mag, mag, mag, mag, mag, mag.
4. Galaxy Properties Along the Line of Sight Toward GRB 060418
The Swift detection of an optical afterglow associated with GRB 060418 triggered several target-of-opportunity spectroscopic campaigns. The afterglow was observed soon after the burst with the Magellan Inamori Kycoera Echelle spectrometer (MIKE; Bernstein et al. 2003) on the Magellan 6.5 m Clay telescope at the Las Campanas Observatory, and with the Ultraviolent and Visual Echelle Spectrograph (UVES) at the Very Large Telescope (VLT) in Chile. In addition to detecting low-ion resonant and fine-structure transitions at (which establish the redshift of the GRB host galaxy), both groups reported the detection of three strong Mg II absorption systems along the sightline at redshifts of , 0.656, and 1.107 (Prochaska et al. 2007a; Ellison et al. 2006). The groups measured similar Mg II equivalent widths; we adopt the rest-frame values by Prochaska et al. (2007a): , , and , for the three absorbers in order of increasing redshift.
While it may seem extraordinary that three strong Mg II absorbers would exist along one sightline toward a GRB, it has been shown that many GRB afterglow spectra exhibit a strong Mg II absorber and/or foreground damped absorber. Specifically, Prochter et al. (2006) report an apparent factor of four overabundance of Mg II systems along GRB sightlines compared to those along quasar sightlines. Furthermore, Chen et al. (2009) report an overdensity of galaxies near the afterglow for GRB with spectra showing strong Mg II absorption. These puzzling results remain to be explained. Indeed, the on-average higher incidence of absorbers along GRB sightlines partially motivated this research. In addition, we were motivated by the promise of analyzing the stellar properties of these absorbing galaxies without being hampered by a bright background quasar, as would be the case in traditional QSO absorption studies.
In the following sections we explain our interpretation of galaxies , , and , detected in our ground based images, as the three, strong Mg II absorbers known to intervene the sightline at redshifts of , 1.107, and 0.603, respectively. We attribute objects , , as part of the host galaxy of the GRB at , due to their similar blue colors.
4.1. Properties of Galaxy
Figure 3 shows that the LRIS spectrum of galaxy displays emission features that are consistent with a star-forming galaxy at . We calculate the total flux in the [O II] nebular lines to be ergs cm-2 s-1, which corresponds to a star formation rate of about using the Kennicutt (1998a) relation. We note that the star formation rate is likely higher than this estimate (but within a factor of two), because we have not accounted for Galactic extinction or slit losses. The emission redshift of the galaxy falls at blueward of the velocity of a strong Mg II absorber of Å whose peak optical depth (measured from Fe II transitons) lies at . At the distance of the absorber, the projected angular separation between the galaxy and the afterglow line of sight, ′′, corresponds to a physical impact distance of kpc. The high spatial resolution image of the galaxy displayed in Figure 2 exhibits a well-developed stellar disk with an estimated Kron radius (Kron 1980) of 1.7′′. For an exponential profile, the Kron radius (the first moment of surface brightness distribution) is twice the disk scale length. The ACS image of galaxy therefore indicates a disk scale length of kpc at , comparable to the scale length of the Milky Way at the present time.
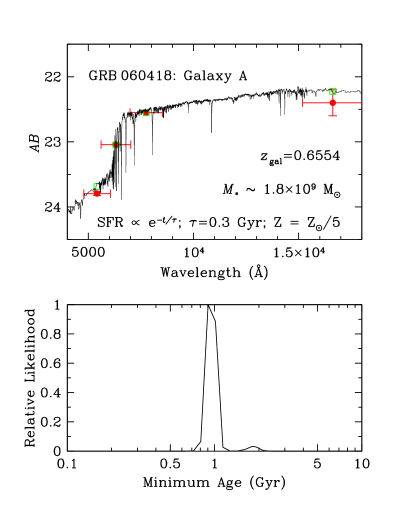
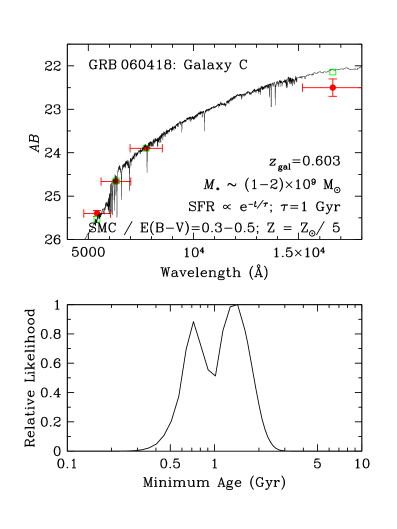
The precise redshift of the galaxy allows us to examine the underlying stellar population using the observed optical and near-infrared colors. The top panel of Figure 4 displays the observed broad-band spectral energy distribution (SED) of galaxy over the wavelength range of Å. To constrain the stellar population and star formation history of the galaxy, we consider a suite of synthetic stellar population models generated using the Bruzual & Charlot (2003) spectral library. We adopt a Salpeter initial mass function with a range of metallicities from to and a range of star formation histories from a single burst model to a tau-model with an exponentially declining star formation rate () with Gyr. We include no dust in our synthetic spectra. A maximum likelihood analysis that compares the data with a grid of models shows that in the absence of dust the observed SED is best described by an exponentially declining star formation history on a 300-Myr characteristic time scale, with a metallicity of . In addition, the minimum age of the stellar population is found to be Gyr, as shown in the likelihood function in the bottom panel. Given the simple stellar population synthesis model, we further estimate the total stellar mass to be . We note that dust extinction and the adopted metallicity are degenerate in synthetic spectra. The estimated stellar age and mass are insensitive to the assumed dust content.
4.2. Properties of Galaxies and
Both galaxies and are located closer to the afterglow line of sight than galaxy . Both galaxies display relatively redder colors than what is observed of galaxy , but galaxy displays a well-resolved disk structure that is similar in apparent size to galaxy . We measure a Kron radius of 1.2′′ for galaxy and 0.7′′ for galaxy . Given our slit orientation and our wavelength coverage, [O II] emission from galaxies and should have been observed if these galaxies are at modulo very bright sky lines. We searched the spectra at the positions of galaxies and for nebular lines and found no line emission. To determine the redshifts of galaxies and , we therefore rely on their observed colors and the a prior knowledge of two strong Mg II absorbers with Å at and 1.107 along the GRB sightline.
We argue that galaxy is responsible for the Mg II absorber at for two reasons. First, the observed optical and near-infrared colors are consistent with an Sab galaxy at . Second, the apparent angular size of galaxy is comparable to that of galaxy , at a similar redshift. At , the observed Kron radius indicates a disk scale length of kpc. To further understand this galaxy, we examine the underlying stellar population by considering a suite of stellar population synthesis models. Motivated by the observed red color, we include dust extinction and adopt an SMC extinction law. We find that the broad-band SED is best described by an exponentially declining star formation history with Gyr (Fig. 5). The minimum age of the stellar population is found to be Gyr, as shown in the likelihood function in the bottom panel of Figure 5. The likelihood function also indicates that the SED can be interpreted nearly equally well by a Gyr model but with a younger age. In either model, we estimate that a total extinction of is necessary, and the total stellar mass is .
Finally, we argue that galaxy is responsible for the highest redshift Mg II absorber. Galaxy has an extremely red color suggesting a large extinction, which is consistent with the large depletion found for the strong Mg II absorber at (Prochaska et al. 2007a). A dusty scenario for galaxy is further supported by the work of Ellison et al. (2006), in which they fit an absorber at with a Milky Way extinction law using and . At , the observed Kron radius of galaxy indicates a disk scale length of kpc. Additional near-infrared spectroscopic observations of the galaxy may confirm the identification of the Mg II absorber based on the presence of an H emission line.
The small angular separation beween galaxies and , ′′, suggests that gravitational magnification may be effective if is indeed located behind . To estimate the effect of lensing, we first estimate the mass of . Galaxy is observed to have an unobscured luminosity of . Correcting for dust-extinction estimated by Ellison et al. (2006), we derive an intrinsic luminosity of for galaxy . Adopting the dark matter halo mass-to-light ratio for galaxies from Zheng et al. (2007), we estimate that the hosting dark matter halo has a total mass of with a virial velocity of km s-1 at . Adopting a singular isothermal density profile leads to an Einstein radius of ′′ for galaxy , which in turn suggests that may have been magnified by %.
We summarize the photometric properties of all galaxies within 5′′ of the afterglow in Table 2. Table 3 summarizes the properties of these three galaxies having adopted the galaxy identifications discussed above. Knowing each galaxy’s redshift as well as its angular separation from the GRB afterglow, we can now associate the measured gas properties with a physical galactic radius at which the photo-ionized gas presides. If we use a simple model for Mg II gas decreasing with galactocentric radius (e.g. Chen & Tinker 2008), we would expect galaxy to exhibit the smallest Mg II equivalent width because its halo was probed at the largest galactocentric radius of 29 h-1 kpc. This interpretation is consistent with our results.
We note that additional galaxies are found at angular distances beyond 5′′, which would have projected distances of kpc at and kpc from the afterglow line of sight. While it is unlikely that these galaxies would be physically connected to these strong Mg II absorbers (see e.g. Bouché et al. 2007; Chen & Tinker 2008), follow-up spectroscopic survey of these galaxies will allow us to study in detail the galaxy environment of these strong Mg II absorbers.
5. Discussion
The sightline toward GRB 060418, exhibiting six distinct objects all within 3.5′′ of the afterglow’s position, highlights the difficulty of distinguishing morphologically complex host galaxies from multiple foreground absorbing galaxies at close angular distances. The high resolution HST images allow us to resolve multiple foreground galaxies from the GRB host and attribute objects , , as part of the host galaxy of the GRB at based on their similar blue colors. Follow-up campaigns with limited wavelength coverage, low resolutions, or shallow depths, can easily lead to mis-identifications, even when m telescopes are used. Our Keck/LRIS images taken at and band provide an example of this risk; in these data galaxy is the only well resolved system, and its proximity to the reported UVOT position might lead to the misidentification of the absorber as the host.
This complex sightline also reminds us that Swift XRT positions should be treated with caution. In Fig. 2 we show the revised XRT position and 90% containment radius in yellow, overlaid on the HST/ACS image. This XRT position (Falcone et al. 2006b) just barely encircles the component of the host galaxy and the actual afterglow position, which is depicted by a pink plus symbol. If follow-up observations had proceeded based on the XRT position alone, any instrument with a field of view smaller than 8′′ across would have missed the host galaxy altogether, and it is likely that galaxy would have been mis-identified as the host. Thus we encourage a healthy dose of skepticism when drawing conclusions about GRB host galaxies in the cases of dark bursts (e.g. Cobb & Bailyn 2008). In addition, we warn that bursts without accurate UVOT positions are especially limited for calculating impact parameters to intervening galaxies; the angular separation from the XRT position and the actual afterglow position corresponds to physical distances on the order of 30 kpc at .
As a final note of caution regarding analysis using positions solely from Swift, we note that even the UVOT position (depicted by a green circle in Fig. 2) can be misleading. In the case of GRB 060418, the UVOT position is nearly coincident with the component of the host, while the actual afterglow position is ′′ to the south. Since Bloom et al. (2002) calculated a median projected offset of kpc (corrected for ), corresponding to 0.12′′ at between afterglows and the flux-weighted centroids of their putative host galaxies, one may have been tempted to conclude that this particular GRB occured within the stellar environment of component . However, in this case the positional error of 0.5′′ corresponds to kpc at . This level of uncertainty, on kpc physical scales, significantly hinders the interpretation of the local environments of GRBs, and highlights the need for early-time follow-up images that complement Swift’s onboard instruments. For those times when HST is unavailable for early-time follow-up, it is imperative that we develop a system for accurate positional determination from the ground. In this work we have shown that by using a combination of low-resolution, early-time, automated observations from 1 m class telescopes and high-resolution, deep, late-time observations from m class telescopes, we can calculate the afterglow’s position relative to the host and foreground absorbers to within just 0.02′′, or 170 pc.999Our absolute positional error depends on the positional error of the 2MASS catalog.
With such an accurate afterglow position, we can now interpret the gaseous properties of the host galaxy and the three foreground absorbers at a galactocentric radius known to better than 200 pc. Next, we discuss these gaseous properties and compare them to the stellar properties.
| Object | aaSeparation (in projection) between GRB afterglow and MgII absorbers, assuming the listed redshifts. For , the host, we give the separation between the afterglow and the host’s flux-weighted centroid, calculated from the F775W filter. | bbAbsolute, rest-frame, -band, magnitude, calculated by interpolating the observed magnitudes between the available wavebands. For the host, the observed -band limiting magnitude of component translates almost directly to the rest-frame -band limit and no interpolation was done. | ccRest equivalent width of MgII measured in Å, taken from Prochaska et al. (2007a). | ||
|---|---|---|---|---|---|
| ( kpc) | log | (Å) | |||
| 0.656 | 16.5 | 18.8 | 0.97 | 13.82 0.06 | |
| 1.107 | 8.25 | 19.6 | 1.84 | 14.59 0.08 | |
| 0.603 | 7.5 | 17.2 | 1.27 | ||
| 1.490 | 7.16 | 18.4 | 1.93 | 15.220.03 |
5.1. The Host Galaxy of GRB 060418
GRB 060418 occured along a very complex sightline, but by performing photometric and spectroscopic observations of the objects in this field we have disentangled three foreground systems from the complicated host galaxy. The blue host exhibits a disturbed morphology, with at least three components seperated by 2′′. The extended system is reminiscent of the host of GRB 980613 (Djorgovski et al. 2003), the host of GRB 000926 (Fynbo et al. 2002), and the host of GRB 011211 (Jakobsson et al. 2003). The system conforms to our current picture of GRB hosts as blue and irregular galaxies experiencing a mode of ongoing star formation which is different from that found in the massive starbursts typified by mid-IR and sub-mm detections (Le Floc’h et al. 2003; Fruchter et al. 2006). Most of the GRB hosts observed to date have luminosities (Chen et al. 2009). Using the limit of mag calculated from our PANIC data, we conclude that this host’s rest-frame absolute magnitude, log , is greater than mag. Using log for blue galaxies at (Faber et al. 2007), this limit on corresponds to a luminosity limit , consistent with other GRB hosts.
Nearly all GRB hosts are found to be DLAs, and the GRB-DLA population has a median value of (Prochaska et al. 2007b). However, this host resides at , making the Ly absorption feature impossible to observe from the ground. Assuming an upper limit of , Prochaska et al. (2007b) calculated a lower limit on the gas phase metallicity of this host, along the afterglow’s sightline, and found . Unfortunately, while this metallicity limit is consistent with what we expect for GRB-DLAs, it does not significantly contribute to our current understanding of relationships between luminosity, age, dust, or metallicity. GRB-DLAs exhibit metallicities with an intrinsic scatter of dex, and none have shown a metallicity (Prochaska et al. 2007b).
The lack of concrete values for and thwarts our aim to sketch a complete picture of this high redshift galaxy, comparing its stellar and gaseous properties. Yet in this case, using our accurate knowledge of the location of the burst with respect to the multi-component system, we can still significantly increase our understanding of the burst’s local environment and begin to appreciate what conditions produce GRBs rather than supernova, or other less energetic star formation products. This burst was rather unique in that it did not conform to the usual scenario in which the afterglow is situated very near to the flux-weighted centroid of its host. Bloom et al. (2002) calculated a median projected offset of 0.17′′ between afterglows and the flux-weighted centroids of their putative host galaxies, but the afterglow from GRB 060418 occured 1.2′′ away from its host’s flux-weighted centroid. (The flux-weighted centroid is just south-west of galaxy .) Even if component has been incorrectly identified as part of the complex host system, the offset between the afterglow and components and is still 0.45′′. It has been suggested that the tight correlation between afterglow locations and the locations of the brightest knots in their host galaxies implies that GRB projenitors are the most massive stars - more massive than typical supernova progenitors (Wolf & Podsiadlowski 2007). Examples such as GRB 060418 should at least prompt a critical redress of these claims and consider that a large range of projenitors may exist. Similar conclusions have been drawn from examples of GRBs that may have ocurred in the halos of the host galaxy (Cenko et al. 2008; Perley et al. 2008) or with large offsets from the most intense star forming regions within the galaxy (Hammer et al. 2006).
Finally, we note that we have entered an exciting time when we can probe equally sized physical scales by means of high-resolution imaging and detailed analysis of early-time afterglow spectroscopy. Vreeswijk et al. (2007) analyzed UVES spectroscopy taken roughly ten minutes after this burst. From the time evolution of the FeII and NiII excited and metastable populations, they concluded that neutral gas resides at kpc from the afterglow. If this neutral gas was associated with an old stellar population, we could have resolved it using our ground-based adaptive optics images or HST/ACS. Note that components and of the host, which are closest to the burst’s location in projection, are at least 3.5 kpc away. Adopting the sensitivity limit of the ACS/F625W images, we derive a 2- upper limit to the underlying star formation rate (SFR) intensity of 0.0074 M⊙ yr-1 kpc-2 over a region of 1 kpc radius at the afterglow’s position101010Here we have temoprarily adopted to compare with the Vreeswijk et al. (2007) result.. For (the median value of GRB DLAs; see e.g. Jakobsson et al. 2006), we estimate a surface gas mass density of M⊙ pc-2. The observed SFR intensity limit is consistent with the expectation of the Schmidt-Kennicutt star formation law for nearby normal disk galaxies (e.g. Kennicutt 1998b). We conclude that the gas observed along this sightline is unrelated to an old stellar population nor an intense, actively star-forming region within the galaxy (unless that region is highly obscured).
5.2. Foreground Absorbing Galaxies
The three galaxies identified through their Mg II absorption toward GRB 060418, and discovered in emission in this work, offer a unique opportunity to study the combined stellar and gaseous properties of high redshift galaxies. Previous samples of Mg II absorption systems detected toward quasars have long been scrutinized; when searching for stellar counterparts of absorbing systems near a bright backround source there is an intrinsic bias toward higher impact parameters and luminosities. The fading nature of GRB afterglows enables a systematic search for the absorbers even at zero impact parameter.
Despite the clear advantages of this exciting alternative to quasar absorption line studies, forward progress has been slow. Early-time spectroscopy is needed to identify the redshifts of Mg II absorbers, late-time deep images are needed to discover the stellar counterparts, and finally late-time follow-up spectroscopy is needed to confirm the identifications. To date, only two Mg II absorbers have ever been spectroscopically confirmed along GRB sightlines. Jakobsson et al. (2004) found a Mg II absorber 1.2′′ from the optical afterglow of GRB 030429, and Masetti et al. (2003) discovered a Mg II absorber 2′′ from the optical afterglow of GRB 020405. Galaxy , in this work, represents the third such spectroscopically confirmed absorber.
Like the two previously identified, spectroscopically confirmed, MgII absorbers along GRB sightlines, all three galaxies intervening GRB 060418 are considered “strong” absorbers, with Å. It is instructive to compare the properties of galaxies , , and , to a larger sample of QSO-selected, strong MgII absorbers. The three GRB-selected absorbers discussed in this work should represent an unbiased subset of the larger random sample, although the possible excess of Mg II absorbers along GRB sightlines raises some doubts (Prochter et al. 2006). The unobscured absolute rest-frame magnitudes of each galaxy are summarized in Table 3. If log , then these magnitudes correspond to roughly , , and galaxies for , , and , respectively111111Adopting the best fit SMC extinction law from Figure 5, the extinction corrected absolute magnitude of galaxy is comparable to what is found for galaxy .. Historically, strong Mg II absorbers at redshifts less than 1 have been found to have luminosities comparable to (Bergeron 1986; Steidel et al. 1994). In a more recent study which involved a statistical analysis of thousands of stacked images from the SDSS, Zibetti et al. (2007) found that strong MgII absorbers ( Å) typically arise in galaxies (see also Kacprzak et al. 2008). Considering that all three galaxies identified in this work have sub- luminosities, it is suggestive that older quasar absorption studies were biased by the quasar’s blinding light, and included mis-identifications.
This is in part confirmed by a recent study of Chen & Tinker (2008), who have shown that the equivalent widths of Mg II absorbers at a known galactocentric radius can be described by an isothermal density profile of Mg+ ions. Remarkably, the equivalent widths and impact parameters of galaxies , , and fit very well with this latest result, which was compiled using Mg II systems first detected along quasar sightlines (See Fig. 5 of Chen & Tinker 2008). In addition, galaxies , , and extend this relationship to significantly smaller galactocentric radii – a parameter space that is precluded by the quasar in traditional absorption studies.
Finally, we note that the large ion abundances observed in the Mg II absorbers suggest that these are likely damped absorption (DLA) systems of (e.g. Wolfe et al. 2005). In particular, the Mg II absorber at contains (Prochaska et al. 2007a). A solar abundance of the absorbing gas without dust depletion would imply an underlying total neutral gas column density of , and a 0.1 solar metallicity would imply . Similarly, the Mg II absorber at is expected to contain at least given the observed Zn abundance (Prochaska et al. 2007a). Our imaging and spectroscopic survey of the sightline toward GRB 060418 has therefore unveiled two new DLA galaxies at . It demonstrate the the unique sensitivity in probing neutral gas cross section selected DLA galaxies using GRB afterglows. Known properties of galaxies and not only confirm that the luminosity distribution of DLA galaxies is consistent with a neutral gas cross-section selected field galaxy population (e.g. Chen & Lanzetta 2003), but also provide unobstructive views of new DLA galaxies.
References
- Bergeron (1986) Bergeron, J. 1986, A&A, 155, L8
- Bernstein et al. (2003) Bernstein, R., Shectman, S. A., Gunnels, S. M., Mochnacki, S., & Athey, A. E. 2003, in Presented at the Society of Photo-Optical Instrumentation Engineers (SPIE) Conference, Vol. 4841, Instrument Design and Performance for Optical/Infrared Ground-based Telescopes. Edited by Iye, Masanori; Moorwood, Alan F. M. Proceedings of the SPIE, Volume 4841, pp. 1694-1704 (2003)., ed. M. Iye & A. F. M. Moorwood, 1694–1704
- Bertin & Arnouts (1996) Bertin, E., & Arnouts, S. 1996, A&AS, 117, 393
- Bloom et al. (2002) Bloom, J. S., Kulkarni, S. R., & Djorgovski, S. G. 2002, AJ, 123, 1111
- Bloom et al. (2006) Bloom, J. S., Starr, D. L., Blake, C. H., Skrutskie, M. F., & Falco, E. E. 2006, in Astronomical Society of the Pacific Conference Series, Vol. 351, Astronomical Data Analysis Software and Systems XV, ed. C. Gabriel, C. Arviset, D. Ponz, & S. Enrique, 751–+
- Bond et al. (2001) Bond, N. A., Churchill, C. W., Charlton, J. C., & Vogt, S. S. 2001, ApJ, 562, 641
- Bouché et al. (2007) Bouché, N., Murphy, M. T., Péroux, C., Csabai, I., & Wild, V. 2007, New Astronomy Review, 51, 131
- Bruzual & Charlot (2003) Bruzual, G., & Charlot, S. 2003, MNRAS, 344, 1000
- Castro et al. (2003) Castro, S., Galama, T. J., Harrison, F. A., Holtzman, J. A., Bloom, J. S., Djorgovski, S. G., & Kulkarni, S. R. 2003, ApJ, 586, 128
- Cenko et al. (2008) Cenko, S. B., Fox, D. B., Penprase, B. E., Cucchiara, A., Price, P. A., Berger, E., Kulkarni, S. R., Harrison, F. A., Gal-Yam, A., Ofek, E. O., Rau, A., Chandra, P., Frail, D. A., Kasliwal, M. M., Schmidt, B. P., Soderberg, A. M., Cameron, P. B., & Roth, K. C. 2008, ApJ, 677, 441
- Chen & Lanzetta (2003) Chen, H.-W., & Lanzetta, K. M. 2003, ApJ, 597, 706
- Chen et al. (2009) Chen, H.-W., Perley, D. A., Pollack, L. K., Prochaska, J. X., Bloom, J. S., Dessauges-Zavadsky, M., Pettini, M., Lopez, S., Dall’aglio, A., & Becker, G. D. 2009, ApJ, 691, 152
- Chen & Tinker (2008) Chen, H.-W., & Tinker, J. L. 2008, ApJ, 687, 745
- Cobb & Bailyn (2008) Cobb, B. E., & Bailyn, C. D. 2008, ApJ, 677, 1157
- Cox et al. (2006) Cox, T. J., Jonsson, P., Primack, J. R., & Somerville, R. S. 2006, MNRAS, 373, 1013
- Dessauges-Zavadsky et al. (2006) Dessauges-Zavadsky, M., Chen, H.-W., Prochaska, J. X., Bloom, J. S., & Barth, A. J. 2006, ApJ, 648, L89
- Djorgovski et al. (2003) Djorgovski, S. G., Bloom, J. S., & Kulkarni, S. R. 2003, ApJ, 591, L13
- Dong et al. (2003) Dong, S., Lin, D. N. C., & Murray, S. D. 2003, ApJ, 596, 930
- Ellison et al. (2006) Ellison, S. L., Vreeswijk, P., Ledoux, C., Willis, J. P., Jaunsen, A., Wijers, R. A. M. J., Smette, A., Fynbo, J. P. U., Møller, P., Hjorth, J., & Kaufer, A. 2006, MNRAS, 372, L38
- Faber et al. (2007) Faber, S. M., Willmer, C. N. A., Wolf, C., Koo, D. C., Weiner, B. J., Newman, J. A., Im, M., Coil, A. L., Conroy, C., Cooper, M. C., Davis, M., Finkbeiner, D. P., Gerke, B. F., Gebhardt, K., Groth, E. J., Guhathakurta, P., Harker, J., Kaiser, N., Kassin, S., Kleinheinrich, M., Konidaris, N. P., Kron, R. G., Lin, L., Luppino, G., Madgwick, D. S., Meisenheimer, K., Noeske, K. G., Phillips, A. C., Sarajedini, V. L., Schiavon, R. P., Simard, L., Szalay, A. S., Vogt, N. P., & Yan, R. 2007, ApJ, 665, 265
- Falcone et al. (2006a) Falcone, A. D., Barthelmy, S. D., Burrows, D. N., Cummings, J. R., Gehrels, N., Hunsberger, S. D., Kennea, J. A., & Palmer, D. M. 2006a, GRB Coordinates Network, 4966, 1
- Falcone et al. (2006b) Falcone, A. D., Burrows, D. N., & Kennea, J. 2006b, GRB Coordinates Network, 4973, 1
- Fruchter et al. (2006) Fruchter, A. S., Levan, A. J., Strolger, L., Vreeswijk, P. M., Thorsett, S. E., Bersier, D., Burud, I., Castro Cerón, J. M., Castro-Tirado, A. J., Conselice, C., Dahlen, T., Ferguson, H. C., Fynbo, J. P. U., Garnavich, P. M., Gibbons, R. A., Gorosabel, J., Gull, T. R., Hjorth, J., Holland, S. T., Kouveliotou, C., Levay, Z., Livio, M., Metzger, M. R., Nugent, P. E., Petro, L., Pian, E., Rhoads, J. E., Riess, A. G., Sahu, K. C., Smette, A., Tanvir, N. R., Wijers, R. A. M. J., & Woosley, S. E. 2006, Nature, 441, 463
- Fynbo et al. (2005) Fynbo, J. P. U., Gorosabel, J., Smette, A., Fruchter, A., Hjorth, J., Pedersen, K., Levan, A., Burud, I., Sahu, K., Vreeswijk, P. M., Bergeron, E., Kouveliotou, C., Tanvir, N., Thorsett, S. E., Wijers, R. A. M. J., Castro Cerón, J. M., Castro-Tirado, A., Garnavich, P., Holland, S. T., Jakobsson, P., Møller, P., Nugent, P., Pian, E., Rhoads, J., Thomsen, B., Watson, D., & Woosley, S. 2005, ApJ, 633, 317
- Fynbo et al. (2002) Fynbo, J. P. U., Möller, P., Thomsen, B., Hjorth, J., Gorosabel, J., Andersen, M. I., Egholm, M. P., Holland, S., Jensen, B. L., Pedersen, H., & Weidinger, M. 2002, A&A, 388, 425
- Gehrels et al. (2004) Gehrels, N., Chincarini, G., Giommi, P., Mason, K. O., Nousek, J. A., Wells, A. A., White, N. E., Barthelmy, S. D., Burrows, D. N., Cominsky, L. R., Hurley, K. C., Marshall, F. E., Mészáros, P., Roming, P. W. A., Angelini, L., Barbier, L. M., Belloni, T., Campana, S., Caraveo, P. A., Chester, M. M., Citterio, O., Cline, T. L., Cropper, M. S., Cummings, J. R., Dean, A. J., Feigelson, E. D., Fenimore, E. E., Frail, D. A., Fruchter, A. S., Garmire, G. P., Gendreau, K., Ghisellini, G., Greiner, J., Hill, J. E., Hunsberger, S. D., Krimm, H. A., Kulkarni, S. R., Kumar, P., Lebrun, F., Lloyd-Ronning, N. M., Markwardt, C. B., Mattson, B. J., Mushotzky, R. F., Norris, J. P., Osborne, J., Paczynski, B., Palmer, D. M., Park, H.-S., Parsons, A. M., Paul, J., Rees, M. J., Reynolds, C. S., Rhoads, J. E., Sasseen, T. P., Schaefer, B. E., Short, A. T., Smale, A. P., Smith, I. A., Stella, L., Tagliaferri, G., Takahashi, T., Tashiro, M., Townsley, L. K., Tueller, J., Turner, M. J. L., Vietri, M., Voges, W., Ward, M. J., Willingale, R., Zerbi, F. M., & Zhang, W. W. 2004, ApJ, 611, 1005
- Haehnelt et al. (1998) Haehnelt, M. G., Steinmetz, M., & Rauch, M. 1998, ApJ, 495, 647
- Hammer et al. (2006) Hammer, F., Flores, H., Schaerer, D., Dessauges-Zavadsky, M., Le Floc’h, E., & Puech, M. 2006, A&A, 454, 103
- Jakobsson et al. (2006) Jakobsson, P., Fynbo, J. P. U., Ledoux, C., Vreeswijk, P., Kann, D. A., Hjorth, J., Priddey, R. S., Tanvir, N. R., Reichart, D., Gorosabel, J., Klose, S., Watson, D., Sollerman, J., Fruchter, A. S., de Ugarte Postigo, A., Wiersema, K., Björnsson, G., Chapman, R., Thöne, C. C., Pedersen, K., & Jensen, B. L. 2006, A&A, 460, L13
- Jakobsson et al. (2003) Jakobsson, P., Hjorth, J., Fynbo, J. P. U., Gorosabel, J., Pedersen, K., Burud, I., Levan, A., Kouveliotou, C., Tanvir, N., Fruchter, A., Rhoads, J., Grav, T., Hansen, M. W., Michelsen, R., Andersen, M. I., Jensen, B. L., Pedersen, H., Thomsen, B., Weidinger, M., Bhargavi, S. G., Cowsik, R., & Pandey, S. B. 2003, A&A, 408, 941
- Jakobsson et al. (2004) Jakobsson, P., Hjorth, J., Fynbo, J. P. U., Weidinger, M., Gorosabel, J., Ledoux, C., Watson, D., Björnsson, G., Gudmundsson, E. H., Wijers, R. A. M. J., Möller, P., Pedersen, K., Sollerman, J., Henden, A. A., Jensen, B. L., Gilmore, A., Kilmartin, P., Levan, A., Castro Cerón, J. M., Castro-Tirado, A. J., Fruchter, A., Kouveliotou, C., Masetti, N., & Tanvir, N. 2004, A&A, 427, 785
- Kauffmann (1996) Kauffmann, G. 1996, MNRAS, 281, 475
- Kelly et al. (2008) Kelly, P. L., Kirshner, R. P., & Pahre, M. 2008, ApJ, 687, 1201
- Kennicutt (1998a) Kennicutt, Jr., R. C. 1998a, ARA&A, 36, 189
- Kennicutt (1998b) —. 1998b, ApJ, 498, 541
- Kocevski et al. (2006) Kocevski, D., Bloom, J. S., & Blake, C. H. 2006, GRB Coordinates Network, 4981, 1
- Kron (1980) Kron, R. G. 1980, ApJS, 43, 305
- Landolt (1992) Landolt, A. U. 1992, AJ, 104, 340
- Le Floc’h et al. (2003) Le Floc’h, E., Duc, P.-A., Mirabel, I. F., Sanders, D. B., Bosch, G., Diaz, R. J., Donzelli, C. J., Rodrigues, I., Courvoisier, T. J.-L., Greiner, J., Mereghetti, S., Melnick, J., Maza, J., & Minniti, D. 2003, A&A, 400, 499
- Martini et al. (2004) Martini, P., Persson, S. E., Murphy, D. C., Birk, C., Shectman, S. A., Gunnels, S. M., & Koch, E. 2004, in Presented at the Society of Photo-Optical Instrumentation Engineers (SPIE) Conference, Vol. 5492, Ground-based Instrumentation for Astronomy. Edited by Alan F. M. Moorwood and Iye Masanori. Proceedings of the SPIE, Volume 5492, pp. 1653-1660 (2004)., ed. A. F. M. Moorwood & M. Iye, 1653–1660
- Masetti et al. (2003) Masetti, N., Palazzi, E., Pian, E., Simoncelli, A., Hunt, L. K., Maiorano, E., Levan, A., Christensen, L., Rol, E., Savaglio, S., Falomo, R., Castro-Tirado, A. J., Hjorth, J., Delsanti, A., Pannella, M., Mohan, V., Pandey, S. B., Sagar, R., Amati, L., Burud, I., Castro Cerón, J. M., Frontera, F., Fruchter, A. S., Fynbo, J. P. U., Gorosabel, J., Kaper, L., Klose, S., Kouveliotou, C., Nicastro, L., Pedersen, H., Rhoads, J., Salamanca, I., Tanvir, N., Vreeswijk, P. M., Wijers, R. A. M. J., & van den Heuvel, E. P. J. 2003, A&A, 404, 465
- Matthews & Soifer (1994) Matthews, K., & Soifer, B. T. 1994, in Astrophysics and Space Science Library, Vol. 190, Astronomy with Arrays, The Next Generation, ed. I. S. McLean, 239–+
- McDonald & Miralda-Escudé (1999) McDonald, P., & Miralda-Escudé, J. 1999, ApJ, 519, 486
- Mo et al. (1998) Mo, H. J., Mao, S., & White, S. D. M. 1998, MNRAS, 295, 319
- Mo & Miralda-Escude (1996) Mo, H. J., & Miralda-Escude, J. 1996, ApJ, 469, 589
- Møller et al. (2002) Møller, P., Warren, S. J., Fall, S. M., Fynbo, J. U., & Jakobsen, P. 2002, ApJ, 574, 51
- Nulsen et al. (1998) Nulsen, P. E. J., Barcons, X., & Fabian, A. C. 1998, MNRAS, 301, 168
- Oke et al. (1995) Oke, J. B., Cohen, J. G., Carr, M., Cromer, J., Dingizian, A., Harris, F. H., Labrecque, S., Lucinio, R., Schaal, W., Epps, H., & Miller, J. 1995, PASP, 107, 375
- O’Meara et al. (2006) O’Meara, J. M., Chen, H.-W., & Kaplan, D. L. 2006, ApJ, 642, L9
- Perley et al. (2008) Perley, D. A., Li, W., Chornock, R., Prochaska, J. X., Butler, N. R., Chandra, P., Pollack, L. K., Bloom, J. S., Filippenko, A. V., Swan, H., Yuan, F., Akerlof, C., Auger, M. W., Cenko, S. B., Chen, H.-W., Fassnacht, C. D., Fox, D., Frail, D., Johansson, E. M., McKay, T., Le Mignant, D., Modjaz, M., Rujopakarn, W., Russel, R., Skinner, M. A., Smith, G. H., Smith, I., van Dam, M. A., & Yost, S. 2008, ApJ, 688, 470
- Persson et al. (1998) Persson, S. E., Murphy, D. C., Krzeminski, W., Roth, M., & Rieke, M. J. 1998, AJ, 116, 2475
- Prochaska et al. (2006) Prochaska, J. X., Chen, H.-W., & Bloom, J. S. 2006, ApJ, 648, 95
- Prochaska et al. (2007a) Prochaska, J. X., Chen, H.-W., Bloom, J. S., Dessauges-Zavadsky, M., O’Meara, J. M., Foley, R. J., Bernstein, R., Burles, S., Dupree, A. K., Falco, E., & Thompson, I. B. 2007a, ApJS, 168, 231
- Prochaska et al. (2007b) Prochaska, J. X., Chen, H.-W., Dessauges-Zavadsky, M., & Bloom, J. S. 2007b, ApJ, 666, 267
- Prochaska & Wolfe (1997) Prochaska, J. X., & Wolfe, A. M. 1997, ApJ, 487, 73
- Prochter et al. (2006) Prochter, G. E., Prochaska, J. X., Chen, H.-W., Bloom, J. S., Dessauges-Zavadsky, M., Foley, R. J., Lopez, S., Pettini, M., Dupree, A. K., & Guhathakurta, P. 2006, ApJ, 648, L93
- Rao et al. (2003) Rao, S. M., Nestor, D. B., Turnshek, D. A., Lane, W. M., Monier, E. M., & Bergeron, J. 2003, ApJ, 595, 94
- Rauch et al. (1997) Rauch, M., Miralda-Escude, J., Sargent, W. L. W., Barlow, T. A., Weinberg, D. H., Hernquist, L., Katz, N., Cen, R., & Ostriker, J. P. 1997, ApJ, 489, 7
- Savaglio (2006) Savaglio, S. 2006, New Journal of Physics, 8, 195
- Schlegel et al. (1998) Schlegel, D. J., Finkbeiner, D. P., & Davis, M. 1998, ApJ, 500, 525
- Skrutskie et al. (2006) Skrutskie, M. F., Cutri, R. M., Stiening, R., Weinberg, M. D., Schneider, S., Carpenter, J. M., Beichman, C., Capps, R., Chester, T., Elias, J., Huchra, J., Liebert, J., Lonsdale, C., Monet, D. G., Price, S., Seitzer, P., Jarrett, T., Kirkpatrick, J. D., Gizis, J. E., Howard, E., Evans, T., Fowler, J., Fullmer, L., Hurt, R., Light, R., Kopan, E. L., Marsh, K. A., McCallon, H. L., Tam, R., Van Dyk, S., & Wheelock, S. 2006, AJ, 131, 1163
- Steidel et al. (1994) Steidel, C. C., Dickinson, M., & Persson, S. E. 1994, ApJ, 437, L75
- Vreeswijk et al. (2007) Vreeswijk, P. M., Ledoux, C., Smette, A., Ellison, S. L., Jaunsen, A. O., Andersen, M. I., Fruchter, A. S., Fynbo, J. P. U., Hjorth, J., Kaufer, A., Møller, P., Petitjean, P., Savaglio, S., & Wijers, R. A. M. J. 2007, A&A, 468, 83
- Wizinowich et al. (2006) Wizinowich, P. L., Le Mignant, D., Bouchez, A. H., Campbell, R. D., Chin, J. C. Y., Contos, A. R., van Dam, M. A., Hartman, S. K., Johansson, E. M., Lafon, R. E., Lewis, H., Stomski, P. J., Summers, D. M., Brown, C. G., Danforth, P. M., Max, C. E., & Pennington, D. M. 2006, PASP, 118, 297
- Wolf & Podsiadlowski (2007) Wolf, C., & Podsiadlowski, P. 2007, MNRAS, 375, 1049
- Wolfe et al. (2005) Wolfe, A. M., Gawiser, E., & Prochaska, J. X. 2005, ARA&A, 43, 861
- Zheng et al. (2007) Zheng, Z., Coil, A. L., & Zehavi, I. 2007, ApJ, 667, 760
- Zibetti et al. (2007) Zibetti, S., Ménard, B., Nestor, D. B., Quider, A. M., Rao, S. M., & Turnshek, D. A. 2007, ApJ, 658, 161