A Re-interpretation of the STEREO/STE Observations and it’s Consequences
Abstract
We present an alternate interpretation of recent STEREO/STE observations which were attributed to energetic neutral atoms (ENA) from the heliosheath. The inferred ENA intensities, as a function of longitude, are very similar to the instrument response implying that the source or sources are quite narrow. Such narrow sources may be quite difficult to ascribe to the available sources of ENA, such as the charge exchange of energetic charged particles with ambient neutrals, which tend to be much broader. We point out that the largest intensity maximum observed by STEREO/STE is centered at the same ecliptic longitude as the brightest known X-ray source, Sco X-1. If this is indeed the source of the detected flux, it naturally accounts for the small source width. We find that the observed energy spectrum and intensity are also consistent with the X-rays from Sco X-1. If this interpretation is correct, then observers must take care in analyzing ENA data based on detectors sensitive to radiation other than ENA. The problem of energy dissipation in the solar wind termination shock remains unsolved while current understanding of the interaction between the solar wind and interstellar wind awaits future observations.
1 Introduction
Observations of energetic neutral atoms (ENA) from the heliosheath (the region between the heliospheric termination shock and the interface with the interstellar plasma) provide valuable constraints on the physics of the interaction of the Sun with the local interstellar medium. The recent crossings of the termination shock, first by Voyager 1 in late 2004 (see, e.g., Decker, et al. 2005, and Stone, et al. 2005), and more-recently by Voyager 2 in August of 2007 (see, e.g., Decker, et al. 2008 and Stone, et al. 2008), have continued a recent surge of activity and observations of this important part of space.
Remote observations of photons provide additional information. These range from backscattered UV to radio waves. It has been known for more than a decade (Hsieh et al. 1992, Hsieh and Gruntman, 1993, Hilchenbach et al. 1998) that the heliosheath is a significant source for ENA and that ENA can be used to remotely observe the heliosheath. The recently launched IBEX is the first mission specifically intended to map the ENA emissions to study the nature of the interaction of the Sun with the local interstellar medium (McComas et al. 2004). Simulations and modeling of this interaction has been successful in accounting for many of the properties of the distant solar wind, the termination shock and energetic particles.
Recently, Wang, et al. (2008) published an analysis of data from the STE instrument on the STEREO mission. This instrument was designed to measure energetic electrons from the Sun, but is also sensitive to neutral atoms and other radiations (Lin et al. 2008). The instrument has low angular resolution in ecliptic latitude , but its motion around the Sun gives it good resolution in ecliptic longitude . The hypothesis in that paper was put forth that the instrument was responding to ENA from the heliosheath.
Roelof (2008) pointed out that the shapes of the flux peaks were quite similar to the instrumental response, and that therefore the sources were likely quite narrow in longitude. Here we note that the location of the larger of the two flux maxima noted by Wang, et al. (2008, Fig. 3) is very close to the very bright X-ray source Sco X-1 and this is very likely the source of the signal. We present arguments which support this hypothesis and show that the energy spectrum and intensity are also in agreement with this interpretation. We suggest that the secondary flux maximum is caused by other X-ray sources near the galactic plane.
2 The Hypothesis of an X-ray Source
In the following ”ref. A” stands for ”Wang et al. (2008)” and ”ref. B” for ”Lin et al. (2008)”, since we will be referring to them often.
In this section, instead of interpreting the flux measure by STE-D as energetic neutral atoms (ENA) coming from the heliosheath, we examine the cause of the narrowness of the observed flux peaks reported in ref. A.
When scanning a radiation field with a detector, the measured angular distribution of the flux is the convolution of the angular spread of the source and the angular response function of the instrument. Only for a distant point source, represented by a Dirac delta function, will the measured distribution reproduce the response function. When the full-width at half maximum (FWHM) of the two measured flux peaks in ecliptic longitude () is comparable to the 30o FOV of the individual detectors in the ecliptic, a closer look at the detector’s angular response function is warranted.
We examine the angular response curve of D3 of STE-D in the ecliptic, because D3 of STE-D on STEREO B shows the clearest structure of the major flux peak, afforded by the longest period of low solar-wind electron flux.
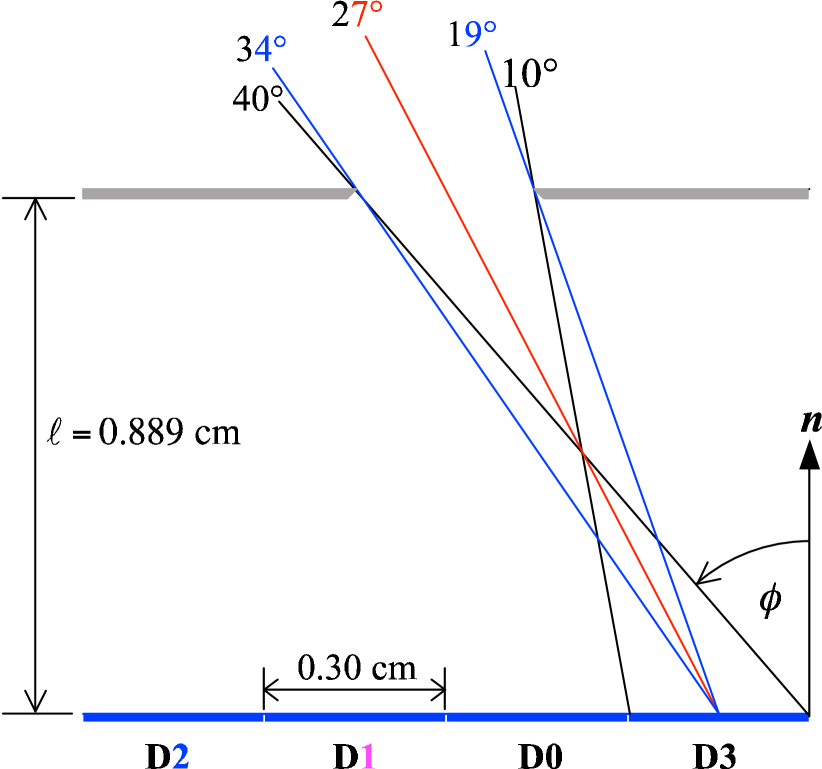
We examine the angular response curve of D3 of STE-D in the ecliptic plane, because D3 of STE-D on Stereo B shows the clearest structure of the major flux peak afforded by the longest period of low solar-wind electron flux. Hence we examine its anglular response curve in the eliptic (see Figs. 1 and 2 of ref. A). Each detector has a sensitive area cm2 and their shared rectangular aperture has dimensions 0.3 cm by 1.23 cm, same as the 4-detector array, but lying parallel to the detector plane and rotated 90o about the central axis connecting the center of the aperture and the center of the detector array. The separation of the two planes is 0.889 cm. Ignoring latitudinal effects - to be justified later - the angular response of D3 in the ecliptic is directly proportional to its exposed area projected normal to the incident beam from a given direction. With this geometry, D3 has a 30o FOV in the ecliptic spanning over , a triangular response function peaking at , and a geometrical factor of 0.021 cm2 sr. The slightly skewed and overlapping triangular response curves of the four detectors of STE-U are shown in Fig. 7 of ref. B.
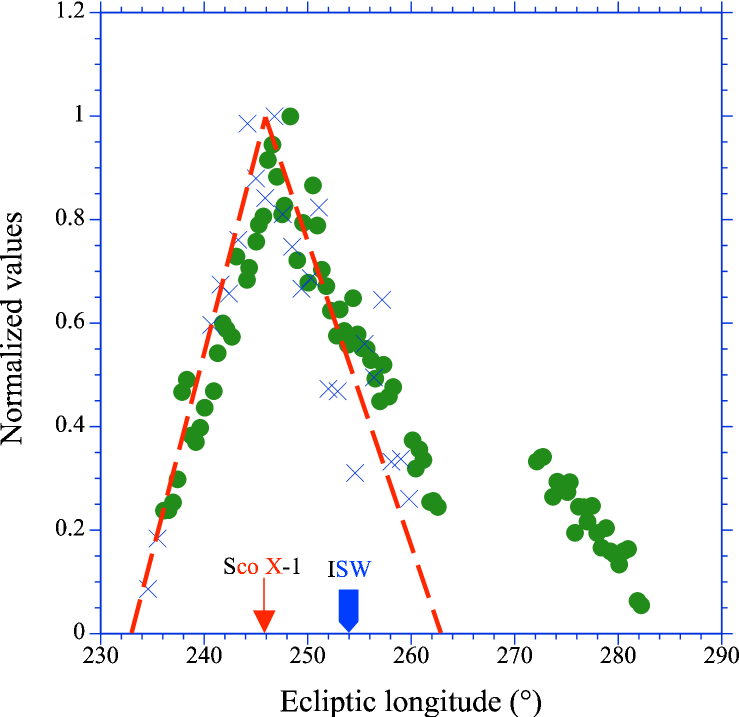
The one-dimensional response function of D3 and the angular distribution of the major flux peak measured by D3 of STE-D on STEREO B are compared in Fig. 2, after normalizing the two sets to their respective maximum values for convenience. The comparable angular spread in the data and the response function implies an extremely narrow source, which is currently very difficult to attribute to ENA of heliosheath origin. The more likely interpretation is the detection of 3 - 15 keV X-rays from a point source located near . The bright and variable X-ray binary Sco X-1, conveniently located at ecliptic coordinates and , becomes the convincing candidate. The low of Sco X-1 and STE-D’s 80o FOV in latitude justify our ignoring any latitudinal effects in considering the response function.
To further investigate Sco X-1 as the alternative source of the major flux peak detected by STEREO, we plotted (crosses in Fig. 2) the normalized 15-50 keV X-ray flux STEREO would have detected as D3 scans the ecliptic longitude range 245o to 260o and Sco X-1 transits its FOV from 2007 DOY 159 to 188. The X-ray flux used in this convolution is the daily averages for the said time interval, based on data from http://heasarc.gsfc.nasa.gov/docs/swift/ results/transients/. The two data sets (dots and crosses) deviate from the triangular response function with similar trend, even thought the two sets are not congruent. These variances can be understood in the context of the highly variable light curves of Sco X-1, a low mass X-ray binary, and in SWIFT/BAT’s data coverage. Abrupt changes in Sco X-1’s X-ray emission have durations ranging from minutes to weeks, but the corresponding light curves for the different bandpasses in the range 1.3 to 20 keV are correlated (McNamara et al., 1998). Because of the frequent short-term variations, unless STEREO and SWIFT/BAT had identical observation times, the two data sets cannot track each other. This deviation is worsened by the fact that the daily averages are based on varied data coverage, e. g., on DOY 169 (corresponds to in Fig. 2) SWIFT/BAT had more than 20 pointings with fluxes differing by a factor of seven, while on DOY 180 (corresponds to in Fig. 2) there was only one pointing with a low flux. In view of these facts, the resemblance of the longitudinal distribution of the peaked ”ENA” flux to that of the convolved X-ray flux from Sco X-1 strongly suggests Sco X-1 as the source of the major flux peak detected by STEREO. The variations among the measurements of the same flux peak by the different STE-D detectors on STEREO over time is consistent with this interpretation.
The extremely low-noise solid-state detectors used in STE are excellent X-ray detectors (Figure 5 of Tindall et al. 2008 and ref. B); but can Sco X-1 produce the flux and spectral shape detected by STE-D on STEREO A and B?
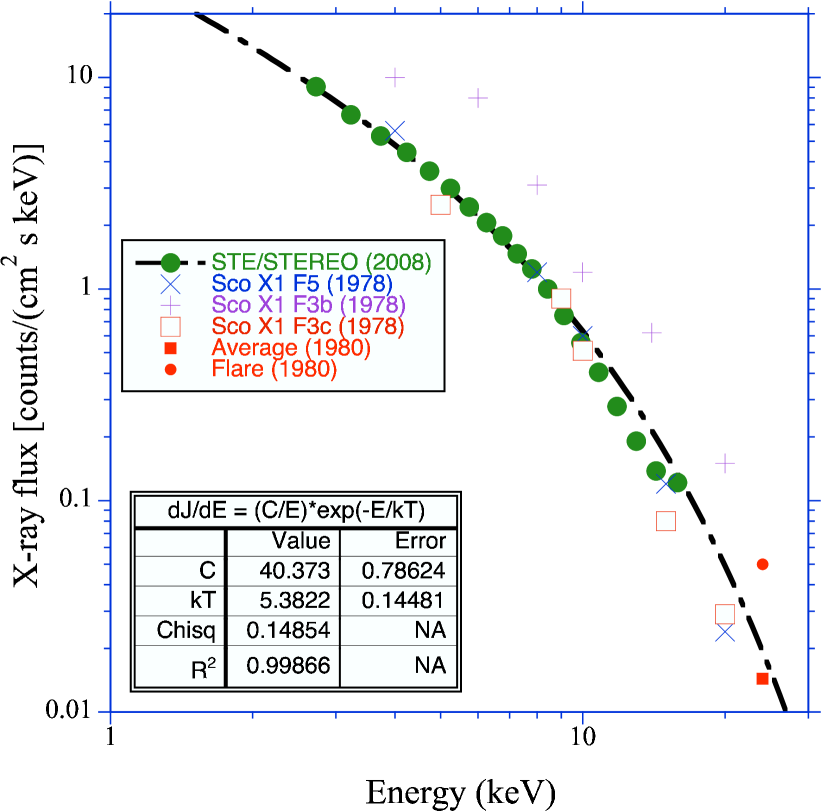
Reanalyzing the data collected by D3 of STE-D on STEREO A in ecliptic longitudes and on STEREO B in associated with the major flux peak assuming X-rays instead of ENA produces a time-averaged spectrum which can be compared with the known X-ray spectra of Sco X-1. In conversion from flux in ”counts/(cm2 sr s keV)” to a unidirectional flux in ”counts/(cm2 s keV)”, the average geometrical factor of 0.025 cm2 sr for four detectors is used. The energy designations of the data points are now based on the average response of four detectors to X-rays.
The reinterpreted STE-D measured spectrum of the major flux peak is compared with some published Sco X-1 X-ray spectra in Fig. 3. The X-ray spectra are taken from Miyamoto et al. (1978) and Rothschild et al. (1980). The model fit to a Bremsstrahlung in thermal equilibrium with the stellar plasma, , yields a temperature of 5.38 keV, which is not far from the range of temperature 2.5 keV (Miyamoto et al. 1978) to 5.15 keV (Rothschild et al. 1980), since Sco X-1 is a variable source. This would explain the variations between the flux and the response function shown in Fig. 2 and among the fluxes registered by the different detectors at different times (ref. A).
The arguments presented above, based on the angular spread of the major flux peak, the flux level and spectra shape, suggest strongly that X-rays coming from Sco X-1 is the preferred interpretation for the major flux peak.
3 Discussion and Conclusions
Noting the narrow width observed for the heliosheath ENA sources discussed by Wang et al. (2008), we have presented an alternate interpretation. We have demonstrated that the larger of the two peaks is consistent with it being caused by the X-ray source Sco X-1, which would produce a narrow peak in flux at about the correct location. Moreover, the intensity and energy spectrum are also consistent with this interpretation. Since producing such a narrow source using charge exchange of energetic charged particles and ambient neutral hydrogen is difficult, we feel that this identification is favored.
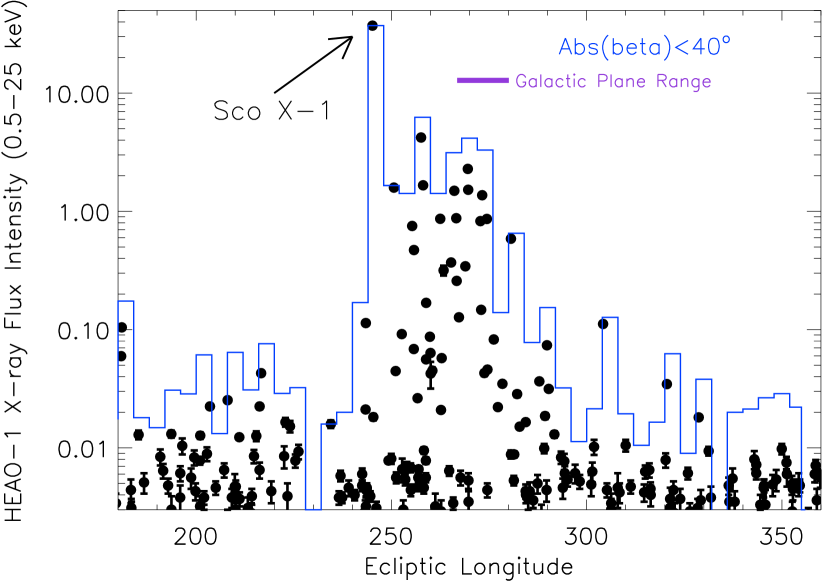
Judging from the shape of the minor peak at , especially the negative slopes at higher , we believe this peak is also due to X-ray sources. As Fig. 4 shows, there are a number of X-ray sources in the ecliptic longitude range of ), including those in the Galactic Center, but none of them alone are bright enough to account for the flux measured in the minor peak. We tentatively identify GX5-1 at and , Sgr X4 at and , and others shown in Fig. 4, as the combined source producing the minor peak. More detailed work will be needed to resolve the minor peak. We note that Collier et al. (2004) reported a similar low-energy ENA flux peak centered around (their Fig 4), which takes the shape of a skewed triangle with straight sides and a base, i.e. at zero flux, of days or .
From the experimentalist point of view, this exercise cautions us that X-rays are another background noise we have to deal with. For ENA instruments with triple coincidence, such as in HSTOF of CELIAS/SOHO (Hovestadt et al., 1995), HENA/IMAGE (Mitchell et al., 2000), and IBEX (McComas et al., 2004), X-ray should not be a concern. It is very important to remember that all ENA images are like photon images that they are convolutions of the source function and the instrument response function. Therefore, all observed angular distributions must be de-convolved prior to meaningful analysis.
This re-interpretation of the STEREO observations has consequences for the physics of the termination shock and heliosheath. The problem of the energy dissipated in the termination shock, suggested by Wang et al. (2008), on the basis of their original interpretation of the their data, remains unsolved. Understanding of the dynamics and morphology of the heliosheath in the direction of interstellar flow remains as previously understood (e.g., Czechowski, et al. 2008).
References
- (1)
- (2) Collier, M. R., T. E. Moore, D. Simpson, A. Roberts, et al., Adv. Space Res. 34, 166 (2004).
- (3)
- (4) Czechowski, A., M. Hilchenbach, K. C. Hsieh, S. Grzedzielski, and J. Kóta, Astron. & Astroph., 487, 329 (2008).
- (5)
- (6) Decker, R. B., Krimigis, S. M., Roelof, E. C., Hill, M. E., Armstrong, T. P., Gloeckler, G., Hamilton, D. C. and Lanzerotti, L. J., Science, 309, 2020 (2005).
- (7)
- (8) Decker, R. B., S. M. Krimigis, E. C. Roelof, M. E. Hill, T. P. Armstrong, G. Gloeckler, and D. C. Hamilton, Nature, 454, 67 (2008).
- (9)
- (10) Hilchenbach, M., K. C. Hsieh, D. Hovestadt, B. Klecker, H. et al., Astrophys. J. 503, 916 (1998).
- (11)
- (12) Hovestadt, D., M. Hilchenbach, A. B rgi, B. Klecker, et al., Solar Physics, 162, 441-481 (1995).
- (13)
- (14) Hsieh, K. C., K. L. Shih, J. R. Jokipii, and S. Grzedzielski, Astrophys. J. 393, 756 (1992).
- (15)
- (16) Hsieh, K. C. and M. A. Gruntman, Adv. Space Res. 33(6), 131-139 (1993).
- (17)
- (18) Lin, R. P., D. W. Curtis, D. E. Larson, J. G. Luhmann, S. E. McBride, M. R. Maier, T. Moreau, C. S. Tindall, P. Turin, Linghua Wang, Space Sci. Rev.136, 241 (2008).
- (19)
- (20) McNamara, R. J., T. E. Harrison, P. A. Mason, M. Templeton, C. W. Heikkila, T. Buckley, E. Galvan, A. Silva, and B. A. Harmon, Ap. J. Suppl., 116, 287 (1998).
- (21)
- (22) McComas, D., F. Allegrini, P. Bochsler, M. Bzowski, et al., Physics of the Outer Heliosphere: 3rd Annual IGPP Conference, eds. V. Florinski, N. V. Pogorelov and G. P. Zank, AIP Conference Proceedings 719, p. 162-181 (2004).
- (23)
- (24) Mitchell, D. G., S. Jaskulek, C. E. Schlemm, E. P. Keath, et al. , Space Sci. Rev. 91, p. 67, (2000).
- (25)
- (26) Miyamoto, S., M., Matsuoka, M., M. Oda, and Y. Ogawara, Astron. Astrophys. 65, 329 (1978).
- (27)
- (28) Roelof, E. C., Talk presented at the Huntsville Workshop ”The Physical Processes for Energy and Plasma Transport across Magnetic Boundaries”, Huntsville, AL, October, 2008.
- (29)
- (30) Rothschild, R. E., D.E. Gruber, F. K. Knight, P. L. Nolan, Y. Soong, Levine, A. M., F. A. Primini, W. A. Wheaton, and W. H. G. Lewin, ”A high sensitivity determination of the hard X-ray spectrum of Sco X-1”, Nature, 286, 786 (1980).
- (31)
- (32) Stone, E. C., Cummings, A. C., McDonald, F. B., Heikkila, B. C., Lal, N. and Webber, W. R., Science, 309, 2017 (2005).
- (33)
- (34) Stone, E. C., A. C. Cummings, F. B. McDonald, B. C. Heikkila, N. Lal, and W. R. Webber, Nature, 454, 71 (2008)
- (35)
- (36) Tindall, C. S., N. P. Palaio, B. A. Ludwigt, S. E. Holland, D. E. Larson, D. W. Curtis, S. E. McBride, T. Moreau, R. P. Lin, and V. Angelopoulos, IEEE Trans. Nuclear Sci., 55 (2), 797 (2008).
- (37)
- (38) Wang, L. , R. P. Lin, D. E. Larson, and J. G. Luhmann , Nature, 454, 81 (2008).
- (39)
- (40) Wood K.S., Meekins J.F., Yentis D.J., Smathers H.W., McNutt D.P., Bleach R.D., Byram E.T., Chubb T.A., Friedman H., Meidav M., Astroph. Jour. Suppl. 56, 507 (1984).
- (41)