50 \SetFirstPage001 \SetYear2009 \ReceivedDate \AcceptedDateYear Month Day
Ionization-bounded and Density-bounded Planetary Nebulae
Las nebulosas planetarias (y en general las regiones fotoionizadas) pueden clasificarse como acotadas por ionización (ionization-bounded) o bien acotadas por densidad (density-bounded). Es importante poder determinar en que caso está la nebulosa planetaria estudiada para poder estimar de observaciones nebulares, por ejemplo, la tasa total de fotones ionizantes producidos por la estrella central. En este artículo presentamos un criterio observacional sencillo que utiliza imagenes de radiocontinuo y que nos permite establecer una condición necesaria (pero no suficiente) para que la nebulosa planetaria pueda ser considerada como acotada por ionización. Aplicamos el criterio a dos nebulosas planetarias: NGC 7027 resulta muy posiblemente acotada por ionización, mientras que Hb 4 está acotada por densidad, al menos en ciertas direcciones.
Abstract
Planetary nebulae (and in general any photoionized region) can be classified as ionization-bounded or density-bounded. It is important to determine in which case is the planetary nebula studied to be able to estimate from nebular observations, for example, the total rate of ionizing photons produced by the central star. In this paper we present a simple observational criterion that uses radio continuum images and that allows to establish a necessary (but not sufficient) condition for the planetary nebula to be considered as ionization-bounded. We apply the criterion to two planetary nebulae: NGC 7027 is most possibly ionization-bounded, while Hb 4 is density-bounded, at least in some directions.
keywords:
PLANETARY NEBULAE: INDIVIDUAL (NGC 7027, Hb 4) — TECHNIQUES: IMAGE PROCESSING0.1 Introduction
Planetary nebulae, and in general any type of nebula photoionized by a central star or cluster of stars can be classified as either ionization-bounded or density-bounded. In the first case, the radius of the ionized region is determined by the absorption of the ionizing photons in the inner parts of the nebula. Even if there is more external gas available, it will remain neutral. In contrast, a density-bounded planetary nebula is one in which the ionized region terminates simply because there is no more gas available. Even if there are ionizing photons available, there will be no dense gas to ionize and the photons will escape to the diffuse halos that are known to surround planetary nebulae (Perinotto et al. 2004; Sandin et al. 2008).
When the nebula is visible in the optical, the presence of lines such as [O I] 6300 (i. e. Bieging et al. 2007), that originate from the region of transition between ionized and neutral hydrogen, suggests that the nebula is ionization-bounded. Also the association of the planetary nebula with neutral (Rodríguez & Moran 1982) or molecular (Treffers et al. 1976) hydrogen or with other molecular species (Thronson 1983) suggests ionization-boundness. However, the situation is not as simple since a nebula can be ionization-bounded in some directions (with respect to the ionizing star) and density-bounded in others and the evidence of a transition from ionized to neutral or molecular gas could be coming from some directions only.
It is relevant to know if a nebulae is ionization-bounded in all directions since in this case all the ionizing photon flux from the central star is trapped inside the nebula. Only in this case an accurate estimate of this ionizing flux can be derived indirectly by observing the nebular emission, for example in recombination lines or free-free emission. Otherwise, we will underestimate the ionizing photon flux. In an important development, Zijlstra et al. (2008) have reported Very Large Array observations taken over 25 years of NGC 7027 at frequencies above 5 GHz, where the free-free emission is optically thin. They find that the flux density is changing at a yearly rate of -0.1450.005% and propose that this is caused by a decrease in the number of ionizing photons coming from the central star. However, their conclusion assumes that this planetary nebula is ionization-bounded in all directions. This assumption seems very reasonable for NGC 7027 that is known to be associated with many molecular emissions and to possess large obscuration, suggesting that the ionized region is completely engulfed in neutral gas. However, this assumption should be tested. Finally, Mellema (2004) and Schönberner et al. (2005) have noted that the apparent expansion velocity in the plane of the sky of planetary nebulae that are ionization-bounded can be larger than the true expansion velocity of the gas since we also have the contribution of the outward motion of the ionization front as the nebula expands. This discrepancy becomes quite large during the optically-thin stage of nebular evolution (Schönberner et al. 2005). The knowledge of whether or not a nebula is ionization-bounded can be used to approximately correct for this effect.
In this paper we discuss a simple criterion that can be derived from good quality radio continuum images taken at frequencies where the ionized nebula is optically-thin. This analysis provides a necessary, although not sufficient, condition to classify a nebula as ionization-bounded. If the nebula fails the criterion, it can be considered to be density-bounded, at least in some directions (as seen from the central star).
0.2 The criterion
We make the following assumptions: i) the central star produces a photoionizing flux that is isotropic as seen from the position of the star, and ii) the nebula is optically-thin in the free-free continuum. The first assumption implies that, if the nebula is ionization-bounded, the rate of photoionizations (and recombinations) produced in the nebula is independent of direction and is a constant for a given solid angle (as seen from the star). Then, the number of free-free photons (that in steady state is proportional to the number of recombinations, e. g. Schraml & Mezger 1969), produced per differential of solid angle as seen from the star is a constant. This conclusion is valid even if the radius of the ionized gas is different in different directions. A larger density in a given direction will cause a smaller ionized radius, but the number of free-free photons produced per unit of volume will be larger, so the number of free-free photons produced per differential of solid angle will remain constant. The second assumption implies that all free-free photons produced escape from the nebula.
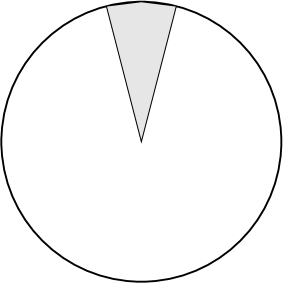
We now ask: what implications have these conclusions in the appearance of the nebula in the sky? As seen by the observer, we can split the nebula in identical “pie” slices centered in the central star (see Fig. 1), each with an opening angle given by radians. As seen from the central star each of these slices is a spherical wedge with solid angle given by steradians. Since this solid angle is constant for all wedges, we conclude that for a nebula to be ionization-bounded, the flux density in each of the slices should be constant, within the noise.
This simple test can be implemented by following the next steps: 1) obtain a good quality radio continuum image of a nebula at a frequency where it is known to be optically thin in the free-free emission, 2) define a center for the nebula either using the stellar position or symmetry considerations applied to the nebula, 3) use the task IRING of the NRAO software package AIPS (Astronomical Image Processing System) to determine the flux density in each of identical slices centered in the position determined in the previous step. The radius of these slices has to be large enough to contain all the nebular emission. Finally, 4) plot these flux densities as a function of the position angle of the slices to analyze their behavior.
0.3 Observations
The two sets of observations used in this study were obtained in the standard continuum mode and taken from the archive of the VLA of the NRAO111The National Radio Astronomy Observatory is operated by Associated Universities Inc. under cooperative agreement with the National Science Foundation.. One set was for NGC 7027 ( = PN G084.9-03.4), and was taken at 43.34 GHz on 2001 November 9 in the D configuration as part of the VLA Calibrator Flux Density project (R. A. Perley & B. Butler 2008, in preparation). The amplitude calibrator was 1331+305, with an adopted flux density of 1.46 Jy. NGC 7027 was used as its own phase calibrator, with a bootstrapped flux density of 4.900.13 Jy. This set was analyzed with the specific goal of testing the hypothesis of ionization-boundness of Zijlstra et al. (2008). The second set was for Hb 4 ( = PN G003.1+02.9), and was taken at 8.46 GHz on 2001 February 18 in the BnA as part of project AK528. The amplitude calibrator was 1331+305, with an adopted flux density of 5.21 Jy. The phase calibrator was 1745290, with a bootstrapped flux density of 0.670.02 Jy.
In Table 1 we present, for each planetary nebula, the position adopted as the center of the nebula (in both cases taken to be equal to the position of the minimum emission in the “bowl” that characterizes the morphology of these objects), and the frequency of the observations.
4
| PN | (2000)a | (2000)a | (GHz) |
| NGC 7027 | 21 07 01.74 | 42 14 09.4 | 43.34 |
| Hb 4 | 17 41 52.81 | -24 42 07.8 | 8.46 |
| \tabnotetextaUnits of right ascension are hours, minutes, and seconds, and units of declination are degrees, arcminutes, and arcseconds. |
The data were reduced using the standard VLA procedures in the software package AIPS of NRAO and then self-calibrated in phase and amplitude. The images were made with the ROBUST weighting parameter (Briggs 1995) of AIPS set to 0.
0.4 Interpretation and Results
0.4.1 NGC 7027
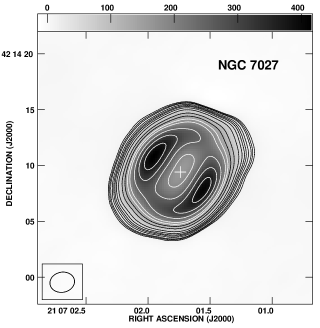
In Figure 2 we show the 43.34 GHz image of NGC 7027. This planetary nebula is known to be optically-thin above 5 GHz (Zijlstra et al. 2008), so we expect this 43.34 GHz image to be tracing optically-thin free-free emission. In Figure 3 we plot the flux densities of each slice as a function of their position angle. The slices were made with an angular radius of 10′′ and an opening of , with the position angle incrementing by . This flux density per slice is approximately constant (only small modulations at the 10% level are present). We conclude that this result is consistent with NGC 7027 being ionization-bounded in all directions, in agreement with the assumption of Zijlstra et al. (2008). This test is relevant because if NGC 7027 were density-bounded in some directions, the observed decrease in flux density could be due to the expansion of the nebula, allowing more ionizing photons to escape in the directions where the nebula is density-bounded and not to a decrease in the number of ionizing photons from the central star. The assumption of NGC 7027 being ionization-bounded is fundamental for the Zijlstra et al. (2008) analysis and our results are consistent with this assumption.

Unfortunately, the constancy in the flux density of the slices is not a sufficient condition to assure ionization-boundness: an ionized ring seen face-on would show this same constancy but it will be density-bounded along the line of sight.
0.4.2 Hb 4
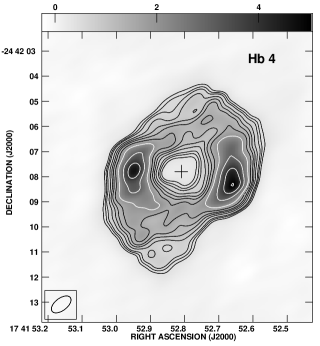

In Figure 4 we show the 8.46 GHz image of Hb 4. The 1.4 and 5.0 GHz flux densities of this planetary nebula are 158 mJy (Condon & Kaplan 1998) and 170 mJy (Aaquist & Kwok 1990), respectively. This indicates that the nebula is optically-thin above 1.4 GHz, so we expect the 8.46 GHz image to be tracing optically-thin free-free emission. In Figure 5 we plot the flux densities of each slice as a function of their position angle. The slices were made, as for NGC 7027, with an angular radius of 10′′, every . In contrast to NGC 7027, the flux density per slice of Hb 4 shows a strong modulation. This modulation implies that the nebula is density-bounded at least in the NW and SE position angles, where ionizing photons will be escaping to the interstellar medium. We conclude that this result indicates that Hb 4 is not ionization-bounded in all directions. An estimate of the stellar ionizing flux from indicators like H or free-free emission will then result in an underestimate of the true value.
0.5 Conclusions
We present a simple observational test that allows to establish if an ionized nebula is ionization-bounded or not. The condition is necessary but not sufficient. We applied this test to NGC 7027 and Hb 4, finding that the first object is probably ionization-bounded while the second is density-bounded, at least in some directions.
Acknowledgements.
LFR and YG acknowledge the support of DGAPA, UNAM, and of CONACyT (México). This research has made use of the SIMBAD database, operated at CDS, Strasbourg, France.References
- (1) Aaquist, O. B., & Kwok, S. 1990, A&AS, 84, 229
- (2) Bieging, J. H., Boley, P. A., Latter, W. B., & Tielens, A. G. G. M. 2008, ApJ, 676, 390
- (3) Briggs, D. 1995, Ph.D. thesis, New Mexico Inst. of Mining and Technology
- (4) Condon, J. J., & Kaplan, D. L. 1998, ApJS, 117, 361
- (5) Mellema, G. 2004, A&A, 416, 623
- (6) Perinotto, M., Schönberner, D., Steffen, M., & Calonaci, C. 2004, A&A, 414, 993
- (7) Rodríguez, L. F., & Moran, J. M. 1982, Nature, 299, 323
- (8) Sandin, C., Schönberner, D., Roth, M. M., Steffen, M., Böhm, P., & Monreal-Ibero, A. 2008, A&A, 486, 545
- (9) Schönberner, D., Jacob, R., & Steffen, M. 2005, A&A, 441, 573
- (10) Schraml, J., & Mezger, P. G. 1969, ApJ, 156, 269
- (11) Thronson, H. A., Jr. 1983, ApJ, 264, 599
- (12) Treffers, R. R., Fink, U., Larson, H. P., & Gautier, T. N., III 1976, ApJ, 209, 793
- (13) Zijlstra, A. A., van Hoof, P. A. M., & Perley, R. A. 2008, ApJ, 681, 1296