Temperature dependence of the bulk energy gap in underdoped Bi-2212: Evidence for the mean-field superconducting transition.
Abstract
Understanding of the puzzling phenomenon of high temperature superconductivity requires reliable spectroscopic information about temperature dependence of the bulk electronic density of states. Here I present a comprehensive analysis of evolution of bulk electronic spectra in Bi-2212 obtained by Intrinsic Tunneling Spectroscopy on small mesa structures. Unambiguous spectroscopic information is obtained by obviation of self-heating problem and by improving the spectroscopic resolution. The obtained data indicate that the superconducting transition maintains the mean-field character down to moderate underdoping, and is associated with an abrupt opening of the superconducting gap, which is well described by the conventional BCS dependence. The mean-field critical temperature reaches maximum at the optimal doping and decreases with underdoping. Such behavior is inconsistent with theories assuming intimate connection between superconducting and antiferromagnetic spin gaps, and support proposals associating high temperature superconductivity with the presence of competing ground states and a quantum critical point near optimal doping.
pacs:
74.72.Hs 74.45.+c 74.50.+r 74.25.JbI Introduction
How does high temperature superconductivity (HTSC) evolve with decreasing temperature and what happens at the superconducting transition? Where is the real critical temperature ? Does HTSC becomes stronger or weaker upon approaching the undoped antiferromagnetic state? These highly debated questions are crucial for understanding the puzzling HTSC phenomenon. The answers to all those questions could be obtained from the analysis of temperature dependence of the superconducting energy gap in the quasiparticle (QP) density of states.
So far the majority of spectroscopic studies on HTSC were made by surface sensitive techniques Ding ; ARPESp ; Lee2007 ; ARPESreview ; Renner ; Yazdani ; Misra . However, obtaining reliable spectroscopic information from surface spectroscopy on HTSC is immensely difficult: atomic-scale axis coherence length, rapid chemical deterioration, presence of the surface states ARPESreview and inherently different doping state of the surface, may preclude determination of bulk electronic properties by surface sensitive techniques. Furthermore, for Bi2Sr2CaCu2O8+δ (Bi-2212) the surface spectroscopy probes the BiO rather than the superconducting CuO2 plane Misra . All this urges the necessity of bulk spectroscopy of HTSC.
Intrinsic Tunneling Spectroscopy (ITS) provides a unique opportunity to probe bulk electronic properties of HTSC. This relatively new technique utilizes weak interlayer (axis) coupling in quasi two dimensional HTSC compounds, in which mobile charge carriers are confined in CuO2 planes separated by some blocking layer (e.g. SrO-2BiO-SrO in case of Bi-2212). This leads to formation of natural, atomic scale intrinsic tunnel junctions, and to appearance of the intrinsic Josephson effect at Kleiner ; Fiske ; LatyshPhC ; Kim ; Wang ; Fluct ; MQT ; Latysh ; Ooi . ITS is well suited for clarification of questions highlighted above: it is a direct spectroscopic technique, is not sensitive to phase coherence, has very high resolution ( achievable), is mechanically stable and thus perfectly suited for dependent studies of HTSC (unlike surface probe techniques), and, most importantly, probes bulk electronic properties of HTSC.
This work represents a comprehensive analysis of temperature dependence of the bulk energy gap obtained by ITS on small Bi-2212 mesa structures. Unambiguous is obtained by careful obviation and cancelation of self-heating. Improved resolution by means of differential ITS allows tracing the gap in the phase-incoherent state at . It is observed that at all studied doping levels, the superconducting gap opens abruptly in a mean-field manner and is well described by the conventional BCS temperature dependence. The mean-field critical temperature decreases with underdoping, thus confronting speculations about persistence of superconductivity up to very high temperatures above in underdoped HTSC. In most underdoped crystals a remaining, weakly dependent pseudogap (PG, ) is observed at . The pseudogap seems to form a combined gap with the BCS-like superconducting gap below , and thus compete with superconductivity. No signature of the PG is observed at the optimal doping. The obtained results are inconsistent with theories assuming intimate connection between superconducting and antiferromagnetic spin gaps, and support proposals associating HTSC with the presence of competing ground states and a quantum critical point near optimal doping.
In conventional low temperature superconductors (LTSC) superconducting transition occurs as a result of the second-order phase transition. It is associated with abrupt appearance of the order parameter, represented by the superconducting energy gap , and by linear growth of the upper critical field: . The correlation is fundamental, because is inversely proportional to the square of the coherence length Cooper pair size, which is inversely proportional to the pair coupling energy . All this is perfectly described by the mean-field BCS-Eliashberg theory of superconductivity BCSE .
But how does HTSC emerge with decreasing temperature, and what happens at remain unclear. For overdoped cuprates, thermodynamic characteristics reveal unambiguous evidence of the second-order phase transition at TallonPhC . Similarly, analysis of Nernst effect Huebener , equilibrium Landau and fluctuation Fluct1 ; Fluct2 magnetization and resistivity Bouquet reveal vanishing of in a wide doping range. However, in underdoped cuprates, characterized by the persistence of the normal state pseudogap at , the superconducting transition at becomes obscured and both thermodynamic TallonPhC and transport Ong properties become abnormal. According to some reports neither Renner , nor Ong vanish at , although different interpretations of similar data are possible Fluct1 ; Yazdani , and vanishing gap at was also reported Deutscher ; KrTemp ; Doping ; Raman ; Lee2007 .
A related controversy exists about doping dependence of the coupling strength in HTSC. Although and decrease with underdoping Hc2 ; Ong , the gap measured by surface sensitive techniques was reported to grow Renner ; Ding . This has been taken as evidence for a continuously increasing superconducting coupling strength upon approaching the antiferromagnetic state, assuming an intimate connection between the two states AF . If true, this would indicate that HTSC has a magnetic origin. However, other experiments reveal the existence of two distinct energy scales, of which one indeed increases with approaching the antiferromagnetic state, while the other follows at all doping levels Deutscher ; KrTemp ; Doping ; Raman ; Lee2007 .
Does HTSC becomes stronger or weaker with approaching the antiferromagnetic state? Again, the answer could be obtained by understanding, what happens at . If the coupling strength is increasing with underdoping, then so does . Some researchers assume that may exceed the room temperature already at moderate underdoping Renner ; Ong ; Tesanovic . To cope with the apparent decrease with underdoping of transport , at which phase coherence is achieved in transport measurements, one has to assume the existence of an extended region in which the amplitude of the superconducting order parameter is large but the phase coherence is destroyed by thermal fluctuations Precursor .
The extent of the phase incoherent state is described by the Ginzburg-Levanyuk parameter Larkin . For clean LTSC the fluctuation region is very small because of very small , where is the Fermi temperature Larkin . Even for HTSC, . Therefore, expansion of the phase-incoherent state well below requires , which can be achieved only by decreasing the dimensionality of the system Larkin . Thus one has to assume that superconductivity is either one-dimensional (e.g. due to the presence of stripes AF ) or zero-dimensional (as in granular superconducting films Granular ). In this case, there would be no second order phase transition, nor significant amplitude fluctuations of the order parameter upon establishing of the phase coherence at , the superconducting gap would persist at , and could be directly measured by tunneling spectroscopy. Therefore, the knowledge of close and above is crucial for understanding HTSC.
An important clue to understanding temperature evolution of electronic states in HTSC was provided by recent surface photoemission experiments ARPESp , which, unlike earlier works, showed that does not have a simple wave momentum dependence, but is described by two distinct energy scales Lee2007 . The anti-nodal gap has weak temperature dependence at and turns into the pseudogap at . Furthermore, it increases with underdoping and tends to merge with the insulating gap in the undoped antiferromagnetic state. On the other hand the gap in the nodal “Fermi arc” region must be associated with superconductivity because it follows and vanishes close to at all doping levels. Although those observations are consistent with several previous reports KrTemp ; Doping ; Raman , the reliability of surface spectroscopy of HTSC is now under question, because it fails to reveal the electron-like Fermi surface, uncovered by recent quantum oscillation experiments VanAlphen .
The paper is organized as follows. In Sec. II I describe samples and emphasize the dramatic difference between surface and bulk properties of Bi-2212 crystals. Sec. III contains basic characterization of temperature and size-dependencies of ITS on small mesas. In sec. IV main experimental results on temperature dependence of the bulk gap in Bi-2212 are presented. It is shown that self-heating is effectively obviated by decreasing mesa size and can be simply canceled out from experimental data. The observed results are discussed and summarized in sec.V. In Appendix-A, self-heating and non-equilibrium effects in intrinsic tunnel junctions are analyzed. In Appendix-B artifacts of in-plane resistance and limitations on the junction size are discussed.
| Sample | (0) | References | |||||||
| (K) | (K) | (K) | (meV) | (meV) | (meV) | (A/cm2) | |||
| SMa | 9 | 95 | 91.5 | 96 | 33.9 | 0 | 25 | 1000 | Ref.Heat |
| S42 | 9 | 93.3 | 92.1 | 93 | 33.4 | 0 | 22 | 1100 | Ref.KrTemp |
| S92 | 34 | 86 | 80 | 90 | 34.6 | 0 | 34 | 300 | Refs. Heat ; Fluct ; Sven |
| 87 | 32.7 | 12 | |||||||
| S43 | 8 | 86.5 | 81.5 | 90 | 42.5 | 0 | 32.5 | 510 | Ref.Doping |
| 85 | 38 | 19 | |||||||
| S82 | 7 | 78 | 73 | 89 | 46 | 0 | 28 | 270 | Ref.Doping |
| 87 | 44.8 | 11 |
II Experimental
Interlayer tunneling occurs in various layered HTSC compounds, such as Bi-2212 KrTemp ; Doping ; Suzuki ; Latysh ; Lee ; Cascade , Bi-2201 YurgensBi2201 , Tl-2212Schlen ; Warburton YBaCuO YBaCu , and some others RuCuO , as well as in intercalated compounds KrMag . ITS was also expanded to non-HTSC layered compounds LatyshevNbSe ; Manganite .
Observation of the intrinsic Josephson effect Kleiner at provides the most clear evidence for interlayer tunneling in strongly anisotropic layered HTSC. At present all major fingerprints of the intrinsic Josephson effect were observed, including Fiske Fiske ; LatyshPhC ; Kim and Shapiro LatyshPhC ; Wang steps in Current-Voltage characteristics (IVC); the Josephson plasma resonance Plasma ; thermal activation Fluct and macroscopic quantum tunneling MQT from the Josephson washboard potential; and the flux quantization Fiske ; LatyshPhC ; Kim ; Latysh ; Ooi . The latter experiments explicitly confirmed the correspondence between the stacking periodicity of intrinsic Josephson junctions (IJJs) and the crystallographic unit cell of Bi-2212.
Several techniques for preparation of IJJs have been developed, such as patterning mesa structures on top of single crystals YurgensPRL , 3D-sculpturing by Focused Ion Beam (FIB) Kim ; Latysh and double-side fabrication Wang .
Here all measurements were performed on small mesa structures because they are best suited for ITS: they have the best thermal anchoring and are less prone to self-heating and other artifacts, as described in the Appendix. All measurements were made in the three-probe configuration, which is more robust toward artifacts, as discussed in Appendix-B.
II.1 Samples
To avoid variations caused by different crystal stoichiometry, single crystals from the same batch of Y-substituted Bi2Sr2Ca1-xYxCu2O8+δ (Bi(Y)-2212) were used in this work, with the onset of superconductivity at optimal doping at K. Obtained results are not specific for this batch, see e.g. Ref.Suzuki ; Lee ; Sven .
Several mesas of sizes from to were patterned simultaneously on each crystal by photolithography and Ar-ion milling. All mesas usually contained the same amount of IJJs . The virgin crystals were slightly overdoped with . Ar-ion milling, provides very uniform and controlled etching, but is accompanied by substantial heating at high-vacuum. This results in partial out-diffusion of Oxygen, so that mesas become underdoped. To reduce self-heating, some mesas were trimmed to sub-micron size by FIB. Details of mesa fabrication are described in Ref.Fluct .
Table-I summarizes crystals used in this study. To save space and avoid repetitions, I show only a limited amount of raw data and instead address the reader to previous works listed in Table-I. All of the studied mesas exhibited good periodicity of QP branches in the IVC, indicating good uniformity of IJJs in the mesas (see the insets in Fig. 2a) and references in Table-I).
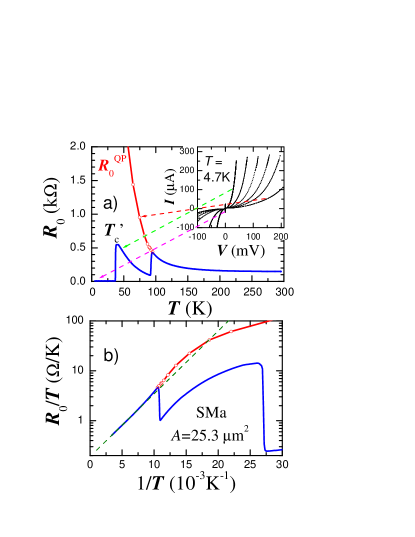
The solid line in Fig. 1 a) shows a typical resistive transition for a near optimally doped mesa on SMa sample. Here is the zero bias resistance measured with small ac current. One can see two transitions (three branches) in : the major part of the mesa goes into the superconducting state at , while the final transition takes place at . To clarify their origins, the IVC of this mesa at is shown in the inset of Fig. 1 a). It is seen that the IVC is strongly hysteretic and consist of periodic QP branches due to sequential switching of IJJs between superconducting and resistive states. The hysteresis is typical for tunnel junctions and is caused by low damping and large specific capacitance of the junctions Collapse ; CollapsePRB , which allows junctions to remain in the resistive state even below the critical current. Distinct branches in in the superconducting state are originating from different sections of the hysteretic IVC, as indicated by arrows in Fig. 1 a).
Experiments on small mesas allow measurement of the QP resistance at different bias, , in the superconducting state YurgensPRL ; Latysh ; Sven , which is otherwise shunted by the supercurrent Morozov . Circles in Fig. 1 a) show the zero-bias QP resistance obtained by extrapolation to of the last QP branch with all IJJ’s in the resistive state. The QP resistance at different bias can be also measured explicitly by first pulsing a current above the critical current and then ramping it down to a desired value Sven . Bias yields an additional parameter for intrinsic tunneling studies, which may render crucial for correct interpretation of the data Sven .
II.2 Surface versus bulk properties
As seen from the inset in Fig.1a), the critical current of the first junction is much smaller than that for the rest of the junctions . This is the top IJJ in the mesa, between the two outmost CuO planes. It is seen that the surface CuO plane is superconducting, but has a lower critical temperature .
Noticeably, the critical current and the QP resistance of the second junction, formed by the second and third CuO planes below the surface, is practically the same as for the rest of the junctions. This unambiguously shows that suppression of superconductivity is solely the surface phenomenon and occur only in the top CuO plane, and that “bulk” behavior starts already from the second CuO layer below the surface.
The reduction of surface in our mesas is predominantly caused by chemical deterioration in atmosphere during a short period between cleavage of the Bi-2212 crystal and deposition of the top Au protection layer. Such deterioration was studied in detail in Ref.Wei , where it was shown that could be increased to , if cleavage and deposition are made quickly without breaking vacuum (replicating conditions for surface spectroscopy of HTSC ARPESp ; Lee2007 ; ARPESreview ; Renner ; Yazdani ). This is still substantially lower than the bulk .
The remaining suppression of of the surface layer is often attributed to the proximity effect with the electrode. However, I would like to note that although the top CuO layer has a lower (in some samples less than 20K) the second layer is perfectly “bulk”, i.e. not deteriorated with respect to deeper laying layers. Thus, there is no detectable proximity effect between the first and the second CuO layers. This is natural because the transparency of the interlayer barrier is low (prerequisite of the tunnel junction) and the axis coherence length is sub-atomic (). Exactly for the same reasons there should be no considerable proximity effect between the electrode and the top CuO layer, because those are also separated by the blocking BiO layer.
More likely, the suppressed reflects the fundamental difference between the surface and the bulk e.g., because the surface is lower doped than the bulk. It should be also noted that even in UHV conditions the chemical deterioration of un-protected Bi-2212 surface is non-negligible. Note that the time of deposition of a monolayer is only at the residual pressure and even in state of the art surface spectroscopy systems is at best a matter of few hours.
In any case the observed abrupt transition from the surface to the bulk properties within just one atomic layer from the surface clearly indicates that it is not at all granted that the surface spectroscopy can uncover substantial information about bulk electronic properties of HTSC. All this urges the necessity of bulk spectroscopy of HTSC, as emphasized in the Introduction.
III Intrinsic tunneling characteristics of small mesas
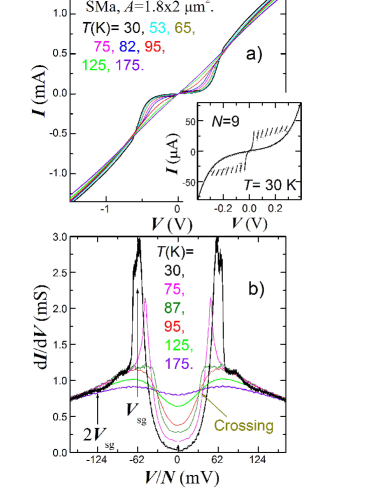
Figs. 2 a) and b) show the axis and characteristics of a small mesa on the near optimally doped SMa sample at different . A pronounced kink in (peak in ), followed by the ohmic and almost independent tunnel resistance is seen KrTemp . Such the IVC is typical for superconducting tunnel junctions, as demonstrated in Fig. 3 a), and is associated with the sum-gap singularity at , providing the basis for ITS and opening a possibility to study bulk electronic spectra of HTSC.
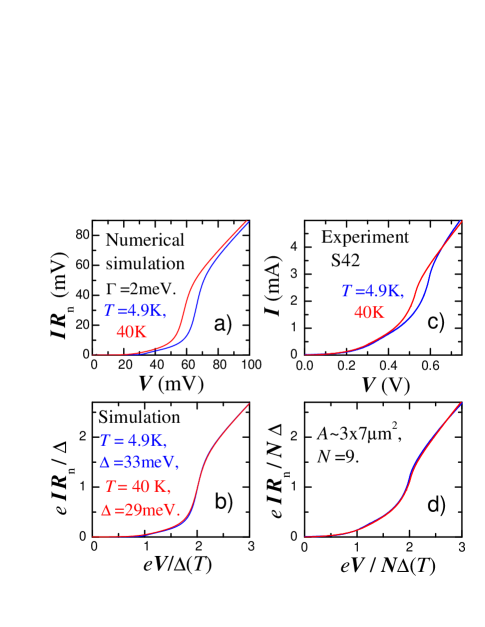
Fig. 3 a) shows numerically simulated IVCs at 4.9K and 40 K for a superconducting tunnel junction with a gapless density of states at the Fermi level. The gaplessness was achieved by introducing an appropriate depairing factor into the BCS density of states. Parameters were chosen to fit experimental data for the S42 sample, shown in Fig. 3 c). Clearly, decreased from 33 meV at 4.9 K to 29 meV at 40 K. Fig.3 b) shows the same calculated IVC’s in which both current and voltage scales are normalized by the gap. It is seen that the curves merge, because at low both and scales . A similar scaling is also observed for experimental data, shown in Fig. 3 d), confirming that the kink is related to the sum-gap singularity. Additional arguments can be found in the Appendix A-1.
The sum-gap singularity is not the only gap-related feature in ITS. Further check for self-consistency of our interpretation can be obtained from analysis of additional, more subtle gap-related features in . The arrow in Fig. 2 b) indicates a small dip at . It was studied in Ref. Cascade and was attributed to enhancement of non-equilibrium effects at , when relaxation radiation of tunneled quasiparticles becomes sufficient for breaking Cooper pairs.
III.1 Self-heating free characteristics
It is fair to say that ITS has became a spectroscopic tool as a result of reduction of self-heating. No independent ohmic tunnel resistance, as in Fig. 2 a), could be seen in earlier works Kleiner ; YurgensPRL ; Gough , dealing with large structures. Larger self-heating in such structures leads to development of an acute thermal instability HotSpot at voltages much smaller than . Another problem in large structures is associated with the limited amount of supercurrent that the CuO plane can carry (see Appendix-B). It is interesting to note that exactly the same problems were encountered at the early stage of experimental studies on LTSC tunnel junctions Giaever4p .
In order to obtain unambiguous spectroscopic information, the problem of self-heating has to be carefully addressed. The temperature rise due to self-heating is given by a simple expression CollapsePRB
| (1) |
where is the dissipated power and is the effective thermal resistance of the mesa, which is dependent and, therefore, bias dependent Heat . Detailed analysis of self-heating in ITS, including numerical simulations of distortion of IVCs by self-heating can be found in Appendix-A.
In recent years different ways of obviating self-heating in ITS were employed, such as pulse measurements Suzuki , miniaturization HeatJAP ; Heat and heat compensation Lee . In Ref.Heat it was emphasized that miniaturization decreases self-heating at a given voltage per junction and provides an unambiguous way for discrimination of artifacts of self-heating (size-dependent) from electronic spectra (material property, size-independent).
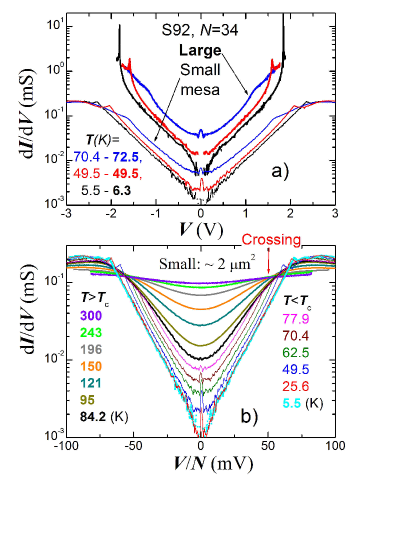
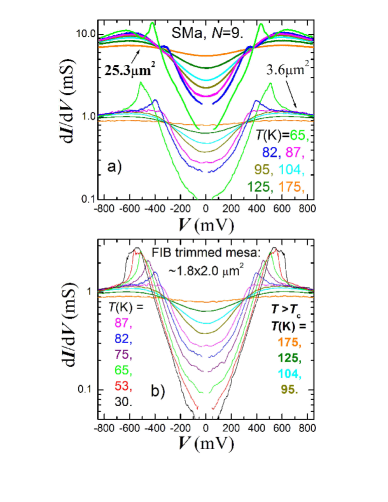
In Figs. 4a) and 5a) characteristics of large and small mesas on samples S92 (moderately underdoped) and SMa (near optimally doped), respectively, are shown. It is clearly seen how self-heating distorts the last QP branch in large mesas. At low bias, when self-heating is negligible, the characteristics of both mesas are undistorted and the curves remain linear and parallel, i.e., simply scale with the mesa area. However, at larger bias in the larger mesas starts to growth faster (super-linear) because the sub-gap conductance increases with (see Fig. 2b). The larger mesas also reach the peak earlier, i.e., at lower voltage, as a result of suppression of the gap by .
Figs. 4 and 5 b) show evolution of characteristics for the smallest mesas. It is seen that the characteristics for those mesas remain linear in the whole sub-gap region , indicating that they are not distorted by self-heating up to . For both mesas this was explicitly proven in Ref.Heat : for SMa by size-independence of the peak voltage and for S92 by in-situ measurement of self-heating.
Note that heating-free ITS characteristics for both crystals have a remarkably trivial V-shape in the semi-log scale, and that the slope of the curves for both samples experience an abrupt crossover from thermal-activation (TA) like dependence at to tunneling-like independent slope at . As discussed in Ref.Sven , this indicates opening of an additional quantum transport channel for Cooper pairs at .
III.2 Thermal-activation behavior in the normal state
In Ref.Sven it was shown that at ITS characteristics exhibit TA behavior. Up to moderately high bias they are described by a simple expression:
| (2) |
with a constant TA barrier . Indeed, the term reproduces the rounded V-shape of curves with the slope that increases as . The TA behavior at zero bias at is demonstrated in Fig. 1 b). In order to expand the TA-analysis to higher bias, we have to carefully integrate TA-current through the junction:
| (3) | |||
Here is the transition probability of the TA process, and is the effective TA barrier , are density of states in electrodes and Fermi distributions.
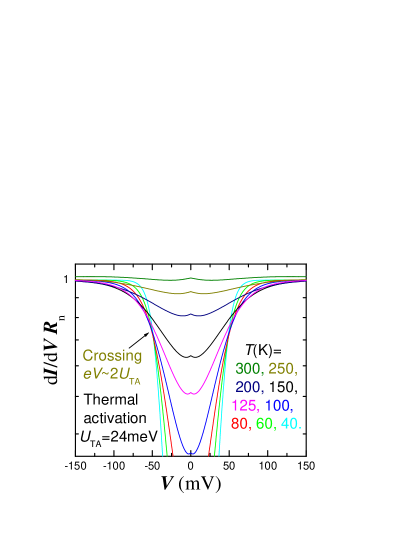
Fig. 6 shows simulated characteristics (in the semi-log scale) obtained from Eq.(3) with meV and for completely normal electrodes const. It reproduces all characteristic features of experimental data at , including the crossing point at and the inverted parabolic shape at high temperatures Doping .
Apparently, the axis TA barrier should be identified with the phenomenon referred to as the large axis pseudogap in the previous literature. However, the amazing success of the trivial TA model, with only one constant parameter in the whole normal region and without any momentum dependent gap in the density of states, suggests that the axis pseudogap is most probably not the gap in electronic spectrum of CuO layers, but the property of the blocking BiO layer. Possible “non-gap” origins of the axis TA barrier were discussed in Ref.Sven . Those include resonant tunneling through the impurity state in the blocking layer, inelastic tunneling with excitation of a molecular mode in the barrier, and Coulomb blocking of tunneling in the poorly conducting two-dimensional electron system. As already noted in Ref.KrTemp , the later bares a striking similarity with experimental V-shape characteristics. The Coulomb blocking depends entirely on the conductivity of the two-dimensional electron system, which would naturally explain the increase of TA barrier with underdoping.
III.3 Improving resolution by differential spectroscopy
As seen from Figs. 4 and 5 b), the sum-gap peak in is rapidly smearing out with approaching . Remaining weak spectroscopic features can be traced in a standard way by studying higher derivatives, e.g. Cascade . However, they are obscured by the parasitic TA-background. In Ref.Doping it was shown that the ITS resolution at can be improved by subtracting the TA curve at . But since TA is strongly dependent, such subtraction does not completely remove the changing TA background.
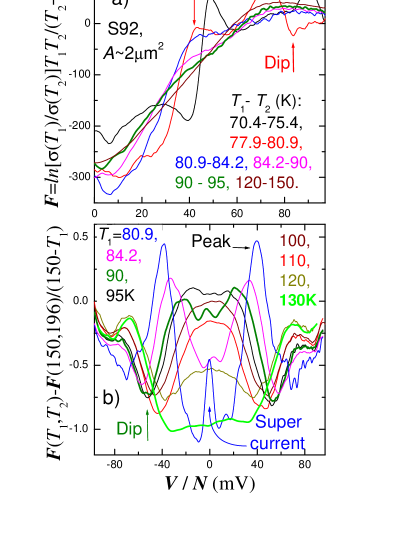
Here I suggest the following optimization for TA background cancelation: First, consider a normalized difference between two characteristics as in Figs. 4,5 b) at nearby temperatures : . According to Eq.(2), for pure TA , i.e., is approximately independent, thus allowing optimal cancelation of the TA background. Another important advantage of this differential scheme is that it emphasizes any dependent spectroscopic feature.
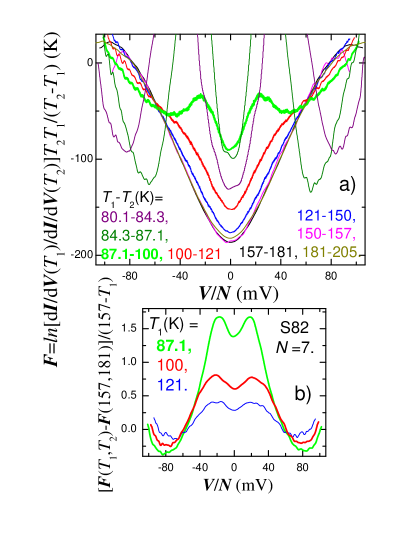
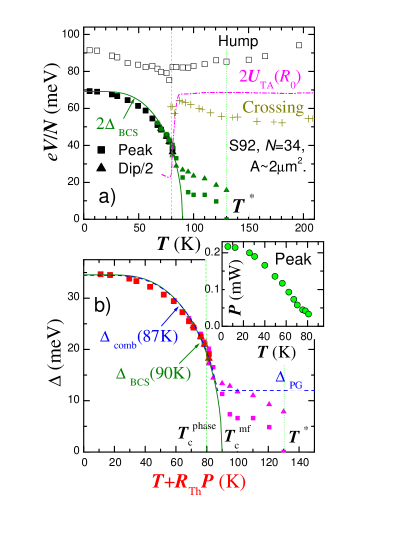
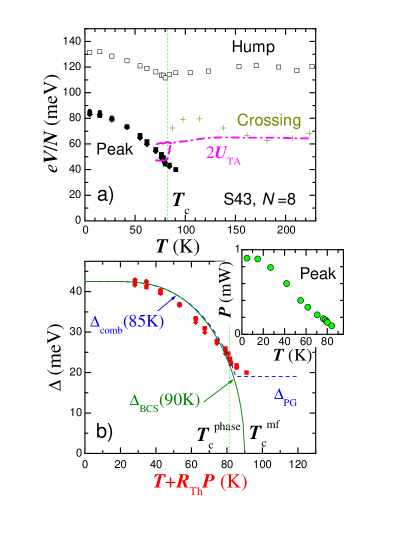
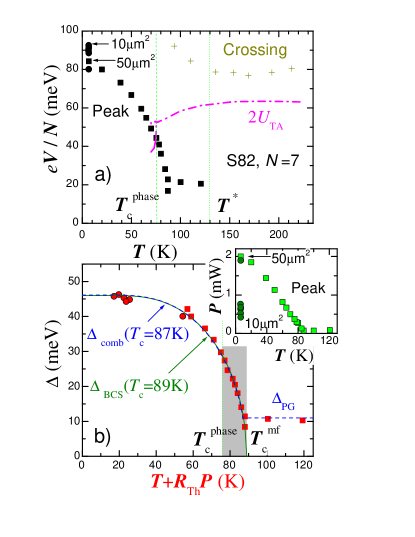
In Figs. 7 a) and 8 a) differential characteristics are shown for moderately underdoped crystals S92 and S82, respectively. It is seen that substantially above the curves collapse into a single universal curve, as expected for pure TA. At lower , the sum-gap peak and the double-gap dip are clearly resolved up to . Interestingly, small deviations from the universal TA curve are seen even above up to . To see them more clearly, in Figs. 7 b) and 8 b) the universal TA curves at high were subtracted from the differential characteristics. In such the plot the TA background is completely removed and we can very clearly see the remaining spectroscopic features close and even above .
IV Temperature dependence of the bulk energy gap
Figs. 9-12 summarize temperature dependencies of ITS features for different samples. Data for the same mesas are represented by symbols of the same type and color.
Dashed-dotted lines represent the TA barrier, obtained from the zero-bias resistance using Eq.(2) . It is seen that is practically constant at . The sudden fall of marks the superconducting transition.
Crosses in Figs. 10-12a) represent crossing points Sven , marked in Figs. 2 and 4b). In agreement with Fig. 6 they occur at .
Open symbols in Figs. 9-11 a) show the hump voltage KrTemp . It also represents the TA barrier and is roughly independent at KrTemp ; Doping . The hump appears at slightly higher voltage than , also in agreement with Fig. 6.
From Figs. 10-12 a) it is seen that in most underdoped crystals a slight deviation of downwards, and the crossing point upwards occur below some temperature . Dashed and dotted vertical lines mark the and , respectively.
Solid symbols in Figs. 9-12 a) represent the main experimental result of this work: dependencies of sum-gap voltages . Data points were obtained from the peak and half the double-gap dip in (larger symbols), or differential characteristics (smaller symbols). The latter allows us to trace the gap up to considerably higher temperatures, than before.
In agreement with previous reports KrTemp ; Doping the bulk gap considerably decreases at for all doping levels. Simultaneously, we observe that the hump also becomes dependent at Doping . However, it moves approximately two times slower than the sum-gap peak and is approximately described by the expression . This indicates that the axis TA barrier remains intact by the superconducting transition KrTemp and continue to hinder the QP transport at .
IV.1 Size dependence
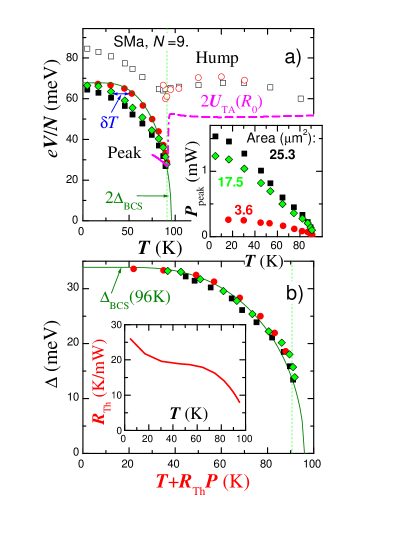
Size-dependence of ITS unambiguously reveals the extent of self-heat distortion Heat . Such data is presented in Figs. 9 and 12. Dissipation powers at the sum-gap peak for all studied mesas are shown in insets of Figs. 9 a) and 10-12 b). scales with the mesa area.
Solid symbols in Fig. 9 a) show measured for three mesas on the SMa crystal. Size dependence of ITS for this crystal was reported in Ref.Heat . It was shown that for mesas with the measured gap becomes size-independent. Therefore, data for the smallest mesa with represents the genuine, undistorted bulk gap , as concluded in sec. III A. The solid line in Fig. 9 a) shows that it is very well described by the conventional mean-field BCS temperature dependence . The same is true for the small mesa on the S92 crystal in Fig. 10a), which was also identified as heating-free in sec. III A.
Let’s now consider the two larger mesas in Fig. 9a). It is seen that measured gaps become progressively smaller with increasing and . The observed deviation from the genuine is perfectly consistent with self-heat distortion, as shown in Fig. 15 d). The temperature rise is equal to the horizontal shift of the measured gap with respect to the undistorted , as indicated in Fig. 9 a).
Now we can directly calculate the effective thermal resistance of the mesas: . The obtained appeared to be approximately the same for both mesas and is shown in the inset of Fig. 9 b). The values of are ranging from at to at , consistent with direct in-situ measurements in Ref. Heat . Note that in Ref.Heat a separate thermometer was employed for measuring the mesa temperature. Therefore, agreement in obtained in both cases indicates that there is no major thermal gradient along the crystal near the mesa. This is consistent with the conclusion of Ref. Heat that heat transport from the mesa is dominated by ballistic flow of non-equilibrium phonons. In this case the actual heating starts only deep inside the crystal, phononic mean-free path below the mesa, making both heating and in-plane thermal gradient in the mesa small.
IV.2 Self-heat compensation
The knowledge of the thermal resistance allow us to recover the genuine temperature dependence of the gap even for moderately large mesas. In Fig. 9 b) gap values for all three mesas from SMa are plotted as a function of the actual mesa temperature , with and from insets in Figs. 9 a) and b), respectively. It is seen that the genuine dependence of the gap is recovered also for larger mesas after such self-heat compensation. The solid line in Fig. 9 b) shows that the genuine is perfectly described by the BCS dependence with , which i approximately equal to the optimal of our Bi(Y)-2212 crystals. It is close to and slightly higher than the phase-coherent for this crystal, as shown in Fig. 13.
We can also check the self-consistency of the conclusion that ITS characteristics of the smallest mesas on SMa and S92 are not distorted by self-heating. As seen from insets in Figs. 9 a) and 10b), the maximum for those mesas is at the lowest . Therefore, at the lowest the maximum self-heating does not exceed few K, which does not affect the measured gap. rapidly decreases with increasing . At , reduces by half to and . Close to , self-heating becomes negligible even for moderately large mesas. For the smallest mesas from Figs. 9 and 10, and is sub-Kelvin. Therefore, the measured gaps for the two smallest mesas are indeed undistorted by self-heating.
Figs. 10-12 b) represent self-heat compensated for moderately underdoped mesas. The same was used for self-heat compensation. In all cases, the recovered can be very well described by the mean-field BCS dependence (solid lines) with that is larger than and close to . Those values are summarized in Table-I.
IV.3 Phase-coherence in axis and plane
In recent years there were many speculations about persistence of phase-incoherent superconductivity up to very high temperatures above in underdoped HTSC. Therefore, it is necessary to clarify the definition of and the difference between axis and plane phase coherence.
The axis phase coherence is caused by weak Josephson coupling between CuO planes: , where is the total Josephson critical current of the junction. The and the Josephson coupling can be easily suppressed by small magnetic fields, which do not affect superconductivity of planes. Moreover, the Josephson coupling can be simply reduced by reducing the junction area. At , thermal fluctuations destroy phase coherence and the junction enter in the phase diffusion state with non-zero resistance at zero current Vion ; PhaseDiff . Suppression of the critical current by thermal fluctuations at was indeed observed in small mesas Fluct ; PhaseDiff . Therefore, the axis phase coherence in small Bi-2212 mesas is not a material property and should not be confused with a much more robust in-plane phase coherence.
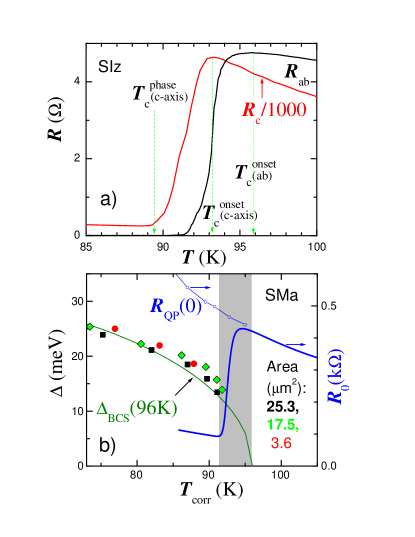
To clarify the difference between in-plane and axis phase coherence, in Fig. 13 a) I show details of in-plane and axis resistive transitions, measured on a slightly underdoped crystal SIz, similar to SMa. It is seen that the axis phase coherence is established at . The onset of axis transition occurs at , which is close to the middle point of the in-plane transition. The onset of plane resistive transition occurs at , which coincides with the mean-field critical temperature , obtained by extrapolation of using BCS temperature dependence, as shown in Fig. 13 b)
IV.4 The pseudogap
The main difference between near optimally doped (Fig. 9) and moderately underdoped (Figs. 10-12) crystals is the persistence of some signature of the residual energy gap (the pseudogap ) at up to (see Figs. 7, 8). In the same range we observe an upturn of the crossing voltage and downturn of obtained from zero bias resistance. Thus the pseudogap is seen at all bias levels.
From Figs. 10-12 b) it is seen that the PG is almost independent near in contrast to the strong dependence on the superconducting side. It is also seen that the PG is merging with the superconducting gap at . The overall dependence of the gap both above and below is well described by the combined gap expression:
| (4) |
with constant . Fits of Eq.(4) to experimental are shown by dashed blue lines in Figs. 10-12 b). Below they are equally good as BCS fits without the PG, but assume lower , indicated in the figures and Table-I.
Can this pseudogap be related to superconductivity? The answer is rather straightforward. The very fact that it forms the combined gap with the superconducting gap clearly indicates that it represents another order parameter, co-existing and competing with superconductivity.
Our present data, together with earlier observation of coexistence of the superconducting gap and the pseudogap at KrTemp , are consistent with recent ARPES experiments Lee2007 , which demonstrated that the superconducting gap along the Fermi arc closes at at all doping levels, while the gap along antinodal directions (the pseudogap) remains relatively independent at .
V Discussion and conclusions
I have shown that technical problems of Intrinsic Tunneling Spectroscopy, such as self-heating (see Appendix-A) and in-plane resistance (see Appendix-B), can be effectively obviated by reducing mesa size. It is instructive to remind that exactly the same technical problems were encountered at the early stage of experimental studies of conventional LTSC tunnel junctions Giaever4p and were also solved by junctions miniaturization, which reduces the area-to-perimeter ratio of the junctions.
I have also shown that self-heating is a trivial phenomenon. It can be easily accounted for and, in case of moderate heating, compensated, so that the genuine can be recovered. A rule of thumb for “moderate” self-heating is that it should not be obvious in the IVCs: the QP branches should reman periodic and there should be no back-bending at . All mesas studied here fall in this category.
The main result of this work is the uncovered genuine temperature dependence of the bulk energy gap in Bi-2212. For all studied doping levels, exhibits a strong dependence, and the superconducting part of it unmistakably tends to vanish in the mean-field BCS manner. For slightly overdoped Bi(Y)-2212 crystals from the same batch this was shown in Ref.Doping . Here I have focused on the underdoped side and have shown that the gap vanishes exactly in the BCS manner also in slightly underdoped (Fig. 9b) and moderately underdoped (Figs. 10-12) mesas.
Those results are strikingly different from the complete independent surface gap, reported in STM experiments Renner . I want to emphasize that this discrepancy can not be attributed to self-heating and must find another explanation. Indeed, numerical simulations in Fig. 15 clearly show that the trivial self-heating simply can not “hide” the qualitative dependence. For example, there is no way in which one can get the vanishing “measured” (self-heating affected) gap if the true gap is independent. Furthermore, self-heating becomes insignificant at elevated because . On the other hand, STM characteristics behave similar to the independent hump feature in ITS, which is the consequence of the axis thermal activation barrier. As discussed in sec. III-B, is most likely the property of the blocking BiO plane, which is probed by STM, rather than superconducting CuO planes. The dramatic difference between STM spectra on BiO and CuO surfaces was indeed reported Misra . This highlights the significance of spectroscopic information from bulk CuO planes, obtained here.
Main conclusions, that can be drawn from ITS data are:
(i) The superconducting transition, even at moderate underdoping, is due to conventional mean-field phase transition rather than destruction of phase coherence without amplitude fluctuations. This confronts speculations about persistence of the “precursor” superconducting state in the extended region above .
(ii) The mean-field superconducting critical temperature decreases with underdoping. Thus, HTSC does not become stronger with approaching the undoped antiferromagnetic state.
(iii) The pseudogap co-exists and competes with superconductivity and disappears at optimal doping.
An important consequence of those conclusions is that high temperature superconductivity is strongest at optimal doping and becoming weaker with underdoping. This is consistent with the decrease of the upper critical field Hc2 with underdoping. Therefore, our observations support the idea that the mechanism of HTSC is intimately connected to a Quantum Critical Point near optimal doping TallonPhC ; QCP , rather than closeness to the antiferromagnetic state AF .
Acknowledgements.
I am grateful to A.Yurgens, for providing Bi(Y)-2212 crystals, to I.Zogaj, M.Sandberg, and A.Yurgens for assistance at early stage of this work. Financial support from the K.&A. Wallenberg foundation and the Swedish Research Council is gratefully acknowledged.Appendix A Analysis of self-heating in ITS
Despite relative simplicity of self-heating phenomenon (it is certainly the most trivial problem in HTSC spectroscopy), discussion of self-heating in ITS has caused a considerable confusion, a large part of which has been caused by a series of publications by V.Zavaritsky Zavar , in which he “explained” the non-linearity of ITS characteristics by assuming that there is no intrinsic Josephson effect. Irrelevance of that model for ITS was discussed in Refs. HeatCom .
A certain confusion might be also caused by a large spread in thermal resistances, , reported by different groups Gough ; AYreply ; Heat ; WangH . For the sake of clarity it should be emphasized that those measurements were made on samples of different geometries. It is clear that depends strongly on the geometry HeatJAP ; Heat , and is much larger in suspended junctions with poor thermal link to the substrate WangH than in the case when both top and bottom surfaces of the junctions are well thermally anchored to the heat bath Lee . For mesa structures similar to those used in this study (a few in-plane size, containing IJJ), there is a consensus that (depending on bias) AYreply ; Heat and Heat . Larger values claimed by some authors Gough are unrealistic for our mesas because they can withstand dissipated powers in excess of without being melted.
Yet, talking about a typical value of is equally senseless as talking about a typical value of a contact (Maxwell) electrical resistance: both depend on the geometry. Therefore, reduction of mesa sizes provides a simple way for reduction of self-heating HeatJAP . Consequently, variation of characteristics with the junction size and geometry provides an unambiguous way of discriminating artifacts of self-heating from the spectroscopic features Heat .
A.1 Peak splitting in non-uniform junctions
As discussed in Ref.HeatCom , atomic separation between IJJs precludes any substantial temperature difference between them. Thus, all junctions in a mesa warm up synchronously and there may be only one collective artefact of heating for all IJJs in the mesa. To the contrary, if the peak is the sum-gap singularity - it is an individual property of each IJJ. If junctions are not perfectly identical, the peak in will split in up to sub-peaks. Indeed, peak splitting is quite often observed in experiment and was already reported in Ref.KrPhysC along with supporting numerical simulations.
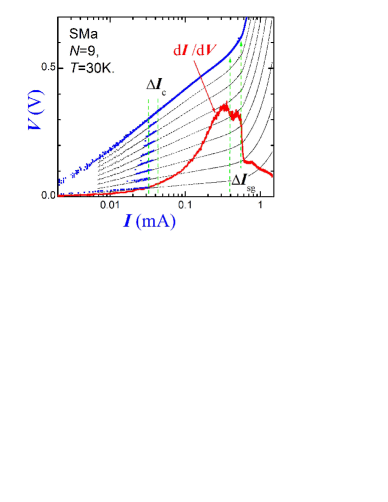
In Fig.14 the IVC at from Fig.2 is re-plotted in a semi-logarithmic scale vs . As discussed in Ref.Sven the IVC becomes nearly linear on such a scale. Thin lines are multiple integers of the last branch divided by . Coincidence of those with quasiparticle branches indicates good periodicity of the latter. However, a minor non-uniformity is observed as a gradual increase of with the brunch number. The total spread of the critical current from the second to the last IJJ is marked in the Figure. The red line shows for the same IVC. A small splitting of the peak is seen. Thus, the peak is not a collective phenomenon of the whole mesa, but is a genuine characteristic of each individual IJJs. From Fig. 14 it is seen that has approximately the same width in the logarithmic scale as . Therefore the splitting is proportional to the difference in critical currents of IJJs in the mesa and is due to the corresponding spread in currents at which individual junctions reach .
Thus, non-uniformity of junctions, although usually unwanted for ITS, helps to understand the origin of the peak in ITS characteristics of small Bi-2212 mesas.
A.2 How self-heating affects characteristics.
How self-heating can distort the IVC’s of Josephson junctions is obvious: since self-heating rises the effective it may affect the IVC only via dependent parameters. There are three such parameters:
i) the quasiparticle resistance,
ii) the superconducting switching current,
iii) the superconducting gap.
They will affect the IVC of mesas, containing several stacked IJJs, in the following manner:
The consecutive increase of upon sequential switching of IJJs from the superconducting to the resistive state will distort the periodicity of quasiparticle branches. Each consecutive QP branch will have a smaller QP resistance (smaller at given ) and smaller switching current. This type of distortion becomes clearly visible (at base ) when HeatJAP ; HeatCom .
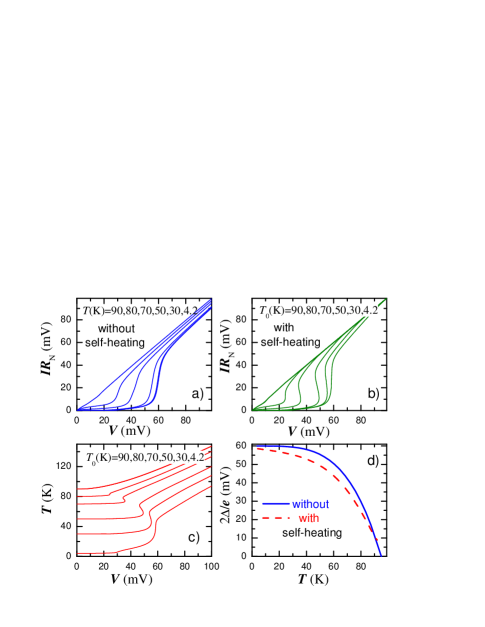
For better understanding of the influence of self-heating on IVCs of Josephson junctions, in Fig. 15 I reproduce the results of numerical simulation of such the distortion, made specifically for the case of Bi-2212 mesa with the corresponding dependent parameters (see Ref.KrPhysC for details). Fig. 15 a) shows a set of undistorted IVC’s at different for coherent, directional, wave tunneling with some trial , shown by the solid line in Fig. 15 d). Panels b) and c) show the distorted IVCs and the actual junction temperature, respectively. It is seen that combination of self-heating and dependence of may lead to appearance of back-bending of the IVC at the sum-gap knee. The dashed line in panel d) represents the “measured” gap obtained from the peak in distorted characteristics. Remarkably, the deviation from the true is marginal, despite large self-heating, at ! Numerical simulations has shown that even self-heating up to at the sum-gap knee does not cause principle changes in the behavior of the “measured” gap. The robustness of the measured gap with respect to self-heating is due to the flat dependence of the superconducting gap at and to simultaneous vanishing of dissipation power at together with at , as shown in insets of Figs. 9-12.
A.3 Heating or non-equilibrium phenomena?
Finally, it is important to emphasize that the concept of heat diffusion is inapplicable for small Bi-2212 mesas containing only few atomic layers. The phonon transport in this case is ballistic Heat ; Uher and the energy flow from the mesa is determined not by collisions between the tunneled non-equilibrium QP with thermal phonons, but by spontaneous emission of a phonon upon relaxation of the non-equilibrium QP Cascade . This process is not hindered at . Therefore, the effective (and self-heating) can be much smaller because it is not limited by poor thermal conductivity at , but is determined by the fast, almost independent, non-equilibrium QP relaxation time. The concept of self-heating becomes adequate only in the bulk of the Bi-2212 crystal, where the dissipation power density and the temperature rise are much smaller due to the much larger area of the crystal. For more details see the discussion in Ref. Heat . The non-equilibrium energy transfer channel is specific for atomic scale intrinsic Josephson junctions made of perfect single crystals. It can explain a remarkably low self-heating at very high bias Cascade .
Appendix B Artifacts of in-plane resistance
In experiments on large mesas Gough or suspended structures WangH no clear Ohmic tunneling resistance could be observed. Instead a negative differential resistance (acute back-bending) progresses at high bias. Similar behavior is also observed on moderately large mesas, when measurements are made in the four-probe configuration YouPRB . This is in stark contrast to three-probe measurements on small mesas, reported here, see Fig. 2 and Refs. KrTemp ; KrMag ; Doping ; Heat .
The continuous negative resistance is not described by self-heating in tunnel junctions because those should always reach the independent positive tunnel resistance at high bias. Thus self-heating is not the primary cause of the acute back-bending. Rather, the negative differential resistance, observed in large structures is caused by the loss of equipotentiality of CuO planes upon which the measurement of IVCs in mesa structures is relying. The latter can be triggered by development of a hot spot HotSpot , but can even occur without self-heating due to in-plane resistive transition of CuO planes when the applied current exceeds the critical current of the CuO plane YouPRB .
B.1 Acute back-bending without heating and the difference between 3-and 4-probe measurements
Here I demonstrate how acute, and not recovering back-bending develops in the IVC of the mesa as a result of the finite in-plane resistance and without any self-heating. I also explain the difference between four-probe measurements, that exhibits acute back-bending YouPRB , and three-probe measurements - that don’t.
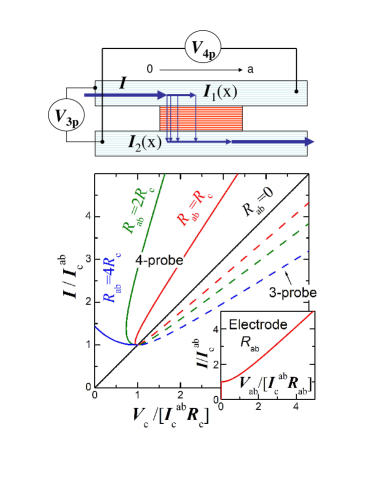
The top panel in Fig.16 show the sketch of the mesa structure. The current is biased through the top electrode and returned through the crystal, which serves as the bottom electrode. The voltage can be measured either in four-probe or thee-probe configuration, as shown in the Figure.
If electrodes (both top and bottom) are resistive, then there is a voltage gradient along the electrodes and the bias current is distributed non-uniformly within the mesa, as shown by thin vertical arrows. Let be the in-plane resistance of top and bottom electrodes within the mesa area , and the axis resistance of the mesa itself. Following Ref.Giaever4p , the current and voltage distribution in this case can be described by the system of equations:
with the boundary conditions: and .
In the four-probe configuration, the measured voltage is , which yields:
| (5) |
where . In case it coincides with the result of Ref.Giaever4p .
In the three-probe configuration the measured voltage is , which yields:
| (6) |
The main panel in Fig. 16 shows calculated four-probe (solid lines) and three-probe (dashed lines) IVCs for the case of identical superconducting electrodes with the in-plane critical current and the IVC as shown in the inset. For the measured IVC coincides with real axis IVC of the mesa. But substantial deviations occur when the bias current exceeds and electrodes become resistive.
B.2 Limitations on the mesa size
I want to emphasize that large mesas are not suitable for ITS even in the absence of self-heating. To probe the gap, one should be able to reach the sum-gap voltage, per IJJ, without loosing the equipotentiality of the bottom CuO plane, which is used as the return current lead and the second voltage electrode.
Let’s estimate the maximum mesa size, suitable for ITS, in the absence of self-heating. Consider a square mesa with the in-plane size . The bias current, required for reaching the sum-gap voltage is , where is the axis tunnel (large bias) resistivity, and is the interlayer spacing. This current is flowing through the perimeter of the last IJJ into the bottom CuO layer and should not exceed the in-plane critical current of that layer. Provided the in-plane critical current density is YouPRB , the in plane critical current of the bottom CuO plane through the perimeter of the mesa is . Therefore, the mesa size should be smaller than . Thus, miniaturization is essential for ITS. Otherwise the return current and voltage contacts are no longer equipotential, leading to the negative measured differential resistance.
To cause a substantial distortion, the total in-plane resistance should be larger than the mesa resistance. Let’s see if this is the case for Bi-2212. The in-plane resistance of the bottom CuO plane in the square is:
.
The axis mesa resistance is .
For a mesa with IJJs, is about four times smaller than . Thus we see that distortion by in-plane resistance can indeed be significant for larger mesas with a small number of junctions.
The proposed model explains why four- and three-probe measurements of Bi-2212 mesas may be very different. From Fig.16 it is seen that four- and three-probe measurements react differently on in-plane resistivity. For the three-probe case, it just leads to appearance of an additional series resistance. But for the four-probe configuration it may lead to development of the acute back-bending, precluding any spectroscopic analysis.
The model can also explain a strange behavior of mesas with very small amount of junctions YouAPL . From the estimations above it follows that for a mesa with only one IJJ the in-plane resistance is about 40 times larger than the mesa resistance, which make such mesas extremely prone to distortion by in-plane resistance and, probably, not suitable for ITS.
References
- (1) H. Ding, J.R. Engelbrecht, Z. Wang, J.C. Campuzano, S.C. Wang, H.B. Yang, R. Rogan, T. Takahashi, K. Kadowaki, and D.G. Hinks, Phys. Rev. Lett. 87, 227001 (2001).
- (2) W.S. Lee, I.M. Vishik, K. Tanaka, D.H. Lu, T. Sasagawa, N. Nagaosa, T.P. Devereaux, Z. Hussain, Z.X. Shen, Nature 450, 81 (2007); T.Kondo, T.Takeuchi, A.Kaminski, S.Tsuda, and S.Shin, Phys. Rev. Lett. 98, 267004 (2007).
- (3) K. Tanaka, W.S. Lee, D.H. Lu, A. Fujimori, T. Fujii, Risdiana, I. Terasaki, D.J. Scalapino, T.P. Devereaux, Z. Hussain, and Z.X. Shen, Science 314, 1910 (2006).
- (4) A. Damascelli, Z.Hussain, and Z.X.Shen, Rev. Mod. Phys 75, 473 (2003).
- (5) Ch. Renner, B. Revaz, J.Y. Genoud, K. Kadowaki, and O. Fischer, Phys.Rev.Lett. 80, 149 (1998).
- (6) A.N. Pasupathy, A. Pushp, K.K. Gomes, C.V. Parker, J.S. Wen, Z.J. Xu, G.D. Gu, S. Ono, Y. Ando, A. Yazdani, Science 320, 196 (2008).
- (7) S.Misra, S.Oh, D.J. Hornbaker, T.DiLuccio, J.N. Eckstein, and A. Yazdani, Phys.Rev.Lett. 89, 087002 (2002).
- (8) R.Kleiner and P.Müller, Phys.Rev.B 49, 1327 (1994)
- (9) V.M.Krasnov, N.Mros, A.Yurgens, and D.Winkler, Phys. Rev. B 59, 8463 (1999)
- (10) Yu.I.Latyshev, A.E.Koshelev, V.N.Pavlenko, M.B.Gaifulin, T.Yamashita and Y.Matsuda, Physica C 367 (2002) 365
- (11) S.M.Kim, H.B.Wang, T.Hatano, S.Urayama, S.Kawakami, M.Nagao, Y.Takano, T.Yamashita, and K.Lee, Phys. Rev. B 72 (2005) 140504(R)
- (12) H.B. Wang, P.H.Wu, and T.Yamashita, Phys. Rev. Lett. 87, 107002 (2001)
- (13) V.M.Krasnov, T.Bauch and P.Delsing, Phys. Rev. B 72 (2005) 012512
- (14) K.Inomata, S.Sato, K.Nakajima, A.Tanaka, Y.Takano, H.B.Wang, M.Nagao, H.Hatano, and S.Kawabata, Phys. Rev. Lett. 95 (2005) 107005
- (15) Yu.I.Latyshev, S.J.Kim, V.N.Pavlenko, T.Yamashita, and L.N.Bulaevskii, Physica C 362 (2001) 156
- (16) S.Ooi, T.Mochiku, and K.Hirata, Phys. Rev. Lett. 89 (2002) 247002
- (17) for review see e.g., J.P.Carbotte, Rev. Mod. Phys. 62, 1027 (1990)
- (18) J.L. Tallon and J.W. Loram, Physica C 349, 53 (2001)
- (19) R. Huebener, Superond.Sc.Technol 8, 189 (1995)
- (20) I.L. Landau and H.R. Ott, J. Low Temp. Phys. 139, 175 (2005); Phys. Rev. B 66, 144506 (2002).
- (21) M.J. Naughton, Phys. Rev. B 61, 1605 (2000)
- (22) B. Rosenstein, B.Y. Shapiro, R. Prozorov, A. Shaulov and Y. Yeshurun, Phys. Rev. B 63, 134501 (2001); F.P.J. Lin and B. Rosenstein, Phys. Rev. B 71, 172504 (2005)
- (23) F. Bouquet, L. Fruchter, I. Sfar, Z.Z. Li, and H. Raffy, Phys. Rev. B 74, 064513 (2006); Y. Ando, G.S. Boebinger, A. Passner, L.F. Schneemeyer, T. Kimura, M. Okuya, S. Watauchi, J. Shimoyama, K. Kishio, K. Tamasaku, N. Ichikawa, and S. Uchida, Phys. Rev. B 60, 12475 (1999)
- (24) Y. Wang, L. Li, M.J. Naughton, G.D. Gu, S. Uchida, and N.P. Ong, Phys. Rev. Lett. 95, 247002 (2005); Y. Wang, L. Li, and N.P. Ong, Phys. Rev. B. 73, 024510 (2006)
- (25) G. Deutscher, Nature 397, 410 (1999).
- (26) V.M. Krasnov, A. Yurgens, D. Winkler, P. Delsing and T. Claeson, Phys. Rev. Lett. 84, 5860 (2000).
- (27) V.M. Krasnov, Phys. Rev. B 65, 140504(R) (2002).
- (28) M. LeTacon, A. Sacuto, A. Georges, G. Kotliar, Y. Gallais, D. Colson, A. Forget, Nature Phys. 2, 537 (2006)
- (29) Y.Wang and H.H.Wen, Euro Phys. Lett. 81, 57007 (2008); H. Gao, C. Ren, L. Shan, Y. Wang, Y.Z. Zhang, S.P. Zhao, X. Yao, and H.H. Wen, Phys. Rev. B 74, 020505(R) (2006)
- (30) V.J. Emery, S.A. Kivelson and O. Zachar, Phys. Rev.B 56, 6120 (1997).
- (31) Z. Tesanovic, Nature Phys. 4, 408 (2008)
- (32) V.J. Emery and S.A. Kivelson, Nature 374, 434 (1995); A.K. Nguyen and A. Sudbo, Phys. Rev. B 60, 15307 (1999)
- (33) for review see e.g., A.I.Larkin and A.A.Varlamov, Fluctuation Phenomena in Superconductors, arXiv:cond-mat/0109177
- (34) D.B.Haviland, Y.Liu, and A.M.Goldman, Phys. Rev. Lett. 62, 2180 (1989); Y.M. Strelniker, A.Frydman, and S.Havlin Phys.Rev.B. 76, 224528 (2007), for review see e.g., I.S. Beloborodov, A.V. Lopatin, V.M.Vinokur, K.B.Efetov, Rev.Mod.Phys. 79, 469 (2007).
- (35) N.Doiron-Leyraud, C. Proust, D. LeBoeuf, J. Levallois, J.B. Bonnemaison, R.X. Liang, D.A. Bonn, W.N. Hardy, and L. Taillefer, Nature 447, 565 (2007); E.A. Yelland, J. Singleton, C.H. Mielke, N. Harrison, F.F. Balakirev, B. Dabrowski, and J.R. Cooper, Phys. Rev. Lett. 100, 047003 (2008).
- (36) M. Suzuki, S. Karimoto, and K. Namekawa, J.Phys.Soc.Jap. 67, 732 (1998); Y.Yamada, K. Anagawa, T. Shibauchi, T. Fujii, T. Watanabe, A. Matsuda, and M. Suzuki, Phys.Rev.B 68, 054533 (2003)
- (37) M.H. Bae, J.H. Park, J.H. Choi, H.J. Lee, and K.S. Park, Phys. Rev. B 77, 094519 (2008).
- (38) V.M. Krasnov, Phys.Rev.Lett. 97, 257003 (2006)
- (39) A. Yurgens, D. Winkler, T. Claeson, S. Ono, and Y. Ando, Phys.Rev.Lett. 90 (2003) 147005.
- (40) K.Schlenga, R.Kleiner, G.Hechtfischer, M.Mößle, S.Schmitt, P.Müller, Ch.Helm, Ch.Preis, F.Forsthofer, J.Keller, H.L.Johnson, M.Veith, and E.Steinbeiß, Phys. Rev. B 57 (1998) 14518
- (41) O.S. Chana, A.R. Kuzhakhmetov, P.A. Warburton, D.M.C. Hyland, D. Dew-Hughes, C.R.M. Grovenor, R.J. Kinsey, G. Burnell, W.E. Booij, M.G. Blamire, R. Kleiner, and P. Muller Appl. Phys. Lett. 76 (2000) 3603
- (42) M. Nagao, S. Urayama, S.M. Kim, H.B. Wang, K.S. Yun, Y. Takano, T. Hatano, I. Iguchi, T. Yamashita, M. Tachiki, H. Maeda, and M. Sato, Phys. Rev. B 74 (2006) 054502.
- (43) T. Nachtrab, D. Koelle, R. Kleiner, C. Bernhard, and C.T. Lin, Phys. Rev. Lett. 92 (2004) 117001.
- (44) V.M. Krasnov, A.E. Kovalev, A. Yurgens, and D. Winkler, Phys.Rev.Lett. 86, 2657 (2001).
- (45) Yu.I. Latyshev, P. Monceau, S. Brazovskii, A.P. Orlov, T. Fournier, Phys. Rev. Lett. 96, 116402 (2006)
- (46) T. Nachtrab, S. Heim, M. Mossle, R. Kleiner, O. Waldmann, R. Koch, P. Muller, T. Kimura, and Y. Tokura Phys. Rev. B 65, 012410 (2001)
- (47) K.Lee, W.Wang, I.Iguchi, M.Tachiki, K.Hirata, and T.Mochiku, Phys. Rev. B 61 (2000) 3616; M.B.Gaifullin, Y.Matsuda, N.Chikumoto, J.Shimoyama, K.Kishio, and R.Yoshizaki, Physica C 362 (2001) 228.
- (48) A. Yurgens, D. Winkler, N.V. Zavaritsky, and T.Claeson, Phys. Rev. Lett., 79 (1997) 5122.
- (49) S.O. Katterwe, A. Rydh and V.M. Krasnov, Phys. Rev. Lett. 101, 087003 (2008)
- (50) V.M. Krasnov, M. Sandberg, and I. Zogaj, Phys.Rev.Lett. 94, 077003 (2005)
- (51) V.M.Krasnov, Phys.Rev.B 75, 146501 (2007)
- (52) V.M.Krasnov, T.Bauch, S.Intiso, E.Hurfeld, T.Akazaki, H.Takayanagi and P.Delsing, Phys.Rev.Lett. 95 (2005) 157002.
- (53) V.M. Krasnov, T. Golod, T. Bauch and P. Delsing, Phys. Rev. B 76 (2007) 224517.
- (54) N. Morozov, L. Krusin-Elbaum, T. Shibauchi, L.N. Bulaevskii, M.P. Maley, Y.I. Latyshev, and T. Yamashita, Phys.Rev.Lett. 84, 1784 (2000).
- (55) S.P. Zhao, X.B. Zhu, Y.F. Wei, G.H. Chen, Q.S. Yang, and C.T. Lin, Phys.Rev.B 72, 184511 (2005).
- (56) P.J.Thomas, J.C.Fenton, G.Yang, and C.E.Gough, Physica C 341-348, 1547 (2000); J.C.Fenton, P.J. Thomas, G. Yang, and C.E. Gough, Appl.Phys.Lett 80, 2535 (2002)
- (57) H.B.Wang, S.Guenon, J.Yuan, A.Iishi, S.Arisawa, T.Hatano, T.Yamashita, D.Koelle and R.Kleiner, Phys.Rev.Lett. 102, 017006 (2009).
- (58) I. Giaever, in Tunneling Phenomena in Solids, p. 19 (Eds. E.Bursein and S.Lundquist, Plenum Press 1969)
- (59) V.M.Krasnov, A.Yurgens, D.Winkler and P.Delsing, J. Appl. Phys. 89, 5578 (2001)
- (60) D. Vion, M. Gotz, P. Joyez, D. Esteve, and M.H. Devoret, Phys.Rev.Lett. 77 3435 (1996).
- (61) A. Franz, Y. Koval, D. Vasyukov, P. Muller, H. Schneidewind, D.A. Ryndyk, J. Keller, and C. Helm, Phys.Rev.B 69, 014506 (2004); P.A. Warburton, A.R. Kuzhakhmetov AR, O.S. Chana, G. Burnell, M.G. Blamire, H. Schneidewind, Y. Koval, A. Franz, P. Muller, D.M.C. Hyland, D. Dew-Hughes, H. Wu, and C.R.M. Grovenor, J.Appl.Phys. 95, 4941 (2004)
- (62) J. Zaanen and B. Hosseinkhani, Phys.Rev. B 70, 060509(R) (2004); C.M. Varma, Phys.Rev.B 73, 155113 (2006); S. Sachdev, Nature Physics 4 173 (2008).
- (63) V.N. Zavaritsky, Phys.Rev.Lett. 92, 259701 (2004); Physica C 404, 440 (2004); Phys. Rev. B 72, 094503 (2005).
- (64) A.Yurgens, D.Winkler, T.Claeson, S.Ono and Y.Ando, Phys.Rev.Lett. 92, 259702 (2004); cond-mat/0309131
- (65) H.B.Wang, T.Hatano, T.Yamashita, P.H.Wu, and P.Müllet, Appl.Phys.Lett. 86, 023504 (2005).
- (66) V.M. Krasnov, Physica C 372-376, 103 (2002).
- (67) M.F. Crommie and A. Zettl, Phys.Rev.B 43 (1991) 408.
- (68) L.X. You, A. Yurgens and D. Winkler, Phys.Rev.B 71, 224501 (2005)
- (69) L.X. You, M. Torstensson, A. Yurgens, D. Winkler, C.T. Lin, and B. Liang, Appl.Phys.Lett. 88 (2006) 222501