11email: kasparov@asu.cas.cz
Kappa distribution and hard X-ray emission of solar flares
Abstract
Aims. We investigate whether the so-called kappa distribution, often used to fit electron distributions detected in-situ in the solar wind, can describe electrons producing the hard X-ray emission in solar flares.
Methods. Using Ramaty High Energy Solar Spectroscopic imager (RHESSI) flare data we fit spatially- and feature-integrated spectra, assuming a kappa distribution for the mean electron flux spectrum.
Results. We show that a single kappa distribution generally cannot describe spatially integrated X-ray emission composed of both footpoint and coronal sources. In contrast, the kappa distribution is consistent with mean electron spectra producing hard X-ray emission in some coronal sources.
Key Words.:
Sun:flares - Sun: X-rays, gamma rays - Methods: data analysis1 Introduction
In solar flares, electrons are very efficiently accelerated, as shown by non-thermal X-ray and radio emission (Tandberg-Hanssen & Emslie 1988; Benz 1993; Karlický 1997; Klein & MacKinnon 2007). A widely used method to determine the electron distribution functions in solar flares is the forward-fitting of X-ray spectra in which the low-energy part usually is described by isothermal bremsstrahlung while for higher energies, electron power-law distributions with a low-energy cutoff are assumed (e.g. Holman et al. 2003). On the other hand, energetic electrons observed in-situ in space have a distribution with an enhanced number of particles in the high-energy tail. These electrons are commonly modelled by kappa distributions (Vandas 1989; Mace & Hellberg 1995; Maksimovic et al. 1997). This leads us to the idea that the kappa distribution is a natural consequence of underlying physical processes. In a series of papers by Yoon et al. (2006); Rhee et al. (2006); Ryu et al. (2007) it was shown analytically and numerically that the kappa distribution is the byproduct of beam-plasma interaction which first leads to the excitation of Langmuir waves followed by turbulent mode-coupling processes. Among the various wave-particle and wave-wave interaction processes, it was proposed that the “collisionality”, defined via the number of particles per Debye sphere, plays a crucial role. Meanwhile, it appeared that the problem of the kappa distribution has an even deeper physical meaning. Tsallis (1988); Leubner (2002) have found that the kappa distribution is the thermodynamic equilibrium solution within so-called nonextensive thermodynamics with a generalised entropy definition.
Although in the interpretation of the flare X-ray spectra the kappa distribution has not been considered up to now, it is evident that it has some attractive properties: a smooth transition between thermal and high-energy parts of the X-ray emission producing electrons and no need for any low-energy cutoff. Indeed, the recent statistical study by Kontar et al. (2008) using a regularised inversion indicates that if low-energy cutoffs exist in mean electron spectra, their energies are likely rather low (below keV). Furthermore, taking into account velocity diffusion and the slowing-down rate of electrons, Galloway et al. (2005) applied a steady-state solution of the Fokker-Planck equation to RHESSI spectra, thus consistently treating thermal and fast electrons. Finally, we note that the kappa distribution is also considered to be connected to the enhanced EUV line emission observed during solar flares (Dzifčáková et al. 2005).
RHESSI (Lin et al. 2002) not only provides high resolution spatially integrated spectra but it is possible to obtain feature integrated spectra, i.e. spectra from individual sources, using imaging spectroscopy techniques (Battaglia & Benz 2006).
The aim of this paper is to examine whether flare X-ray spatially integrated spectra or spectra of some particular type of source are consistent with a kappa distribution of the electrons producing the emission. We use the forward-fit approach and fit the spectra assuming a kappa distribution of electrons in the thin-target model.
Properties of the kappa distribution and expressions for the corresponding bremsstrahlung thin-target emission are presented in Section 2. The data analysis is described in Section 3. In Section 4 we show which types of flare spectra and of which sources are consistent with the kappa distribution of electrons. Our results are summarised in Section 5.
2 Kappa distribution
The kappa distribution represents a generalisation of a Maxwellian distribution with an enhanced high-energy tail (Summers & Thorne 1991). It can be written as
| (1) |
where so that , is “temperature”, is the Boltzmann constant, and denotes electron kinetic energy. At large and for low , the distribution is a power-law; in the limit it approaches a Maxwellian distribution.
2.1 Thin-target X-ray emission
Assuming that superthermal electrons are described by the distribution (1) and the mean electron density in optically thin plasma volume , the thin-target bremsstrahlung photon spectrum per unit has the form (Brown et al. 2003)
| (2) |
where is the bremsstrahlung cross-section differential in photon energy , denotes velocity, and is the distance to the emission source, e.g. 1 AU. Note that contrary to the widely used power-law forms for electron distributions producing solar flare bremsstrahlung emission, there is no need to introduce any (often arbitrary) low-energy cutoff. Furthermore, the kappa distribution also describes the low-energy part of the X-ray emission that is usually fitted by a thermal component.
3 Data analysis
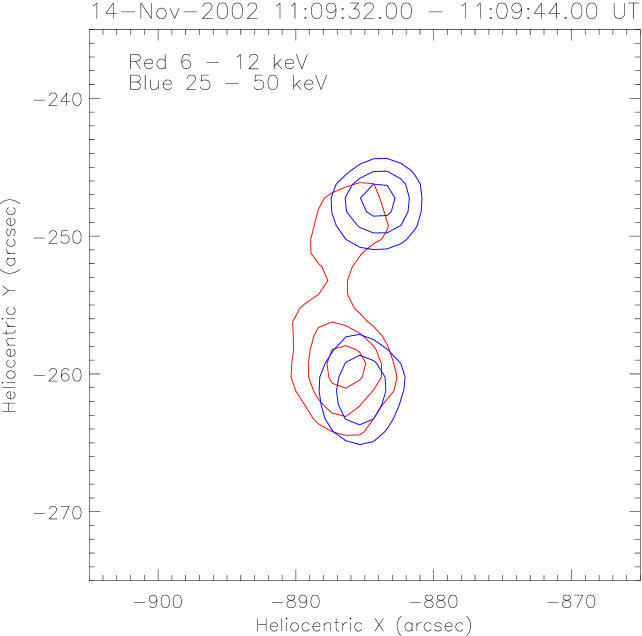
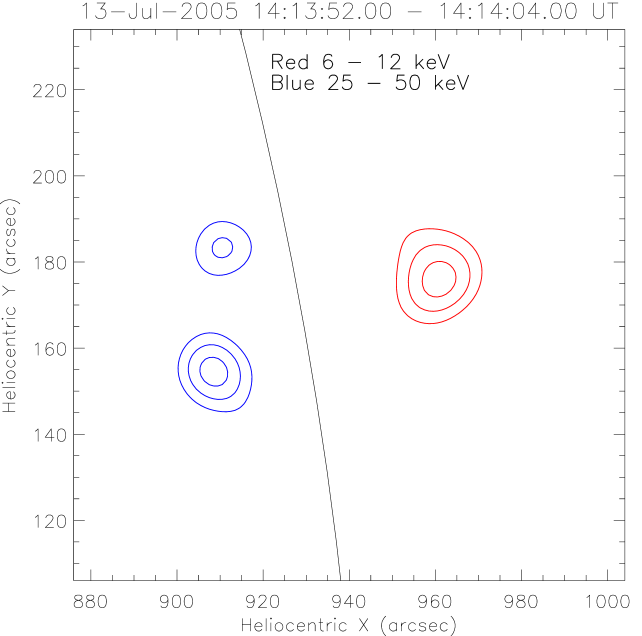
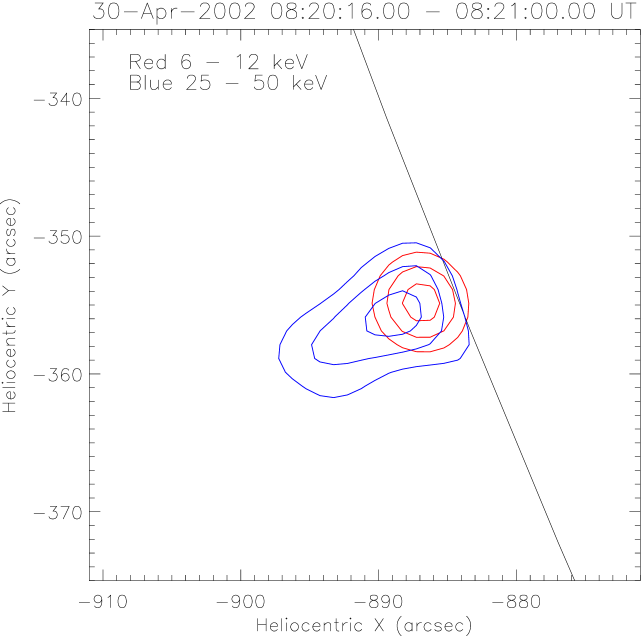
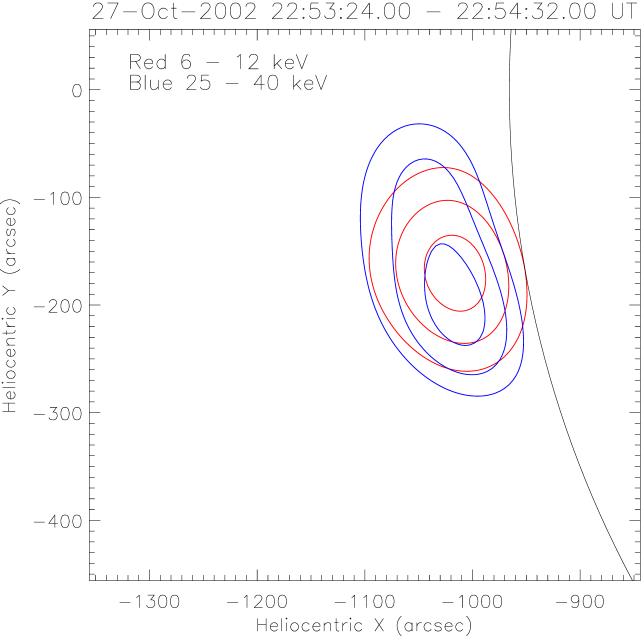
In order to explore a range of source types, we considered flares of a significant thermal component as well as flares with reported non-thermal behaviour at low energies ( keV) – the so-called early impulsive flares studied by Sui et al. (2007). Further, events were required to have well separated sources to obtain spectra of individual sources using imaging spectroscopy without contamination by other sources. We also analysed partially occulted flares since their observation could provide us with high-energy resolution spectra of a single source. To achieve that we selected partially occulted events with only one source which was nearly cospatial at thermal (6 - 12 keV) and higher (typically above 25 keV) energies. Finally, events with a corrected livetime below 90% were discarded to avoid pile-up issues. Figure 1 shows examples of analysed disc events with several separated sources (top) and partially occulted events (bottom).
Spatially integrated spectra were accumulated during the event peak (typically tens of seconds) at energies above 25 keV.
Spectra of individual sources were obtained following the imaging spectroscopy approach of Battaglia & Benz (2006).
We used the CLEAN algorithm (Hurford et al. 2002) to reconstruct images in an interval of several RHESSI spin periods
covering the time interval for the spatially integrated spectra. Using
OSPEX111http://hesperia.gsfc.nasa.gov/ssw/packages/spex/doc/
ospex_explanation.htm, appropriate
regions of interest were chosen and feature-integrated spectra, i.e. from a footpoint or a coronal source, were obtained.
3.1 Spectral fitting
Spatially and feature-integrated spectra were forward-fitted within OSPEX assuming the following two distinct fitting models:
-
1.
Isothermal component + thin-target component of an electron power-law distribution, i.e. the standard approach. The fitted parameters are temperature and emission measure of the thermal plasma and parameters of the power-law, non-thermal, component, i.e. low-energy cutoff , spectral index , normalisation factor , and optionally break energy and spectral index above the break energy in the case of a double power-law.
-
2.
Thin-target emission of an electron kappa distribution (Eq. (2)) + two Gaussians to account for iron-line complexes at 6.7 and 8 keV. (Note that the contributions of the iron-line complexes are included in the isothermal component in the standard fitting approach.) The fitted parameters are , index , normalisation , integrated intensities of two Gaussian lines and optionally their centroids , .
A fit was considered acceptable if the value of reduced , , was close to 1 and normalised residuals did not show significant clustering at a particular energy.
The thin-target formula for an electron kappa distribution, Eq. (2), has been incorporated into the SSW tree and can
be accessed as OSPEX fitting function thin_kappa.pro .
4 Consistency of the kappa distribution with flare X-ray spectra
Applying two fitting models described in Section 3.1 to spectra of several flares, we have found that the spatially integrated spectra of disc events cannot be fitted with the electron kappa distribution. The best fits using the kappa distribution have large value of and large residuals, generally around 10 keV. On the contrary, those spectra are easily fitted by the standard approach, i.e. an isothermal component plus an electron power-law spectrum. Such spectra are mostly a combination of emission coming from several sources (foopoints, coronal or loop source – see Fig. 1, top row) of distinct plasma properties, therefore it is difficult to describe the whole spectrum by just one distribution. On the other hand, using the combination of an isothermal and a power-law component allows us to adjust parameters of these functions in such a way that a satisfactory fit usually can be obtained. The low-energy cutoff helps describe the smooth transition between the thermal and non-thermal components independently of other fit parameters. Conversely, the shape of the kappa function is given only by two parameters: and .
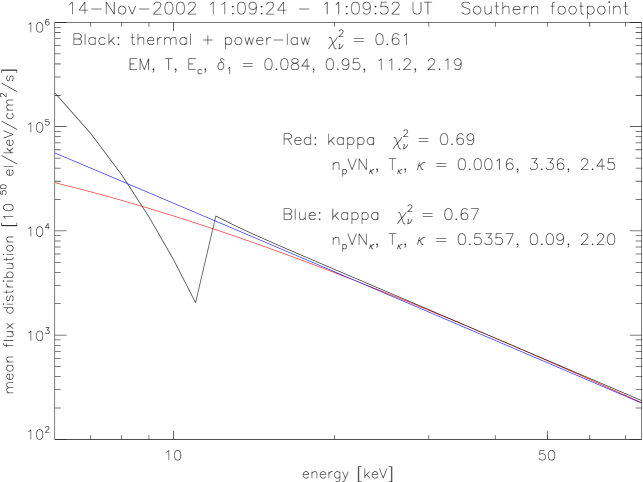
Next, we examined the feature integrated spectra obtained by the imaging spectroscopy approach. Spectra related to footpoints can be fitted by both models; the best fits are similar in terms of and residuals. The footpoint emission at energies above 10 keV is approximated well by the kappa distribution; is generally below 4, therefore the resulting distribution resembles the power-law used in the standard approach. However, parameters and are not constrained in the model with the kappa distribution. Equally good fits can be obtained with values of and differing by an order of magnitude – compare the resulting electron distributions and values of fitted parameters in Fig. 2. This is probably related to the fact that footpoint emission at low energies is reconstructed with high uncertainties. Therefore, we conclude that there is no advantage in using a kappa distribution for the footpoint spectra.
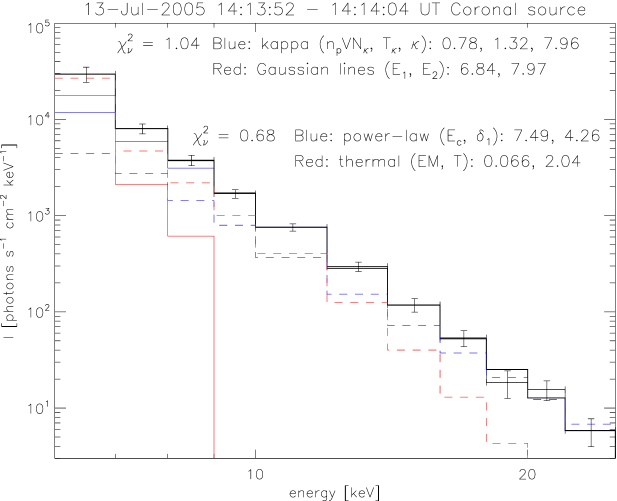
As concerns coronal sources of disc events, the 13-Jul-2005 flare (see Fig. 1, top right) coronal emission can be well fitted by both spectral models. Both models provide best fits with similar residuals and close to 1 (see Fig. 3). Moreover, all kappa parameters are well constrained.
Having obtained a reliable fit using the kappa function to a coronal source spectrum of a disc event reconstructed from CLEAN images, we examined high-energy resolution spatially integrated spectra of partially occulted flares. Such spectra are generally obtained with much finer energy resolution and better signal-to-noise ratio than the data from imaging spectroscopy (compare uncertainties on the data points in Figs. 3 and 4). Partially occulted events were recently studied by Krucker & Lin (2008) and we analysed several events listed in that paper. A representative example is the 30-Apr-2002 event. Its spectrum cannot be described well by the model using a kappa function (the best fit shows large residuals at energies around 10 keV), whereas the standard model matches the spectrum reasonably well. This event shows nearly cospatial sources at 6 - 12 and 12 - 25 keV ranges, yet their shapes suggest different structures depending on energy – see Fig. 1, bottom left.
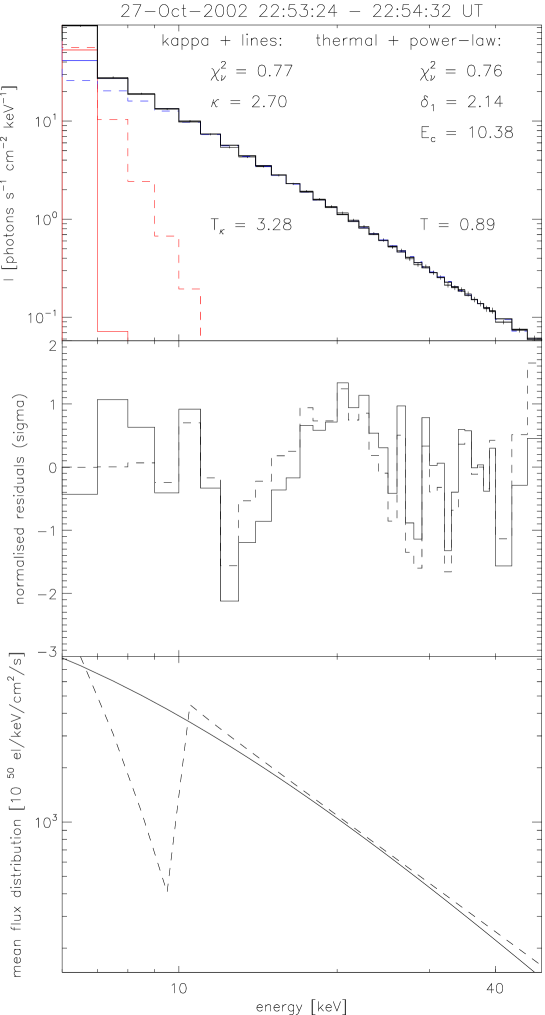
On the other hand, the spatially integrated spectrum of the extended coronal source of 27-Oct-2002 flare seen by RHESSI above the limb (see Fig. 1, bottom right) can be fitted well by the kappa function up to 50 keV. Again, the standard model provides a similarly good fit both in terms of residuals and , but contrary to the kappa function model a low-energy cutoff must be introduced. The best fit using the kappa function is shown in Fig. 4.
Now the question arises of why the kappa distribution fits the spectrum of the October 27, 2002 coronal source much more closely than that of April 30, 2002. Krucker et al. (2007) show that the October 27, 2002 source was observed at much higher altitudes (0.3 ) than the April 30, 2002 event. We think that at lower altitudes the X-ray source structure can be more complex (e.g. several different X-ray sources along the line of sight) than for sources at higher heights and thus the fit of the kappa distribution is not successful due to the limited number of free parameters.
5 Conclusions
We have applied a kappa distribution of electrons to RHESSI hard X-ray flare spectra. We have shown that spatially integrated spectra of disc events, generally composed of contributions from coronal and footpoint emissions, cannot be well described as the thin-target emission of an electron kappa distribution. On the contrary, the standard approach assuming an isothermal and a power-law component results in a better fit in terms of residuals and reduced . This could be due to the fact that those different spectral components come from regions of distinct plasma properties and therefore it is difficult to describe the spectral shape by two parameters, and only.
Further, from the spectra of individual sources obtained by means of imaging spectroscopy, we have found that both footpoint and coronal emissions could be fitted using the electron kappa function. However, in the case of the footpoints, the fit is ambiguous at low energies owing to high uncertainties of data in this energy range. Therefore, we cannot conclude whether the kappa distribution is appropriate for the footpoint emission.
In constrast, the results both from imaging spectroscopy and high-energy resolution spectra of partially occulted flares suggest that some coronal sources are consistent with the thin-target emission of the electron kappa distribution.
Summarising the results of all analysed flares, it looks as if the decrease of X-ray source complexity increases the relevance of spectral fitting by the kappa distribution, especially for coronal X-ray sources. This is in agreement with the numerical models of Yoon et al. (2006) and Rhee et al. (2006) who consider particle-wave interactions in plasma and thus describe processes appropriate for coronal conditions where Coulomb collisions do not dominate.
Our results do not rule out the widely used interpretation of hard X-ray spectra being produced by thermal and power-law components, yet they show that other distributions, such as the kappa distribution, are consistent with the RHESSI data as well. In our view, the advantage of using the kappa distribution lies mainly in the facts that the kappa distribution is a natural consequence of physical processes in space plasma, that such a distribution is applicable to in-situ detected electrons, and no low-energy cutoff in the mean electron spectrum has to be considered.
We note that the low-energy part of hard X-ray spectra is important to constrain the best fit. For future studies we propose to combine hard X-ray data with a detailed analysis of soft X-ray continuum and lines from other instruments such as RESIK (Sylwester et al. 2005) or the recently launched SphinX on board Coronas-Photon (Sylwester et al. 2008). Finally, on the basis of nonextensive thermostatistics, Leubner (2004) proposed a so-called double-kappa distribution and applied it to observed interplanetary electron distributions. Future RHESSI data analyses may use this idea as an alternative approach to the single kappa distribution used here.
Acknowledgements.
We are grateful to E. Dzifčáková for her valuable remarks concerning the kappa distribution. This work was supported by grants 205/06/P135, 205/09/1705 (GA ČR), IAA300030701 (GA AS ČR), and the research project AV0Z10030501 (Astronomický ústav).References
- Battaglia & Benz (2006) Battaglia, M. & Benz, A. O. 2006, A&A, 456, 751
- Benz (1993) Benz, A. O., ed. 1993, Astrophysics and Space Science Library, Vol. 184, Plasma Astrophysics: Kinetic processes in solar and stellar coronae
- Brown et al. (2003) Brown, J. C., Emslie, A. G., & Kontar, E. P. 2003, ApJL, 595, L115
- Dzifčáková et al. (2005) Dzifčáková, E., Kulinová, A., Tóthová, D., & Dudík, J. 2005, in ESA Special Publication, Vol. 600, The Dynamic Sun: Challenges for Theory and Observations
- Galloway et al. (2005) Galloway, R. K., MacKinnon, A. L., Kontar, E. P., & Helander, P. 2005, A&A, 438, 1107
- Holman et al. (2003) Holman, G. D., Sui, L., Schwartz, R. A., & Emslie, A. G. 2003, ApJ, 595, L97
- Hurford et al. (2002) Hurford, G. J., Schmahl, E. J., Schwartz, R. A., et al. 2002, Sol. Phys., 210, 61
- Karlický (1997) Karlický, M. 1997, Space Science Reviews, 81, 143
- Klein & MacKinnon (2007) Klein, K.-L. & MacKinnon, A. L., eds. 2007, Lecture Notes in Physics, Berlin Springer Verlag, Vol. 725, The High Energy Solar Corona: Waves, Eruptions, Particles
- Kontar et al. (2008) Kontar, E. P., Dickson, E., & Kašparová, J. 2008, Sol. Phys., 252, 139
- Krucker & Lin (2008) Krucker, S. & Lin, R. P. 2008, ApJ, 673, 1181
- Krucker et al. (2007) Krucker, S., White, S. M., & Lin, R. P. 2007, ApJ, 669, L49
- Leubner (2002) Leubner, M. P. 2002, Ap&SS, 282, 573
- Leubner (2004) Leubner, M. P. 2004, ApJ, 604, 469
- Lin et al. (2002) Lin, R. P., Dennis, B. R., Hurford, G. J., et al. 2002, Sol. Phys., 210, 3
- Mace & Hellberg (1995) Mace, R. L. & Hellberg, M. A. 1995, Physics of Plasmas, 2, 2098
- Maksimovic et al. (1997) Maksimovic, M., Pierrard, V., & Lemaire, J. F. 1997, A&A, 324, 725
- Rhee et al. (2006) Rhee, T., Ryu, C.-M., & Yoon, P. H. 2006, Journal of Geophysical Research (Space Physic), 111, 9107
- Ryu et al. (2007) Ryu, C.-M., Rhee, T., Umeda, T., Yoon, P. H., & Omura, Y. 2007, Physics of Plasmas, 14, 100701
- Sui et al. (2007) Sui, L., Holman, G. D., & Dennis, B. R. 2007, ApJ, 670, 862
- Summers & Thorne (1991) Summers, D. & Thorne, R. M. 1991, Physics of Fluids B, 3, 1835
- Sylwester et al. (2005) Sylwester, J., Gaicki, I., Kordylewski, Z., et al. 2005, Sol. Phys., 226, 45
- Sylwester et al. (2008) Sylwester, J., Kuzin, S., Kotov, Y. D., Farnik, F., & Reale, F. 2008, Journal of Astrophysics and Astronomy, 29, 339
- Tandberg-Hanssen & Emslie (1988) Tandberg-Hanssen, E. & Emslie, G. A. 1988, The physics of solar flares (Cambridge University Press)
- Tsallis (1988) Tsallis, C. 1988, Journal of Statistical Physics, 52, 479
- Vandas (1989) Vandas, M. 1989, Bulletin of the Astronomical Institutes of Czechoslovakia, 40, 175
- Yoon et al. (2006) Yoon, P. H., Rhee, T., & Ryu, C.-M. 2006, Journal of Geophysical Research (Space Physics), 111, 9106