11email: lewen,winnewisser,hspm@ph1.uni-koeln.de 22institutetext: Max-Planck Institut für Radioastronomie, Auf dem Hügel 69, 53121 Bonn, Germany
22email: kmenten@mpifr-bonn.mpg.de 33institutetext: Department of Chemistry, Dalhousie University, Halifax, Nova Scotia, B3H 4J3, Canada 33email: John.Coxon@Dal.Ca
Accurate laboratory rest frequencies of vibrationally excited CO up to and up to 2 THz
Abstract
Aims. Astronomical observations of (sub)millimeter wavelength pure rotational emission lines of the second most abundant molecule in the Universe, CO, hold the promise of probing regions of high temperature and density in the innermost parts of circumstellar envelopes.
Methods. The rotational spectrum of vibrationally excited CO up to has been measured in the laboratory between 220 and 1940 GHz with relative accuracies up to , corresponding to kHz near 1 THz.
Results. The rotational constant and the quartic distortion parameter have been determined with high accuracy and even the sextic distortion term was determined quite well for while reasonable estimates of were obtained for and 3.
Conclusions. The present data set allows for the prediction of accurate rest frequencies of vibrationally excited CO well beyond 2 THz.
Key Words.:
molecular data – methods: laboratory – techniques: spectroscopic – radio lines: ISM – radio lines: stars – ISM: molecules – circumstellar matter1 Introduction
Carbon monoxide, CO, is the second most abundant molecule in the universe next to hydrogen, H2. Observations of CO are commonly employed to obtain information on the H2 abundance since H2 is usually difficult to detect directly because it does not have any permanent or transition dipole moment, and its quadrupole transitions are very weak and high in energies. Usually transitions of the main isotopologue 12C16O (in the following, unlabeled atoms designate 12C or 16O) are recorded for this purpose, but frequently also transitions of 13CO or even C18O are studied because transitions of these isotopic species are less affected by opacity. Even less abundant isotopologues have been detected in space, including recently the least abundant 13C17O (Bensch et al. 2001).
Very accurate ground state rest frequencies have been obtained in the laboratory for CO (Winnewisser et al. 1997) as well as for its isotopologues (Zink et al. 1990; Klapper et al. 2000a, b, 2001, 2003; Cazzoli et al. 2002, 2003, 2004; Puzzarini et al. 2003). The lower- transitions were usually measured in sub-Doppler resolution such that the relative accuracies of the measurements reach .
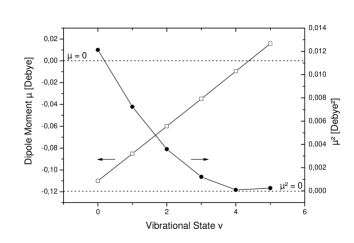
Interestingly, the only experimental article to report measurements of transitions of vibrationally excited CO seems to be a paper by Bogey et al. (1986) on CO transitions for several vibrational states between and . One reason for this lack of measurements is probably the high vibrational energy of 2143 cm-1 or 3086 K for (Coxon & Hajigeorgiou 2004) which makes excited states of CO difficult to populate. Another reason is likely the small dipole moment of 0.10980 (3) D (Muenter 1975) which even decreases for the first few vibrational states by about 0.025 D for each additional vibrational excitation until the dipole moment switches polarity between and 5 (Goorvitch 1994), see also Fig 1. Coxon & Hajigeorgiou (2004) reviewed rather extensively not only rotational data but also a plethora of infrared studies. Their work permits very good predictions of the rotational transition of CO in excited vibrational states.
Apart from molecular clouds, CO is also a premier constituent of the circumstellar envelopes of mass-losing stars on the asymptotic giant branch (AGB) of both carbon-rich ([C/O] abundance ratio ) and oxygen-rich ([C/O] ) objects. Moreover, unlike other species, it does not condense into dust grains and prevails throughout the envelope until it is destroyed by ultraviolet radiation in its tenuous outer portions (see, e.g., Lafont et al. 1982; Cherchneff & Barker 1992). Thus, emission from its strong rotational lines dominate the cooling and, thus, the thermal balance of an envelope (see, e.g. Crosas & Menten 1997).
CO is produced abundantly under the thermodynamical equilibrium conditions in the atmospheres of such AGB stars, even at photospheric temperatures, K, (Tsuji 1964) and is consequently observed easily via its near-infrared vibrational-rotational transitions. Toward the archetypical, high mass-loss C-rich object IRC+10216, Sahai & Wannier (1985) observed vibration-rotational emission and absorption in the m fundamental band, while Keady et al. (1988) additionally observed absorption from the first overtone band at m.
Given the extremely high temperature and density in the region from which the above transitions are arising, one might also expect to find pure rotational emission to be observable from it. However, pure rotational transitions of CO in excited vibrational states had not been reported in the astronomical literature until very recently (Patel et al. (2009a), see also below), while rotational lines of molecules chemically related to CO, although with considerably lower vibrational energies, , have been found toward IRC+10216. These include CS (Turner 1987a) and SiS (Turner 1987b), which have cm-1 (Müller et al. 2005) and 744 cm-1 (Müller et al. 2007), respectively; see also (Patel et al. 2009b). Moreover, vibrationally excited SiO maser emission has been detected from the envelopes of many hundreds of oxygen-rich long period variable stars and red supergiants, and both its and 2 ( and 2447 cm-1, respectively (Sanz et al. 2003)) lines are observed even toward three high-mass protostellar objects embedded in molecular clouds (Zapata et al. 2009).
It is noteworthy that for all three of these molecules transitions of even higher excited vibrational states and rare isotopologues have been observed, namely for SiO (Cernicharo et al. 1993) and SiS (Agúndez et al. 2008; Patel et al. 2009b), and for CS (Agúndez et al. 2007) and 29SiO (Gonzalez-Alfonso et al. 1996).
In the case of CO, (Scoville & Solomon 1978) reported the detection of its , transition toward IRC+10216. However, that “detection” was soon rebutted by Cummins et al. (1980). They identified the observed spectral feature as due to C4H, whose frequency is very close indeed to that of the , CO line. Moreover, C4H exhibits generally strong lines in this source. It took roughly 30 years until a genuine detection of pure rotational CO emission lines (, and ) with the Submillimeter Array was reported (of course in IRC+10216) very recently by Patel et al. (2009a).
We have recorded rotational transitions of vibrationally excited CO belonging to four isotopic species, CO, 13CO, C18O, and 13C18O up to in excitation and up to 2 THz in frequency. In order to facilitate the detection of radio lines of vibrationally excited CO, we present here our results for the main CO isotoplogue. The full account of our work, which involves a combined fit with a variety of rotational and ro-vibrational data, will be presented elsewhere (Gendriesch et al., in preparation).
2 Experimental details
Transitions with frequencies below 1 THz have been recorded with the Cologne Terahertz Spectrometer (CTS) which has been described in detail by Winnewisser et al. (1994). It uses broadband tunable, phase-locked backward-wave oscillators (BWOs) as powerful sources, and a magnetically tuned, liquid helium cooled hot-electron InSb bolometer as detector. The Cologne Sideband Spectrometer for Terahertz Application (COSSTA) was employed for the measurements between 1.75 and 2.0 THz. In this case, the terahertz radiation was generated by mixing of a fixed-frequency far-infrared laser and a BWO as tunable sideband generator. An InSb bolometer was used again as detector. Further details on this spectrometer system are available in Gendriesch et al. (2000).
The pressure of CO in the 3 and 2 m, respectively, long absorption cells was in the Pa range. The measurements were carried out in a static mode or in a slow flow through the cell. One has to keep in mind that in the terahertz region a flow speed of several m/s causes frequency shifts of a few tens of kilohertz.
The smaller dipole moment in compared with the vibrational ground state reduces the intensities by about 40 %; in the intensity is decreased by almost one order of magnitude, see Fig. 1. The high excitation energy reduces the intensities much more, by about 4.5 orders of magnitude for each vibrational quantum at 300 K. For these reasons, vibrationally excited CO could not be observed even under very favorable conditions and with long integration times at room temperature for . A glow discharge effectively increased the vibrational temperature such that lines of vibrationally excited CO could be recorded below 1 THz with the CTS. The available source power at 2 THz is considerably lower with COSSTA. Therefore, a modulation of the discharge (on/off) at Hz was employed in addition to the usual frequency modulation to reduced baseline effects and to improve the spectrometer stability. The measurements were carried out similarly to those on HNC (Thorwirth et al. 2000) and DNC (Brünken et al. 2006) in their ground and excited vibrational states.
A high accuracy of a transition frequency in our measurements depends very much on the flatness of the baseline, the absence of other, interfering lines in the vicinity, and on a large signal-to-noise ratio (S/N). Relative accuracies of about have been reached for strong, isolated lines recorded in Doppler mode up to 1 THz as well as near 2 THz fairly commonly as demonstrated in the investigations of, e.g., H2CO (Brünken et al. 2003) and SO2 in its and 1 vibrational states (Müller & Brünken 2005). Under favorable conditions, better accuracies can be reached even in Doppler-limited measurements, as shown in the studies of HCN, (Thorwirth et al. 2003), and SiS (Müller et al. 2007). The study of rotational transitions of CO by Varberg & Evenson (1992) demonstrates that such high relative accuracies are possible also in other laboratories and at even higher frequencies (beyond 4 THz); see also Winnewisser et al. (1997) for an updated list of these frequencies and uncertainties. It is worthwhile mentioning that in sub-Doppler measurements relative accuracies of better than have been reached e.g. in measurements of CO (Winnewisser et al. 1997) and 13CO (Cazzoli et al. 2004).
3 Analysis and discussion

Predictions of the CO, to 3 rotational spectrum were based initially on infrared measurements as summarized, e.g. in Coxon & Hajigeorgiou (2004). All but the very weak transition were recorded for below 1 THz, fewer transitions were recorded for higher excited states. Two additional transitions could be recorded for each vibrational state with COSSTA near 2 THz. Fig. 2 displays the very good signal-to-noise ratios obtained for the to 3 states. Altogether between 9 and 4 experimental transition frequencies were obtained in the course of the present investigations. They are given in Table 1 together with their uncertainties. Also included are the calculated frequencies up to with uncertainties, the lower state energies, and the line strengths .
The spectroscopic parameters have been determined in a weighted least-squares fit, and are listed in Table 2 together with those of the ground vibrational state from Winnewisser et al. (1997). The parameters and have been determined very well. Even the sextic centrifugal distortion term has a standard deviation that is less than 10 % of its value for , but it is barely determined for and 3. The rotational constant decreases with vibrational excitation, as is generally the case. The change in is very small, but still determined with significance; the latter is not the case for . The rms error of the fits, also known as the weighted standard deviation of the fit, are 0.561 for and 2 suggesting the error estimates of the rest frequencies to be conservative. The rms error of 0.2 for is not meaningful because 3 parameters have been determined from 4 transition frequencies only.
Table 1 provides calculated rest frequencies up to 2.3 THz. The small values of the predicted uncertainties suggest that reliable predictions of the rotational spectrum of CO and probably 2 can be made up to at least 3 THz. Predictions to even higher frequencies will be available in the catalog section of the Cologne Database for Molecular spectroscopy111website: http://www.astro.uni-koeln.de/cdms/ (Müller et al. 2001, 2005).
4 Astronomical outlook
As mentioned above, pure rotational emission from the and lines has very recently been detected towards the hot, innermost circumstellar envelope of the high mass-loss carbon AGB star IRC+10216 (Patel et al. 2009a). Potentially, other vibrationally excited rotational lines from CO are detectable toward this and similar objects as well. The observations just reported, made with the Submillimeter Array, have an angular resolution of a few arc seconds and by no means resolve the emitting region, which is estimated to have more than 10 times smaller dimensions, of AU for a distance of 150 pc (Crosas & Menten 1997). Resolving such small regions is outside the capabilities of existing (sub)millimeter interferometers.
However, the Atacama Large Millimeter Array (ALMA), currently under construction on the meter high Llano de Chajnantor in Chile, with its fifty 12 m diameter antennas will have a much higher angular resolution and a much larger collecting area than all existing instruments. Consequently, ALMA will have a vastly larger brightness temperature sensitivity, . Here is the number of antennas (currently 50 planned and 64 as a goal), the effective area of a single antenna, the observing frequency, the synthesized beam size and the frequency resolution.
Using the online ALMA Sensitivity Calculator Tool222http://www.eso.org/sci/facilities/alma/observing/tools/etc/ on ESO’s ALMA WWW site we employ inputs equivalent to GHz (comparable to the frequencies of vibrationally excited CO line) and MHz (corresponding to 0.88 km s-1 velocity resolution; i.e., appropriate for the km s-1 width of the lines observed toward IRC+10216), we calculate for 1.2 mm precipitable water vapor (mediocre weather conditions for the ALMA site) an rms flux density sensitivity of 3.2 mJy for 1 h of integration time. In an extended configuration, with a maximum baseline length, , of 10 km, a beam of FWHM radians, or 22 milli arcseconds could be synthesized with ALMA (at GHz; is the speed of light). With this and the flux density sensitivity quoted above, we calculate that an rms brightness temperature sensitivity of 70 K could be achieved with ALMA at that resolution, which corresponds to a quarter of the diameter of IRC+10216’s radio photosphere (Menten et al. in prep.).
Given that the brightness temperature of the gas emitting vibrationally excited CO is in high likelihood hotter than 1000 K (Patel et al. 2009a), spatially resolved imaging will allow studies of the distribution and dynamics of the hot material close to the stellar atmosphere of IRC+10216 and similar evolved stars. This will provide important insight into the origins of the mass loss process in such objects. These high resolution observations that will also easily image the radio photospheres of such near-by red giant stars (see, e.g., Reid & Menten 2007) will be eminently feasible since their stellar continuum emission will provide ample flux for self calibration.
Acknowledgements.
This work has been supported by the Deutsche Forschungsgemeinschaft (DFG) via the collaborative research grant SFB 494. H.S.P.M. is grateful for recent support by the Bundesministerium für Bildung und Forschung (BMBF) administered through Deutsches Zentrum für Luft- und Raumfahrt (DLR). His support was aimed in particular at maintaining the CDMS.References
- Agúndez et al. (2007) Agúndez, M., Cernicharo, J., & Guélin, M. 2007, ApJ, 662, L91
- Agúndez et al. (2008) Agúndez, M., Cernicharo, J., Pardo, J. R., Guélin, M., & Phillips, T. G. 2008, A&A, 485, L33
- Bensch et al. (2001) Bensch, F., Pak, I., Wouterloot, J. G. A., Klapper, G., & Winnewisser, G. 2001, ApJ, 562, L185
- Brünken et al. (2003) Brünken, S., Müller, H. S. P., Lewen, F., & Winnewisser, G. 2003, Phys. Chem. Chem. Phys., 5, 1515
- Brünken et al. (2006) Brünken, S., Müller, H. S. P., Thorwirth, S., Lewen, F., & Winnewisser, G. 2006, J. Mol. Struct., 780, 3
- Bogey et al. (1986) Bogey, M., Demuynck, C., Destombes, J. L., & Lapauw, J. M. 1986, J. Phys. E, 19, 520
- Buhl et al. (1974) Buhl, D., Snyder, L. E., Lovas, F. J., & Johnson, D. R. 1974, ApJ, 192, L97
- Cazzoli et al. (2002) Cazzoli, G., Dore, L., Puzzarini, C., & Beninati, S. 2002, Phys. Chem. Chem. Phys., 4, 3575
- Cazzoli et al. (2003) Cazzoli, G., Puzzarini, C., & Lapinov, A. V. 2003, ApJ, 592, L95
- Cazzoli et al. (2004) Cazzoli, G., Puzzarini, C., & Lapinov, A. V. 2004, ApJ, 611, 615
- Cernicharo et al. (1993) Cernicharo, J., Bujarrabal, V., & Santaren, J. L. 1993, ApJ, 407, L33
- Cherchneff & Barker (1992) Cherchneff, I., & Barker, J. R. 1992, ApJ, 394, 703
- Coxon & Hajigeorgiou (2004) Coxon, J. A., & Hajigeorgiou, P. G. 2004, J. Chem. Phys., 121, 2992
- Crosas & Menten (1997) Crosas, M., & Menten, K. M. 1997, ApJ, 483, 913
- Cummins et al. (1980) Cummins, S. E., Morris, M., & Thaddeus, P. 1980, ApJ, 235, 886
- Gendriesch et al. (2000) Gendriesch, R., Lewen, F., Winnewisser, G., & Hahn, J. 2000, J. Mol. Spectrosc., 203, 205
- Gonzalez-Alfonso et al. (1996) Gonzalez-Alfonso, E., Alcolea, J., & Cernicharo, J. 1996, A&A, 313, L13
- Goorvitch (1994) Goorvitch, D. 1994, ApJS, 95, 535
- Keady et al. (1988) Keady, J. J., Hall, D. N. B., & Ridgway, S. T. 1988, ApJ, 326, 832
- Klapper et al. (2000a) Klapper, G., Lewen, F., Gendriesch, R., Belov, S. P., & Winnewisser, G. 2000, J. Mol. Spectrosc., 201, 124
- Klapper et al. (2000b) Klapper, G., Lewen, F., Belov, S. P., & Winnewisser, G. 2000, Z. Naturforsch., 55a, 441
- Klapper et al. (2001) Klapper, G., Lewen, F., Gendriesch, R., Belov, S. P., & Winnewisser, G. 2001, Z. Naturforsch., 56a, 329
- Klapper et al. (2003) Klapper, G., Surin, L., Lewen, F., Müller, H. S. P., Pak, I., & Winnewisser, G. 2003, ApJ, 582, 262
- Lafont et al. (1982) Lafont, S., Lucas, R., & Omont, A. 1982, A&A, 106, 201
- Müller et al. (2001) Müller, H. S. P., Thorwirth, S., Roth, D. A., & Winnewisser, G. 2001, A&A, 370, L49-L52
- Müller et al. (2005) Müller, H. S. P., Schlöder, F., Stutzki, J., & Winnewisser, G. 2005, J. Mol. Struct, 742, 215
- Müller & Brünken (2005) Müller, H. S. P., & Brünken, S. 2005, J. Mol. Spectrosc., 232, 213
- Müller et al. (2007) Müller, H. S. P., et al. 2007, Phys. Chem. Chem. Phys., 9, 1579
- Muenter (1975) Muenter, J. S. 1975, J. Mol. Spectrosc., 55, 490
- Patel et al. (2009a) Patel, N. A., Young, K. H., Brünken, S., Menten, K. M., Thaddeus, P., & Wilson, R. W. 2009, ApJ, 691, L55
- Patel et al. (2009b) Patel, N. A., et al. 2009b, ApJ, accepted, arXiv:0811.2142
- Puzzarini et al. (2003) Puzzarini, C., Dore, L., & Cazzoli, G., 2003, J. Mol. Spectrosc., 217, 19
- Reid & Menten (2007) Reid, M. J., & Menten, K. M. 2007, ApJ, 671, 2068
- Sanz et al. (2003) Sanz, M. E., McCarthy, M. C., & Thaddeus, P. 2003, J. Chem. Phys., 119, 11715
- Sahai & Wannier (1985) Sahai, R., & Wannier, P. G. 1985, ApJ, 299, 424
- Scoville & Solomon (1978) Scoville, N. Z., & Solomon, P. M. 1978, ApJ, 220, L103
- Snyder & Buhl (1974) Snyder, L. E., & Buhl, D. 1974, ApJ, 189, L31
- Thorwirth et al. (2000) Thorwirth, S., Müller, H. S. P., Lewen, F., Gendriesch, R., & Winnewisser, G. 2000, A&A, 363, L37
- Thorwirth et al. (2003) Thorwirth, S., Müller, H. S. P., Lewen, F., Brünken, S., Ahrens, V., & Winnewisser, G. 2003, ApJ, 585, L163
- Tsuji (1964) Tsuji, T. 1964, Ann. Tokyo Astron. Obs., 9, 00
- Turner (1987a) Turner, B. E. 1987a, A&A, 182, L15
- Turner (1987b) Turner, B. E. 1987b, A&A, 183, L23
- Varberg & Evenson (1992) Varberg, T. D., & Evenson, K. M. 1992, ApJ, 385, 763
- Winnewisser et al. (1994) Winnewisser, G., et al. 1994, J. Mol. Spectrosc., 165, 294
- Winnewisser et al. (1997) Winnewisser, G., Belov, S. P., Klaus, T., & Schieder, R. 1997, J. Mol. Spectrosc., 184, 468
- Zink et al. (1990) Zink, L. R., de Natale, P., Pavone, F. S., Prevedelli, M., Evenson, K. M., & Inguscio, M. 1990, J. Mol. Spectrosc., 143, 304
- Zapata et al. (2009) Zapata, L. A., Menten, K., Reid, M., & Beuther, H. 2009, ApJ, 691, 332
| measured | calculated | |||||||
| 0 | – | 114 221 | .7523 (13) | 2143 | .271 | 7 | .228 | |
| 1 | 228 439 | .074 (25) | 228 439 | .1008 (24) | 2147 | .081 | 14 | .444 |
| 2 | 342 647 | .636 (20) | 342 647 | .6421 (33) | 2154 | .701 | 21 | .638 |
| 3 | 456 842 | .977 (10) | 456 842 | .9726 (37) | 2166 | .131 | 28 | .795 |
| 4 | 571 020 | .677 (12) | 571 020 | .6895 (37) | 2181 | .369 | 35 | .909 |
| 5 | 685 176 | .392 (5) | 685 176 | .3902 (34) | 2200 | .416 | 42 | .960 |
| 6 | 799 305 | .677 (10) | 799 305 | .6731 (32) | 2223 | .271 | 49 | .950 |
| 7 | 913 404 | .136 (5) | 913 404 | .1370 (40) | 2249 | .933 | 56 | .851 |
| 8 | – | 1 027 467 | .3817 (59) | 2280 | .401 | 63 | .657 | |
| 9 | – | 1 141 491 | .0083 (84) | 2314 | .674 | 70 | .366 | |
| 10 | – | 1 255 470 | .619 (11) | 2352 | .750 | 76 | .954 | |
| 11 | – | 1 369 401 | .816 (13) | 2394 | .628 | 83 | .431 | |
| 12 | – | 1 483 280 | .205 (15) | 2440 | .306 | 89 | .760 | |
| 13 | – | 1 597 101 | .393 (15) | 2489 | .783 | 95 | .941 | |
| 14 | – | 1 710 860 | .986 (13) | 2543 | .057 | 101 | .97 | |
| 15 | 1 824 554 | .595 (10) | 1 824 554 | .5953 (83) | 2600 | .125 | 107 | .85 |
| 16 | 1 938 177 | .832 (10) | 1 938 177 | .8318 (92) | 2660 | .986 | 113 | .51 |
| 17 | – | 2 051 726 | .309 (23) | 2725 | .636 | 119 | .04 | |
| 18 | – | 2 165 195 | .644 (46) | 2794 | .074 | 124 | .33 | |
| 19 | – | 2 278 581 | .453 (77) | 2866 | .298 | 129 | .41 | |
| 0 | – | 113 172 | .3761 (31) | 4260 | .062 | 3 | .588 | |
| 1 | 226 340 | .341 (20) | 226 340 | .3489 (56) | 4263 | .837 | 7 | .169 |
| 2 | 339 499 | .521 (20) | 339 499 | .5151 (72) | 4271 | .387 | 10 | .732 |
| 3 | – | 452 645 | .4717 (76) | 4282 | .712 | 14 | .270 | |
| 4 | 565 773 | .818 (10) | 565 773 | .8161 (69) | 4297 | .810 | 17 | .778 |
| 5 | 678 880 | .140 (10) | 678 880 | .1462 (66) | 4316 | .682 | 21 | .240 |
| 6 | 791 960 | .061 (25) | 791 960 | .0603 (98) | 4339 | .327 | 24 | .658 |
| 7 | 905 009 | .183 (25) | 905 009 | .158 (16) | 4365 | .744 | 28 | .017 |
| 8 | – | 1 018 023 | .038 (25) | 4395 | .932 | 31 | .304 | |
| 9 | – | 1 130 997 | .302 (34) | 4429 | .890 | 34 | .525 | |
| 10 | – | 1 243 927 | .553 (42) | 4467 | .616 | 37 | .665 | |
| 11 | – | 1 356 809 | .392 (48) | 4509 | .109 | 40 | .719 | |
| 12 | – | 1 469 638 | .425 (50) | 4554 | .367 | 43 | .677 | |
| 13 | – | 1 582 410 | .258 (45) | 4603 | .389 | 46 | .526 | |
| 14 | – | 1 695 120 | .497 (32) | 4656 | .172 | 49 | .273 | |
| 15 | 1 807 764 | .748 (15) | 1 807 764 | .752 (18) | 4712 | .716 | 51 | .907 |
| 16 | 1 920 338 | .703 (80) | 1 920 338 | .633 (48) | 4773 | .016 | 54 | .408 |
| 17 | – | 2 032 837 | .75 (11) | 4837 | .072 | 56 | .797 | |
| 18 | – | 2 145 257 | .73 (21) | 4904 | .880 | 59 | .032 | |
| 19 | – | 2 257 594 | .17 (33) | 4976 | .438 | 61 | .146 | |
| 0 | – | 112 123 | .087 (12) | 6350 | .439 | 1 | .207 | |
| 1 | – | 224 241 | .770 (22) | 6354 | .179 | 2 | .410 | |
| 2 | – | 336 351 | .644 (30) | 6361 | .659 | 3 | .603 | |
| 3 | – | 448 448 | .307 (35) | 6372 | .879 | 4 | .781 | |
| 4 | – | 560 527 | .354 (37) | 6387 | .837 | 5 | .939 | |
| 5 | 672 584 | .390 (40) | 672 584 | .384 (37) | 6406 | .534 | 7 | .075 |
| 6 | – | 784 614 | .995 (40) | 6428 | .969 | 8 | .182 | |
| 7 | 896 614 | .750 (100) | 896 614 | .785 (49) | 6455 | .141 | 9 | .255 |
| 8 | – | 1 008 579 | .357 (65) | 6485 | .049 | 10 | .290 | |
| 9 | – | 1 120 504 | .311 (85) | 6518 | .692 | 11 | .284 | |
| 10 | – | 1 232 385 | .25 (11) | 6556 | .068 | 12 | .232 | |
| 11 | – | 1 344 217 | .78 (12) | 6597 | .176 | 13 | .132 | |
| 12 | – | 1 455 997 | .51 (13) | 6642 | .014 | 13 | .976 | |
| 13 | – | 1 567 720 | .05 (12) | 6690 | .581 | 14 | .762 | |
| 14 | – | 1 679 381 | .012 (94) | 6742 | .874 | 15 | .488 | |
| 15 | 1 790 976 | .008 (50) | 1 790 976 | .004 (49) | 6798 | .892 | 16 | .151 |
| 16 | 1 902 500 | .636 (100) | 1 902 500 | .647 (96) | 6858 | .633 | 16 | .747 |
| 17 | – | 2 013 950 | .56 (25) | 6922 | .094 | 17 | .275 | |
| 18 | – | 2 125 321 | .36 (47) | 6989 | .272 | 17 | .728 | |
| 19 | – | 2 236 608 | .68 (78) | 7060 | .165 | 18 | .110 | |
a Numbers in parentheses are one standard deviation in units of the least significant figures.
| Parameter | ||||||||
|---|---|---|---|---|---|---|---|---|
| 57 635 | .968 019 (28) | 57 111 | .243 12 (66) | 56 586 | .555 00 (157) | 56 061 | .910 5 (59) | |
| 183 | .504 89 (16) | 183 | .490 3 (71) | 183 | .474 0 (234) | 183 | .511 (63) | |
| 171 | .68 (10) | 177 | .9 (145) | 163 | . (53) | 241 | . (134) | |
a Numbers in parentheses are one standard deviation in units of the
least significant figures.
b Winnewisser et al. (1997)