Spitzer spectra of Seyfert galaxies
Abstract
The Spitzer IRS high resolution spectra of about 90 Seyfert galaxies from the 12m Galaxy Sample are presented and discussed. These represent about 70% of the total complete sample of local Seyfert galaxies. The presence of starburst components in these galaxies can be quantified by powerful mid-IR diagnostics tools (i.e. 11.25m PAH feature equivalent width and the H2 emission line intensity) as well as the AGN dominance can be measured by specific fine structure line ratios (e.g. [NeV]/[NeII], [NeV]/[SiII], etc.). The observed line ratios are compared to the results of semianalytical models, which can be used to compute the AGN and starburst contributions to the total luminosity of the galaxies. The results are also discussed in the light of unification and evolution models.
Istituto di Fisica dello Spazio Interplanetario, INAF, Via Fosso del Cavaliere 100, I-00133, Roma, Italy
Astronomy Division, University of California, Los Angeles, CA 90095-1547, USA
1. Mid-IR spectroscopy with Spitzer
We briefly describe here some of the results of the mid-IR spectroscopic survey of Seyfert galaxies belonging to the 12m Galaxy sample (hereafter 12MGS)(Rush, Malkan & Spinoglio 1993).
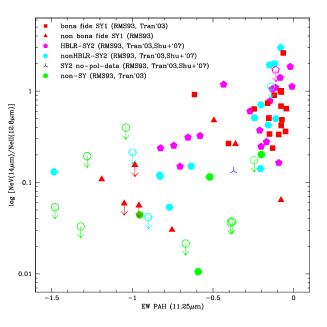
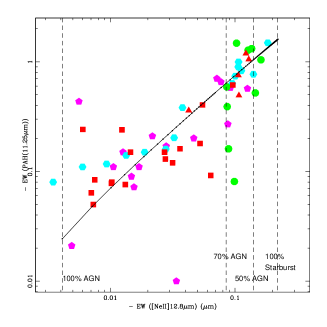
The first results of the Spitzer spectroscopic survey of the Seyfert galaxies of the 12m sample (Tommasin et al 2008) show a clear inverse trend between the indicator of AGN dominance, the [NeV]14.3m/[NeII]12.8m line ratio, and the equivalent width of the 11.25m PAH feature, which can be considered as an indicator of the star formation dominance, as shown in Figure 1a, where the sample objects increaed from 30 (Tommasin et al 2008) to 87 (Tommasin et al 2009). This result confirms an early finding of the ISO-SWS spectrometer (Genzel et al 1998) with a much better statistics. Here the Seyfert galaxies have been reclassified, following the results of spectropolarimetry Tran (2001, 2003), in type 1’s (including the classical Seyfert 1’s and the hidden Broad Line Region Seyfert 2’s, as discovered through spectropolarimetry) and ”pure” type 2’s (for which a BLR was not detected). Most of the type 1 objects, including both Seyfert 1s and hidden Broad Line Region Seyfert 2s, are located at high values of the [NeV]14.3m/[NeII]12.8m line ratio and very low or absent PAH emission.
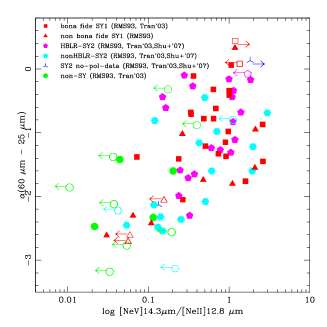
Another diagnostic diagram using both spectroscopic and photometric results is shown in Figure 1b: the spectral index between 25 and 60m versus the [NeV]14.3m/[NeII]12.8m line ratio. A clear trend shows that when the AGN dominance increases, the spectral index flattens. Most of type 1 objects appear to be concentrated in the upper right part of the diagram, at high values of AGN dominance and flat mid-to-far-IR slopes.
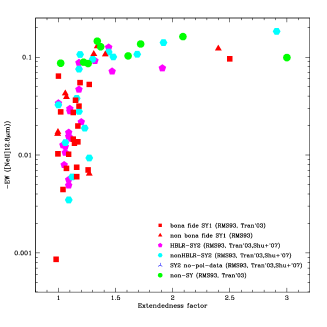
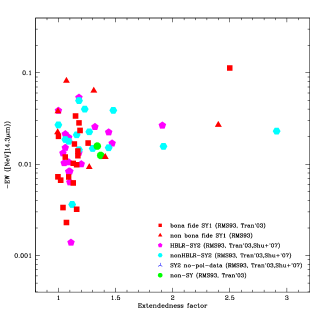
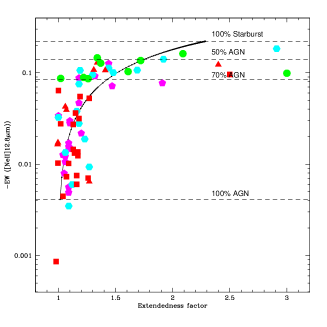
The two channels of the Spitzer high-resolution spectrometer: SH 9.6-19.5m with slit size 4.7′′ 11.3′′ and LH 19-39m with slit size 11.1′′ 22.3 ′′ allow multi-aperture photometry in the overlapping parts (19.0-19.5m). The ratio of the flux measured in LH to that measured in SH gives the extendedness of the source. We used this measure of the extendedness of the source to estimate the line emitting regions (Tommasin et al 2008). In Figure 2a we plot the [NeII]12.8m line equivalent width as a function of the source extendedness. We notice that those sources showing a significant mid-IR extendedness are mostly type 2 objects or non-Seyfert galaxies and have the highest [NeII]12.8m line equivalent width, with only two exceptions of very nearby Seyfert 1’s. An high [NeII]12.8m line equivalent width is a measure of a strong star formation component. This is not the case for the high excitation lines, originated from the AGN, such as [NeV], for which no apparent trend appears between source extendedness and line EWs , as can be seen in Figure 2b (Tommasin et al 2008).
2. Semianalytical models to estimate AGN and Starburst components
To estimate the percentage of the contribution of AGN and Starburst in the observed emission in a galaxy at 19m, we computed an analytical model, for each of the observed quantities as a function of R, which is defined as the ratio of the Starburst flux at 19m to the AGN flux at the same wavelength. R varies from zero - emission totally from the AGN - to infinity - emission totally from the Starburst. The chosen observed quantities are: the extendedness of the source, the equivalent width of PAH at 11.25m and [NeII] at 12.81m, the line ratio [NeV]14.32/[NeII]12.81m, the spectral index at (60-25)m.
In Fig.3a and 3b the diagrams of [NeV]/[NeII] vs (60-25) m and EW [NeII] vs EW PAH, are shown as examples, where the black curves represent the models. By inverting the models, i.e. solving the analytical expressions with the true values of the observed quantities, we obtained a value of R for each of the five observed quantities of every source. We then computed the mean value of R to estimate the relative percentage of AGN and Starburst emissions.
The sample of sources to which we apply this analysis is reduced because the models depend on the extendedness and the PAH equivalent width, which are not detected (for the PAH) or measurable (for the extendedness) for all the sources(from 86 to 59 objects). We found that the model can disentangle the AGN and the Starburst emission for 16 of 20 Seyfert 1’s, 14 of 16 HBLR’s, 13 of 14 nonHBLR’s, 7 of 9 objects re-classified as not Seyferts. The details of this approach will appear in Tommasin et al. (2009).
3. Analysis of the 12m sample multi-frequency dataset
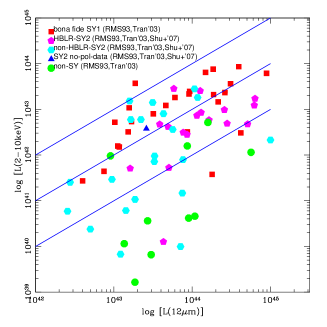
The 12MGS has been observed extensively from the radio to the X-rays and we can use the large set of data to search for correlations between different observed quantities. To show an example, we want to relate the X-ray luminosity, measuring the accretion, to the bolometric luminosity, as given by the 12m luminosity. We plot in Figure 4 the unabsorbed 2-10keV luminosity and the 12m luminosity.
Following the finding of Spinoglio & Malkan (1989) and Spinoglio et al (1995) that the 12m luminosity is linearly proportional to the bolometric luminosity, at a given Lbol in Figure 4a a sequence can be identified with decreasing accretion luminosity: from Seyfert 1’s HBLR-Seyfert 2’s pure Seyfert 2’s. Although these results are to be considered preliminary, as no statistical method has yet been applied, most Seyfert 1’s have:
Most HBLR-Seyfert 2’s have:
Most pure Seyfert 2’s and non-Seyfert’s have:
We preminilarily suggest that black hole accretion, as measured by X-rays, is the dominant mechanism determining the observational nature of a galaxy: when accretion is not an important energy source, we have galaxies without Seyfert nuclei, dominated by stellar evolution processes (called here non-Seyfert’s), then when accretion increases we have a sequence from the pure Seyfert 2’s, to the HBLR-Seyfert 2’s and finally when accretion dominates the bolometric luminosity, we have the Seyfert 1’s.
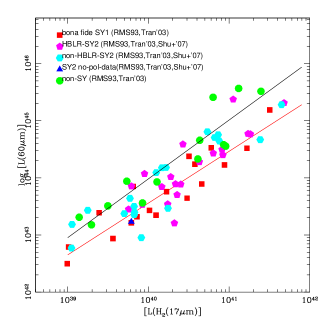
In an analogous way, we try to correlate the IRAS 60m luminosity (measuring the integrated star formation activity) and the H2 S(1) line luminosity (typical star formation indicator) in Figure 4b
Most Seyfert 1’s and HBLR-Seyfert 2’s have:
Most pure Seyfert 2’s and non-Seyfert have:
If we make least squares fits to the two extreme populations of Seyfert type 1’s and non-Seyfert galaxies, we obtain a sequence of two almost parallel lines of the form from the bottom to the top:
-
-
for Seyfert 1’s: =0.905, =7.325, with a regression coefficient of R=0.928;
-
-
for non-Seyfert’s: =1.030, =2.797, with R=0.925.
There are two interpretations of this behavior: either the more active galaxies (type 1’s) have enhanced H2 emission (Rigopoulou et al 2002), or at a given H2 luminosity, type 2’s (and non-Sy) have 5 times higher than type 1’s, because of an enhanced star formation process.
References
- Genzel et al (1998) Genzel, R. et al, 1998, ApJ, 498, 579
- Rigopoulou et al (2002) Rigopoulou, D., Kunze, D., Lutz, D., Genzel, R., & Moorwood, A.F.M. 2002, A&A, 389, 374
- Rush, Malkan & Spinoglio (2003) Rush, B., Malkan, M.A., & Spinoglio, L. 1993, ApJS, 89, 1 (RMS).
- Spinoglio & Malkan (1989) Spinoglio, L. & Malkan, M.A. 1989, ApJ, 342, 83
- Spinoglio et al (1995) Spinoglio, L., Malkan, M.A., Rush, B., Carrasco, L., Recillas-Cruz, E. 1995, ApJ, 453, 616
- Tommasin et al (2008) Tommasin, S., Spinoglio, L., Malkan, M.A., Smith, H., Gonzalez-Alfonso, E. & Charmandaris, V. 2008, ApJ, 676, 836.
- Tommasin et al (2009) Tommasin, S., Spinoglio, L., Malkan, M.A., Smith, H. 2009, in preparation
- Tran (2001) Tran, H.D., 2001, ApJ, 554, L19
- Tran (2003) Tran, H.D., 2003, ApJ, 583, 632