Late-Time Optical Afterglow Observations with LBT and MDM
Abstract
Using the 2.4m MDM and 8.4m Large Binocular Telescope, we observed nine GRB afterglows to systematically probe the late time behaviors of afterglows including jet breaks, flares, and supernova bumps. In particular, the LBT observations have typical flux limits of 25-26 mag in the Sloan band, which allows us to extend the temporal baseline for measuring jet breaks by another decade in time scale. We detected four jet breaks (including a “textbook” jet break in GRB070125) and a fifth candidate, all of which are not detectable without deep, late time optical observations. In the other four cases, we do not detect the jet breaks either because of contamination from the host galaxy light, the presence of a supernova bump, or the intrinsic faintness of the optical afterglow. This suggests that the basic picture that GRBs are collimated is still valid and that the apparent lack of Swift jet breaks is due to poorly sampled afterglow light curves, particularly at late times. Besides the jet breaks, we also detected late time flares, which could attribute to late central engine activities, and two supernova bumps.
Keywords:
Gamma-ray bursts:
98.70.Rz1 Introduction
Despite the tremendous success of the Swift mission (Gehrels et al. 2004), the late time optical afterglow observations still remain an area seldom explored by observers. The deep, late time observations are important to constraint the jet break time, detect supernova bumps, flares, and emission from the GRB host galaxies. All of these features have been detected before Swift, such as the jet break in GRB 990510 (Stanek et al. 1999) and the supernova bump in GRB011121 (Garnavich et al. 2003).
After the launch of Swift, with its rapid localization of GRBs and the dedicated on-board XRT instrument, the number of GRBs with jet breaks was expected to increase significantly. Instead, there are few jet break detected, and there arise a “missing jet break” problem. However, the complicated decay patterns both in X-rays and the optical make it more difficult to identify a jet break. While the flares are complications, the biggest problem for identifying jet breaks is the need for well-sampled, long term light curves. While almost all Swift bursts have good signal-to-noise ratio (S/N) X-ray light curves at early decay times, most of the jet breaks occur at late times when the uncertainties in the XRT light curves increase significantly. In these cases, the claim that the data are consistent with the single power-law decay does not distinguish between models, because the error-bars are so large that the data are also consistent with the broken power-law of a jet break. In the optical bands, the afterglow monitoring is generally sparse, in part because of the large number of bursts detected. Thus, the number of Swift bursts with jet breaks or supernova bumps is small.
Given the need for deep, late-time monitoring of GRBs, we initiated an observing program using the MDM 2.4 meter telescope and the newly built 8.4 meter Large Binocular Telescope (LBT, Hill et al. 2006). In particular, with 20–30 minute exposures, the LBT can reach a flux limit of – mag in the Sloan band. This allows us to extend the temporal baselines of optical afterglow monitoring by roughly an order of magnitude, and systematically search for the jet breaks and other emission components in the optical light curves.
2 MDM and LBT Observations
We observed 3 GRBs, GRB 060206, GRB 060210, and GRB 060526 with the MDM 2.4 telescope in the optical band in February and May 2006. We also observed 6 GRBs, GRB 070125, GRB 070311, GRB 070411, GRB070412, GRB070419A, GRB070518, with the 8.4 LBT using the Large Binocular Camera (LBC) Blue CCD camera (Ragazzoni et al. 2006) during the LBT/LBC Science Demonstration Time period in January–November 2007.
3 Results
| Telescope | Limit (mag) | Optical Break? | X-ray Break? | Simple Jet Model? | |
|---|---|---|---|---|---|
| 060206 | MDM | 21.5 | yes | consistent | yes |
| 060210 | MDM | 21.5 | faint | ||
| 060526 | MDM | 23.5 | yes | consistent | no |
| 070125 | LBT | 25–26 | yes | yes | yes |
| 070311 | LBT | 25–26 | yes | consistent | no |
| 070411 | LBT | 25–26 | candidate | consistent | |
| 070412 | LBT | 25–26 | faint | ||
| 070419A | LBT | 25–26 | contamination | ||
| 070518 | LBT | 25–26 | contamination |
3.1 Jet Breaks
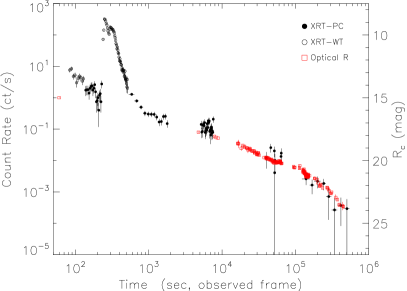
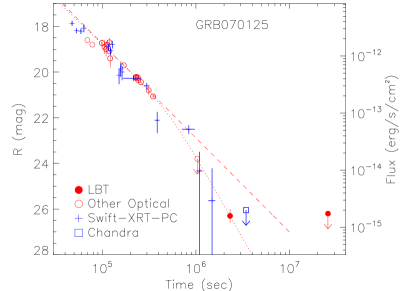
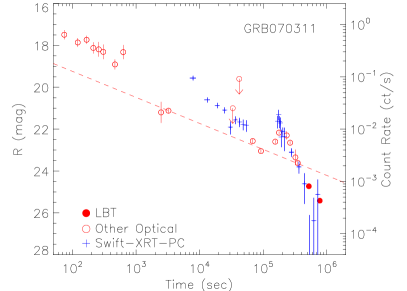
We summarize our jet search results in Table 1. In the sample of nine bursts we observed, we detected four optical jet breaks and a fifth candidate (Stanek et al. 2007; Dai et al. 2007, 2008). We show two examples GRB 060526 and GRB 070125 in Figures 1 and 2. In the other four cases, the jet break cannot be detected either due to the intrinsic faintness of the afterglow or the presence of additional contamination from host galaxies of supernova bumps. In the five bursts, where we detected an optical jet break/candidate, the X-ray light curves of these bursts are all consistent with the optical light curves, except for GRB070311, where optical and X-ray light curves are only consistent at post-break decay stage. In GRB 070125, a break is independently required from the X-ray light curve alone. This indicates all the break we detected are achromatic, and consistent with predictions from the jet models. However, if we only examine the X-ray data, only one break can be detected. Likewise, if we only monitor the optical afterglow to about 21–22 magnitude, we would only find one break. The results suggest that late time optical observations are the key to detect jet breaks.
When we further confront the jet model with the predictions from spectral and temporal decay slopes before and after the breaks, we found two bursts satisfy the prediction from simple jet models. In particular, GRB 070125 shows a “textbook jet break” (Dai et al. 2008). The break is independently seen in both optical and X-ray light curves, and the consistency of the optical and X-ray light curves suggests that the break is achromatic. Furthermore, the spectral and temporal decay indices before and after the break satisfy the predictions from the standard jet models. This result is confirm by an independent analysis (Updike et al. 2008). There are still two bursts, where temporal and spectral slopes do not satisfy predictions from the simple jet model. This could be caused by additional components in the afterglow light curves, or that the jet model is more complex (e.g., Panaitescu et al. 2006).
Overall, the results suggest that the basic picture that GRBs are collimated is still valid and that the apparent lack of Swift jet breaks is due to poorly sampled afterglow light curves, particularly at late times.
3.2 Flares
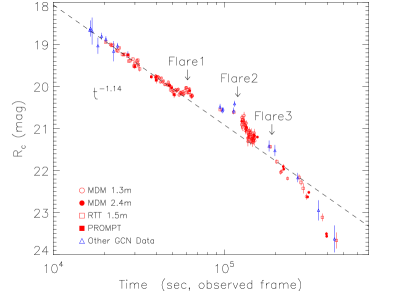
We observed significant optical flares both in early (GRB 060206) and late time (GRB 060526 and GRB 070311) decay stages, indicating the optical afterglows decay patterns are also complex. For the late time flares in GRB 060526 and GRB 070311, we found the relative amplitudes of the flares are large (), and they only last in a relatively short time (). These observations, with , are not consistent with variability caused by ambient density fluctuations (Ioka et al. 2005), and it is possible that these flares are associated with late central energy activities. We show the late flares in GRB 060526 and GRB 070311 in Figures 3 and 4.
3.3 Supernova Bumps
We also detected supernova bumps in GRB 070419A and GRB 070518. In Figure 5, we show the supernova bump in GRB 070518 as an example. The detailed analysis will be presented in Garnavich et al. (2008, in preparation) and McClelland et al. (2008 in preparation).

4 Summary
Deep, late-time optical monitoring is essential to search for jet breaks. Our current jet search results suggest that the basic picture that GRBs are collimated is still valid and that the apparent lack of Swift jet breaks is due to poorly sampled afterglow light curves, particularly at late times. Searching only in the X-ray band or from shallow optical light curves will miss a significant portion of jet breaks. Invalidating the beaming model needs well-sampled light curves. Besides the jet breaks, we also detected late time flares, which could attribute to late central engine activities, and two supernova bumps.
References
- Dai et al. (2007) Dai, X., et al. 2007, ApJ, 658, 509
- Dai et al. (2008) Dai, X., et al. 2008, ApJ, 682, L77
- Garnavich et al. (2003) Garnavich, P. M., et al. 2003, ApJ, 582, 924
- Gehrels et al. (2004) Gehrels, N., et al. 2004, ApJ, 611, 1005
- Hill et al. (2006) Hill, J. M., Green, R. F., & Slagle, J. H. 2006, Proc. SPIE, 6267, 62670Y
- Ioka et al. (2005) Ioka, K., Kobayashi, S., & Zhang, B. 2005, ApJ, 631, 429
- Panaitescu et al. (2006) Panaitescu, A., Mészáros, P., et al. 2006, MNRAS, 369, 2059
- Ragazzoni et al. (2006) Ragazzoni, R., et al. 2006, Proc. SPIE, 6267, 626710
- Stanek et al. (2007) Stanek, K. Z., et al. 2007, ApJ, 654, L21
- Stanek et al. (1999) Stanek, K. Z., Garnavich, P. M., et al. 1999, ApJ, 522, L39
- Updike et al. (2008) Updike, A. C., et al. 2008, ApJ, 685, 361