Analysis of the Decay at a Collision Energy of 500 GeV
Abstract
The analysis of at a next generation linear collider presents an opportunity to study the coupling of the Yukawa couplings of the second generation in a clean environment. We give an overview over the experimental challenges of this analysis at a collision energy of 500 GeV and present an outlook to the results of the analysis at a collision energy of 250 GeV.
1 Motivation
The environment at the ILC is primed for analyses of precision measurements of Higgs couplings. The analysis of the decay is an ideal opportunity to study the Yukawa couplings of the second generation in a clean environment and complement the recoil method measurement of this coupling by taking advantage of the large branching fraction of the decay of the Z boson to neutrinos. In addition to the physics interest, the decay of in an otherwise (almost) empty detector permits precision studies of the tracking performance and is used for detector benchmarking.
2 Software
In absence of fully reconstructed events this analysis was carried out on events generated by Pythia 6.4[2] and using the fast detector simulation in the org.lcsim framework. Events were simulated with the sid01 version of the SiD detector concept[3]. For the classification of events we used the TMVA[4] libraries that provide a variety of multi-variate classifiers.
3 Presentation of Samples
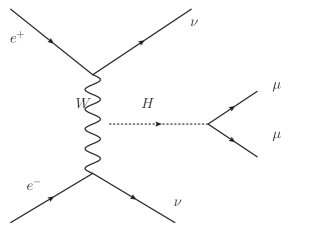
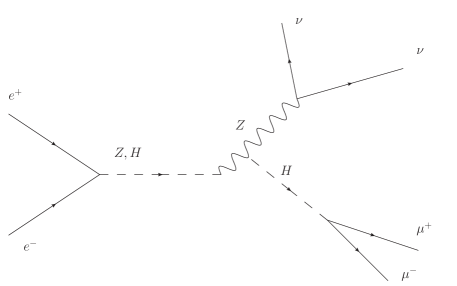
Events in the signal sample are computed with either of the two diagrams in Figure 1. The fraction of events in the signal sample containing a Z boson is 16.2%, the other 83.8% contain neutrinos from the vector boson fusion diagram111The relative fraction of the two contributing diagrams to the observed final state are obtained from PYTHIA 6.4. A mixture of different decays containing a pair of muons in the final state make up the background sample. The different samples and their cross-sections at an energy of 500 GeV in the center-of-momentum system are listed in Table 1.
| Process | cross-section (pb) | # events ) |
|---|---|---|
| 4 fermion | 8.3 | |
| 6.3 | ||
| 21.4 | ||
| 21.0 | ||
| invisible + |
4 Event and Candidate Selection
Events were selected by requiring exactly two muons. We assume a muon identification efficiency of 100%, leading to this cut being 98.7% efficient on signal, while rejecting 67.0 % of the considered background events.
4.1 Signal Candidates
After pre-selecting events by requiring a pair of identified muons, signal candidates are selected by applying a loose cut on the invariant mass of the muon pair. In order to avoid introducing systematic dependencies, the cut on the invariant mass is very wide around the nominal mass of the Higgs boson of GeV. Additional cuts on the visible energy in the event, the oblateness, and the acoplanarity result in a sample consisting of 25 signal events and 8891 background events. The cuts are listed in Table 2.
| Cut | Signal | Background |
|---|---|---|
| efficiency | efficiency | |
| 100 GeV di-muon mass 140 GeV | 95.4% | 4.1% |
| 130 GeV visible energy 260 GeV | 92.2% | 44.8% |
| 0 acoplanarity 0.5 | 77.7% | 62.3% |
| oblateness 0 | 75.9% | 33.8% |
5 Signal Extraction
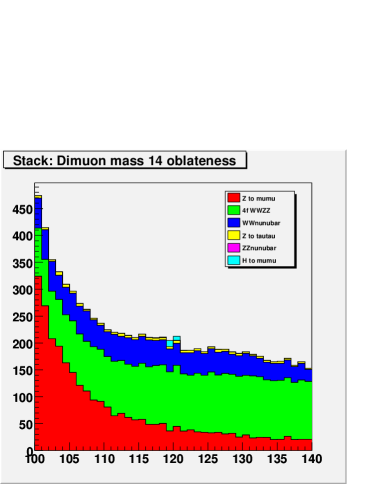
Since the other variables available to us do not exhibit clear distinctive features between signal and background, a square cut would reduce the signal efficiency to unacceptable levels. With the help of multivariate classifiers, we take advantage of the full statistical information available to us. Splitting the data sample into a training and a validation set, and providing the classifier with a number of variables in the training set results then in the optimal case in maximally separated signal and background classes. In this analysis, we found that boosted decision trees (also called “random forest”) [5] exhibit the best performance of the available classifiers and indeed outperform the more commonly used neural nets. With the following set of input variables, we achieve a classification of signal events with a statistical significance of 1.85 sigma. Figure 2 shows a stack of the distributions of the di-muon invariant mass for each of the samples after cuts.
-
•
opening angle of the muon pair
-
•
missing momentum
-
•
for each muon
-
•
energy for each muon
-
•
transverse momentum for each muon
-
•
whether the muons traversed barrel or endcap
-
•
ratio of the muon energies
-
•
ratio of of the muons
6 Summary and Outlook
We have presented the status of the analysis of the decay in the framework of a fast simulation of the sid01 detector. We expect to improve upon the achieved signal significance of 1.85 sigma by including a larger sample and by adding a maximum likelihood fit for the signal extraction.
This study was carried out at a collision energy of 500 GeV. Events mediated by the s-channel diagram 1b are easier to separate from background, because the missing mass exhibits a peak at the nominal Z mass. The fraction of these events in the signal sample is 16.2% at 500 GeV. For the LOI benchmarking effort, the analysis will be repeated at a collision energy of 250 GeV, reducing the relative fraction of t-channel events in the signal sample to 16.0%.
7 Acknowledgments
The authors would like to expresses thanks to the org.lcsim development team for producing a stable simulation and reconstruction framework for future linear colliders.
References
-
[1]
Presentation:
http://ilcagenda.linearcollider.org/contributionDisplay.py?contribId=397&sessionId=16&confId=2628 - [2] Torbjorn Sjostrand, Stephen Mrenna, Peter Skands, JHEP 0605:026 (2006).
- [3] The SiD detector outline document http://hep.uchicago.edu/ oreglia/siddod.pdf
- [4] Andreas Hocker et al., PoS ACAT 040 (2007)
- [5] Leo Breiman, Machine Learning 45 (1), 5-32 (2001)