Clustering of passive impurities in MHD turbulence
Abstract
The transport of heavy, neutral or charged, point-like particles by incompressible, resistive magnetohydrodynamic (MHD) turbulence is investigated by means of high-resolution numerical simulations. The spatial distribution of such impurities is observed to display strong deviations from homogeneity, both at dissipative and inertial range scales. Neutral particles tend to cluster in the vicinity of coherent vortex sheets due to their viscous drag with the flow, leading to the simultaneous presence of very concentrated and almost empty regions. The signature of clustering is different for charged particles. These exhibit in addition to the drag the Lorentz-force. The regions of spatial inhomogeneities change due to attractive and repulsive vortex sheets. While small charges increase clustering, larger charges have a reverse effect.
pacs:
52.30.-q, 52.65.-y, 52.30.CvI Introduction
Many natural and technological settings involve the transport of particles with mass densities much higher than the main constituents of the underlying turbulent plasma. For instance in astrophysics, dense dust grains are suspended in the interstellar mediumYan and Lazarian (2003) or in molecular clouds.Falceta-Gonçalves et al. (2003) Despite usually constituting only a small fraction of matter in a given astrophysical system, dust is of central importance for an understanding of many processes, such as the heating and cooling of interstellar and intergalactic plasmas.Tielens and Peeters (2002); Montier and Giard (2004) It is also of significance for the detection of interstellar magnetic and velocity fields and their turbulent properties.Crutcher et al. (2003); Heyer et al. (2008) Dust grains also play important roles in turbulent protoplanetary disks for the formation of planets,Fromang and Papaloizou (2006) for the interaction of comets with the solar wind,de Juli et al. (2007) or the modification of Kolmogorov spectra of weakly turbulent shear Alfvén waves in the ionosphere.Onishchenko et al. (2003)
In industrial applications, fusion plasmas usually contain a significant population of heavy charged particles mostly coming from the introduction of dust in the plasma by erosion of walls.Tsytovich et al. (1999); Rognlien (2005); Pigarov et al. (2005); Rosenberg et al. (2008) An understanding of dust dynamics in this context is not only of interest in order to quantify the effect of impurities but also to possibly remove the dust particles by exploiting the notion that scattering through waves can enhance the drag force on dust particles by orders of magnitude.de Angelis (2006)
An important aspect of the passive transport of dense particles is the fact that their inertia can rarely be neglected and is in general responsible for the apparition of strong inhomogeneities in their spatial distribution. Indeed, dense particles experience a centrifugal acceleration in the rotating regions of the flow and tend to concentrate in those places where strain is dominant. In the purely hydrodynamical turbulent motion of neutral fluids, this well-studied phenomenon is usually referred to as preferential concentration.Squires and Eaton (1991) Its main manifestation is the creation of large particle voids in the most excited parts of the turbulent flow, which are separated by high-concentration regions where the particles follow the calmer motions of the fluid. The process of ejection from eddies is universal and is also expected in the case of conducting fluids. It is well known, however, that in MHD turbulence, the large-strain regions are characterized by the presence of current/vorticity sheets where both the magnetic field and the fluid velocity experience strong fluctuations (see, e.g., Ref. Biskamp, 2003).
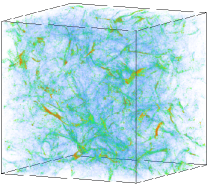
Consequently particles tend to cluster in the vicinity of these sheets, as already observed in anisotropic MHD simulations at low magnetic Reynolds numbers.Rouson et al. (2008) In statistically isotropic situations, such an observation is confirmed as illustrated in Fig. 1 where sheet-like structures can clearly be observed in the instantaneous three-dimensional distribution of neutral particles obtained from a direct numerical simulation.
These correlations between the most active regions of the flow and the particle distribution contrast much with what is observed in neutral flows where, conversely, the particles flee coherent structures. This implies major differences in the properties of dense particles suspensions depending whether the flow is charged or not. For instance, we will see that inertial-range particle dynamics in MHD is ruled by concentration processes rather than ejection processes, leading to larger fluctuations in their spatial mass distribution.
This paper is organized as follows. Section II gives a detailed description of the model we consider, of its domain of validity, and of the numerical methods we use to integrate it. In Section III we present a qualitative comparison of the effects of preferential concentration in charged and neutral turbulent flows, emphasizing in each case the different roles played by the flow coherent structures. Section IV is dedicated to a more quantitative study of particle clustering, both at dissipative and inertial-range scales. In the former case, we show that particles cluster on a singular set displaying multi-fractal properties. In contrast, this scale-invariance does not hold in the inertial range where the mass distribution rather depends on a scale-dependent contraction rate of the particle dynamics. In Section V, we present results on the effect of the particle charge on their concentration properties. Finally, Section VI encompasses concluding remarks.
II Model and methods
We consider an electrically conducting fluid whose dynamics is described by the MHD equations
| (1) | |||
| (2) | |||
| (3) |
where is the fluid velocity field and is the magnetic field written with the dimension of a velocity (i.e. it is the magnetic field expressed in the Gaussian system of units divided by where is the fluid mass density). and are the kinematic viscosity and the magnetic diffusivity, respectively. and are two forces such that the amplitudes of the Fourier modes associated to wavelengths of modulus less than 2 are kept constant. Such a choice provides an input of kinetic and magnetic energies, preventing them to condensate at large length scales. This means in particular that there is no mean magnetic field, , so that the turbulence is statistically isotropic. The electric field is related to the magnetic field by the Ohm’s law
| (4) |
Here has the dimension of a square velocity, meaning in the Gaussian system, that it has been multiplied by .
We consider next a spherical particle embedded in the MHD flow described above. We assume that its radius is much smaller than the smallest active scale of the carrying fluid flow (in turbulence, the Kolmogorov dissipation scale where designates the mean kinetic energy dissipation rate). We also assume that the mass density of the particle is much higher than the fluid mass density . These assumptions allows one to approximate the particle by a point and considering that the main effect exerted on it by the fluid is a Stokes viscous drag, which is proportional to the velocity difference between the particle and the fluid flow. When in addition the particle is uniformly charged with density and evolves in an electro-magnetic field, it is subject to the Lorentz force, so that its trajectory is a solution to the Newton equation
| (5) |
where the dots stand for time derivatives and and (with the charge density expressed in Gaussian units). Note that we neglect here the effect of gravity.
The first term on the right-hand side of (5) represents the viscous drag of the particle with the flow. It involves the Stokes time , which is the relaxation time of the particle velocity to the fluid velocity. This characteristic time scale gives a measure of particle inertia and is usually non-dimensionalized by the Kolmogorov time scale to define the Stokes number . When , the particle responds very quickly to the flow fluctuations and almost follows the dynamics of tracers, i.e. . Conversely, when , a long time is required for the particle to react and consequently it moves quasi-ballistically with a low velocity.
The second term on the right-hand side of (5) involves the length-scale , which measures the importance of the Lorentz force exerted by the ambient fluid magnetic and electric fields onto the particle. By analogy to the Stokes number which parameterizes the relative motion of particles at scales of the order of the Kolmogorov dissipative scale , a non-dimensional Lorentz number can be introduced as (where is the root-mean square (r.m.s.) value of the magnetic field). Note that, conversely to St, this number involves a large-scale quantity, , because of the cross-product quadratic non-linearity appearing in the Lorentz force. This number can be written as and measures the relative effect of the Lorentz force with respect to the viscous drag. When , the Lorentz force is negligible and inertia dominates. When , the former is dominating the particle dynamics.
| 100 | 0.94 | 2.7 | 17 |
Note that, besides the hypotheses of small radius and large mass density that are necessary to write the viscous drag in the present form, it is implicitly supposed that the particle charge does not affect the local motion of the charged fluid. For this, it is required that the Coulomb force exerted by the particle onto the plasma charges that are at a distance of the order of the particle radius is much smaller than the Lorentz force exerted on these charges by the ambient electromagnetic field. Namely, one must have . This condition restricts the model validity to not-too-high values of the particle charge density, and thus of the Lorentz number Lo. However, some freedom is left for the choice of parameters. Indeed, the charged particle is characterized by three parameters: its radius , its mass density and its charge density and one can show that it is always possible to find a combination of these parameters satisfying the three constraints on the validity of this model with arbitrary values of the Stokes and Lorentz numbers.
Finally, in the proposed model, we neglect the collective effects of the particles onto the MHD flow, i.e. the particles are passive. This implies that the application fields are restricted to very diluted situations where the particle number density is so small that their hydrodynamical and electromagnetic effects on the conducting carrier fluid can be disregarded. This does not prevent from considering, for instance for statistical purposes, a large number of such passive particles in the flow.
The numerical simulations are carried out using the reformulation of the momentum equation (1) in terms of the vorticity and a pseudo-spectral solver. The underlying equations are treated in Fourier space, while convolutions arising from non-linear terms are computed in real space. A Fast-Fourier-Transformation (FFT) is used to switch between these two spaces. The time scheme is a Runge-Kutta scheme of third order.Shu and Osher (1988) The inter-process communication uses the Message Passing Interface (MPI). The main parameters of the simulation are given in Tab. 1.
In addition to the fluid fields, we introduce three different types of particles into the flow: fluid tracers corresponding to the degenerate case , heavy uncharged particles with and 11 different values of St between and , and finally heavy charged particles with and 8 different (positive) values of Lo between and . One million particles of each species are uniformly seeded into the statistically stationary flow. After a period of relaxation of , where desigantes the large-scale eddy turnover time, the statistical analysis of particle dynamics is started and averages are performed over a time span also equal to . In order to obtain from the grid values the velocity and magnetic fields at the particle positions we use a tri-linear interpolation. This interpolation scheme parallelizes efficiently and provides sufficient accuracy Homann et al. (2007a) for the statistical properties under consideration.
III Preferential concentration in conducting flow
We focus in this Section on the effect of the Stokes drag on the qualitative properties of particle clustering. For this we consider uncharged particles (with ), so that the Lorentz’s force in the Newton equation (5) can be neglected. In an incompressible flow, the dynamics of tracer particles (), whose trajectories are solutions to , is volume preserving. Consequently, an initially uniform distribution of tracers remains uniform at any later time. Because of their drag with the fluid, heavy particles have a dissipative dynamics and their spatial distribution tends to develop strong spatial inhomogeneities, which are observed to span almost all scales of the fluid turbulent motion (see, e.g., Fig. 1). The particles strongly deviate from the fluid motion in those places where the latter experiences spatial or temporal fluctuations. The clustering properties are thus essentially coupled to the statistical properties of velocity gradients (and accelerations). At small scales (below the Kolmogorov scale where the flow is differentiable) the spatial distribution of particles is settled by the one-point fluid gradient statistics. At inertial-range scales, it is the structure of the gradient field that determines the spatial organization of particles. Hence, depending on the observations scales, different processes are invoked to describe clustering.
The small-scale clustering can be mostly explained using the formalism developed for dissipative dynamical systems. As is well known trajectories of such systems tend to concentrate onto a fractal set called attractor (see, e.g., Ref. Eckmann and Ruelle, 1985). For heavy particles whose trajectories solve a non-autonomous second-order differential equation, this set is embedded in the position-velocity phase space and evolves dynamically. The instantaneous positions of particles are obtained by projecting this set onto the position subspace. The fractal properties of the attractor can be preserved by this projection, leading to non-trivial scaling laws for the particle distribution at small scales. The fractal properties of the attractor are fully determined by the statistical properties of the linearized particle dynamics,Bec et al. (2004) which only involves the fluid velocity gradient along particle paths. The conducting character of MHD turbulent flow does not alter such a mechanism. Although the probability density function (PDF) of velocity gradients in MHD quantitatively differs from that observed in neutral fluid turbulence, the qualitative picture of dissipative-scale clustering is the same. For instance, in both cases, concentration processes are optimal for Stokes numbers of the order of unity. Such qualitative similarities are confirmed in next Section.
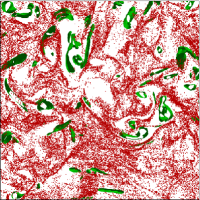
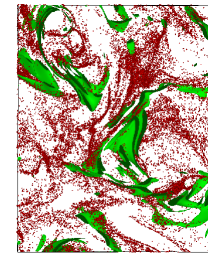
Strong qualitative differences between neutral and conducting carrier flows show up in the spatial distribution of particles at scales within the inertial range. In hydrodynamical turbulence this distribution anti-correlates with the spatial organization of the rotating structures. As illustrated in Fig. 2 (Left) rotating structures where vorticity is strong tend to expel particles that then concentrate in the calmer regions in between eddies. The mechanism of ejection from vortex filaments is sketched in Fig. 3. The flow structure of a conducting fluid is very different. In MHD turbulence violent gradients correspond to high strain regions and not to strong rotations. The coherent structures are thus vorticity/current sheets and the particles tend to agglomerate on them as illustrated from Fig. 2 Right.
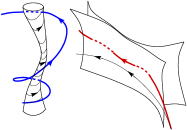
As sketched in Fig. 3 a heavy particle tends to approach closer to a vortex sheet than fluid tracers, clearly leading to high concentration in its vicinity. Moreover, this phenomenon can be amplified when heavy particles cross the sheet. As vortex sheets almost correspond to discontinuities of the velocity field, heavy particles might hence enter a region with a velocity very different from that of the fluid. This implies a phase during which the particle decelerates and which is responsible for the concentration of particles close to the sheets. Of course, the particle clusters and the sheets do not have a one-to-one correspondence. The fluid velocity close to the sheet is parallel to it and thus entrains the particles to the edges of the structure, a picture that applies also to fluid tracers.Homann et al. (2007b) The fraction of particles that are close to a given current sheet depends on the dynamical history of the latter and in particular on its lifetime and on the fact whether or not it has experienced violent accelerations.
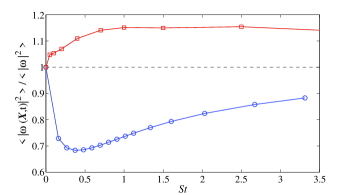
This different sampling of high-vorticity structures by heavy particles in hydrodynamic or MHD turbulence has important impact on the distribution of vorticity along their paths. This can clearly be observed by measuring vorticity fluctuations at the particle positions. Figure 4 shows the second-order moment of vorticity as a function of the particle Stokes number. While in hydrodynamic turbulence one observes for Stokes numbers of the order of unity a large drop-off of more than 30% with respect to the Eulerian vorticity, a gain of 15% can be measured in MHD turbulence. In both cases this trend displays a maximum for St of the order of unity and tends to disappear at large inertia. The effect of inertia on vorticity sampling is not visible in the core of the vorticity distribution. It is rather due to a change in the time fraction that the particles spend in the violent regions with large fluctuations of the fluid velocity gradient.
IV Quantitative study of clustering
We now turn to more precise and systematic ways to characterize particle clustering. The particle spatial distributions are of different natures if the fluid velocity field is differentiable or not. Dissipative and inertial-scale clustering are thus distinguished here.
IV.1 Small-scale clustering
At those scales where the fluid velocity field is differentiable, particle clustering stems from a competition between the stretching imposed by the fluid velocity gradient and the linear relaxation/dissipation due to the particle viscous drag. This materializes by the convergence of particle trajectories to a dynamically evolving fractal attractor in the position-velocity phase space. The particle locations are then obtained by projecting such a singular set onto the configuration space. Hence, depending on the fractal dimension, the projection is or is not also singular, leading to possibly fractal spatial distribution of particles.
A (multi)fractal distribution is characterized by a dimension spectrum (see, e.g., Ref. Eckmann and Ruelle, 1985), which is related to the scaling behavior of the various moments of the coarse-grained mass distribution. Consider the coarse-grained density defined as the mass of particles inside a fixed box of size , divided by the volume of the box. The -th order moment of the coarse-grained density behaves as for , where denotes the space dimension. is usually refered to as the information dimension and as the correlation dimension. We focus here on second-order statistics, because they relate to the probability of finding two particles close to each other and, thus, to estimate the rate of local binary interactions (as e.g. collisions, chemcal reactions, etc.). Indeed, one can easily show that the probability of finding two particles closer than a given distance behaves at small scales as (see, e.g., Ref. Eckmann and Ruelle, 1985).
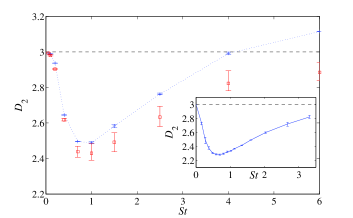
Figure 5 represents the behavior of the correlation dimension as a function of the Stokes number for neutral (uncharged) particles. is observed to decrease from at , where the dynamics of particles recover that of uniformly distributed tracers in an incompressible flow. It reaches a minimum for (maximum of small-scale clutering), and increases again to reach at large St where the dynamics of particles becomes less and less influenced by the flow and approaches the ballistic motion of free particles. In order to estimate the correlation dimension, two different methods were used. The first one consists in averaging the local slope (i.e. the logarithmic derivative) of over a scaling range of roughly two decades in . The error is then estimated through the maximum and minimum deviations of the local value of the slope from its average. This method leads to over-estimate clustering for . Indeed, as was observed in synthetic flows,Bec et al. (2007b) the probability of finding in the physical space two particles at a distance less than behaves as , where is the phase-space correlation dimension. When , the physical-space correlation dimension is . Conversely, when , the particle distribution is space filling (to second order) and . Assuming such a form for the two leading terms in gives much better estimates of the correlation dimension and allows one to observe a saturation of the physical-space correlation dimension to for . As seen from the inset of Fig. 5, the correlation dimension as a function of the Stokes number has a similar behavior as in purely hydrodynamic turbulence. The main difference is a rescaling of the horizontal axis by a constant factor and comes from the definition of the Stokes number, which involves the turnover time associated to the Kolmogorov dissipative scale. The measurement of the latter as the typical scale of the velocity gradient gives some uncertainty that might explain this discrepancy.
The scaling behavior of the coarse-grained density distribution, which is related to the dimension spectrum, implies a specific large-deviation form for the PDF of . Indeed, one can easily see that if the moments behave as , the local dimension has to follow at small scales the large deviation form , where (see, e.g., Ref. Bec et al., 2004). The rate function is positive and convex and attains its minimum (equal to 0) for .
IV.2 Inertial-range clustering
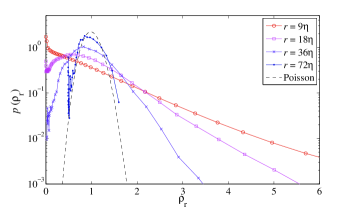
The large-deviation form for the distribution of the coarse-grained density that is discussed above gives a very precise meaning for the scaling behavior of the fluctuations of mass at small scales. Above the Kolmogorov scale, where the flow is itself almost self-similar and spans a large range of timescales, such an invariance is broken because particles tend to preferentially select those eddies of the flow whose associated turnover time is of the order of their response time. Figure 6 represents the various PDFs of the coarse-grained density at fixing the particle Stokes number and varying the box size inside the inertial range of the turbulent carrier flow. One observes that the deviation from a Poisson distribution is maximal at small scales and that the particle distribution approaches uniformity when increases. It is clear from this picture that the PDF associated to two different scales do not differ only through a scaling factor, so that there is no large deviation principle ruling the mass distribution in the inertial range.
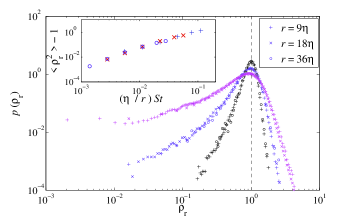
The PDF of the coarse-grained density has noticeable characteristics that give insights on the mechanisms leading to particle clustering. Both tails (at low and high values of the mass) are much wider than what would be expected from a uniform distribution. This implies that, on the one hand, it is pretty probable to observe a region with a very large mass, but on the other hand it is also very probable to observe a region almost empty of particles. The large-density tails decrease exponentially or slower. This is in contrast to what was observed in hydrodynamic turbulence, where the decrease is clearly faster than exponential.Bec et al. (2007a); Bec and Chétrite (2007) This exhibits a difference in the clustering process and might be traced back to the distinct role of the coherent structures discussed in previous section. The behavior of the small-density tails is far from being completely settled. As seen from Fig. 7, it seems to display a power-law decay, but the data seems spoiled by a plateau due to the limited number of particles used in the simulation. For hydrodynamic turbulence where a larger number of particles were used, this effect was not so visible and clear evidence of a power-law behavior could be obtained.Bec et al. (2007a)
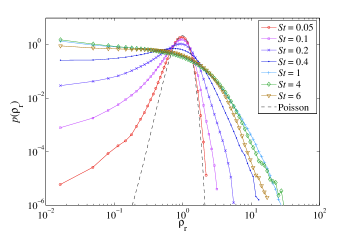
As seen from Fig. 7, a uniform distribution is also recovered if, in place of increasing while keeping St fixed, one fixes and decreases St. Strong deviations from uniformity are indeed observed for and the distribution approaches that of Poisson when . This leads to asking the question whether or not the two limits of small inertia and are equivalent, or more precisely if the probability distribution depends in this limit on a single parameter . To answer this question, one first notices that in the limit of small inertia, the particle velocity is to leading orderMaxey (1987)
| (6) |
This approximation consists in assuming that the particles behave as if they were advected by a synthetic compressible flow. The important time scale that measures the strength of particle inertia with response time at a given scale is given by the inverse of the rate at which a particle blob of size contracts when advected by this synthetic compressible flow, namely
| (7) |
The idea is now to understand phenomenologically how the integral on the right-hand side behaves as a function of . One can first notice that using the divergence theorem, the volume integral can be rewritten as the surface integral on of . We next assume that the blob overlaps a vortex/current sheet where the velocity almost experiences a jump. This implies a behavior of the surface integral , where is the typical velocity difference over the Kolmogorov scale . In terms of the Stokes number , the blob contraction rate thus behave as and is thus proportional to the non-dimensional contraction rate . Finally, this approaches predicts that the inertial-range distribution of particles in the limit or depends only on the non-dimenional contraction rate . As seen from Fig. 8, numerical results confirm this behavior.
V Effect of particle charge
Despite cases were impurities can be handled as neutral particles in a conducting fluid,Fromang and Papaloizou (2006) there are several situations where the particles have a charge density different from the carrier flow.Yan and Lazarian (2003); Falceta-Gonçalves et al. (2003) In this section we investigate the clustering properties of charged particles arising from a non-vanishing Lorentz number Lo. To shed light on the effect of a charge density different from the surrounding flow, we focus on ensembles of particles with identical Stokes number but differing Lorentz numbers.
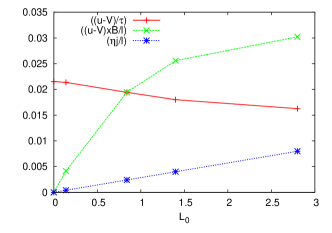
One first notices that Ohm’s law (4) leads to rewrite the equation (5) for the particle dynamics as
| (8) |
To get an impression of the relative importance of the three terms appearing on the right-hand side, Figure 9 depicts their root-mean-square values as a function of the Lorentz number. For small Lo the drag force dominates. Around the electromagnetic part wins over the drag force.
V.1 Current sheet selection
We first report some results on the effect of the charge, and thus of the Lorentz force acting on the particles, on their clustering properties. While neutral particles tend to cluster in the vicinity of any current/vortex sheet, charged particles are observed to concentrate preferentially on a subset among these sheets. Indeed, because of the Lorentz-force exerted on the particles, there are attractive and repulsive sheets. In general the velocity of heavy particles is lower than the fluid velocity at the particle position. Hence, positively charged particles are attracted by sheets with . Figure 10 represents the probability density of this scalar product along the trajectories of neutral and charged particles with the same Stokes number. One can observe that the distribution is tilted towards positive values.
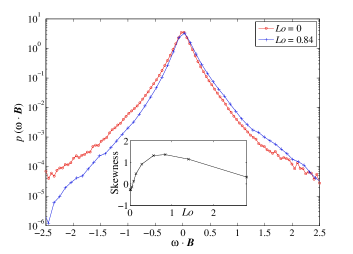
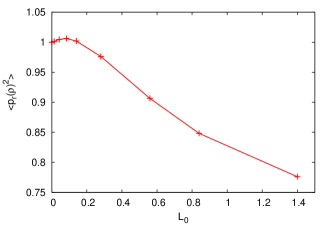
A quantitative measure of the preferential selection of certain sheets is provided by the skewness of the distribution of the scalar product . As is shown in the inset of Fig. 10 the maximal skewness and hence the maximal preference for attractive sheets is attained for . There are two possible reasons for the decrease in the preferential selection of the sheets beyond this value. A first reason relies on a decreasing Larmor radius ( for ), since the argument presented for the attraction and repulsion only holds for Larmor radii much larger than the Kolmogorov-scale. A second reason originates from a reduction of the degree of concentration at large Lorentz numbers, as will be discussed in the following two subsections.
V.2 Small-scale clustering
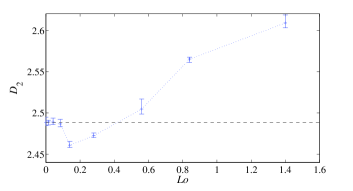
As for the neutral particles we measured the correlation dimension (see Fig. 11). In order to have a visible effect the Lorentz number has to exceed a certain threshold. Beyond this relatively flat region the charge leads to an increased concentration below the Kolmogorov scale, hence to a smaller . This is in relation to the preferential selection of sheets discussed in the previous subsection. The clustering is enhanced as the attraction argument provides an additional mechanism for building concentrations.
However, larger Lorentz numbers weaken the preferential concentration significantly. This can be explained by the fact that the principal clustering process arises from the drag force. As the electromagnetic force wins over the drag force for large Lorentz numbers its influence is weakened and the correlation dimension exceeds that of the neutral particles, therefore reducing the small-scale clustering.
V.3 Inertial-range clustering
In the previous subsection we showed that small increase the clustering at scales below the Kolmogorov scale. Turning to the implications of a finite Lorentz number for the inertial range of scales the qualitative findings are comparable. Fig. 12 confirms the tendency to an increased clustering for small charges also in the inertial range, with again a decrease at higher charges.
Note that the rescaling of the inertial-range distribution as a function of the contraction factor observed for neutral particles does not apply in the case of charged particles. The presence in that case of the Lorentz force, in addition to the viscous drag, does not allow an approach similar to that presented in Section IV.
VI Concluding remarks
We have presented results on the study of heavy particle transport by MHD turbulent flows. Because of their inertia such particles were observed to display strong inhomogeneities in their spatial distribution. More precisely, heavy particles tend to concentrate in the vicinity of the current sheets that are present in the conducting flow. Neutral (uncharged) particles approaches sheets, irrespectively of the nature of the latter, while charged particles, because of a combined effect of the Stokes drag and the Lorentz force, select those sheets where the scalar product between the magnetic field and the vorticity is of the same sign as their charge.
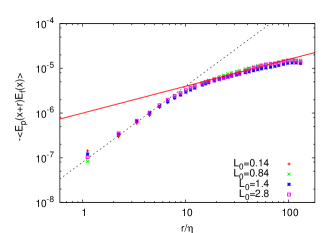
The particle dynamics considered in this work is entirely passive, namely they have no feedback on the carrier flow. To estimate their possible influence on the flow we computed the electric field produced by the passive charged particles. This field is of course pronounced in regions with high concentrations. It is oriented in a way to act against the outer electric field due to the charge in the flow. To quantify these findings we measured the correlation and observed that it was negative at all spatial scales. As seen from Fig. 13, this correlation is observed to behave as a function of the scale like a power-law with exponent in the dissipative range and in the inertial range. The origin of these power laws is still an open question which is clearly related to the concentration properties of the particles.
It seems crucial to include electrical interactions between particles as soon as the latters are not very diluted in the conducting flow. Electric repulsive forces should clearly alter both the small-scale and the inertial-range properties of the particle spatial distribution but we still expect the preferential selection of current sheets to occur at inertial-range scales.
Finally we would like to stress a possible application of the results presented here. Light particles, such as bubble in water, have now been used for a long time in order to give a direct visualization of the intense vortex filaments that are present in hydrodynamic turbulence.Douady et al. (1991) We have seen here that heavy particles in magneto-hydrodynamics tend to cluster in the vicinity of the current sheets that represent the most violent structures present in the turbulent motion of conducting flows. An idea could then be to use such particles in order to develop a new direct visualization technique of MHD flows that is expected to be very useful for grabbing qualitative and quantitative global information in turbulent dynamo experiments.
Acknowledgments
Access to the IBM BlueGene/P computer JUGENE at the FZ Jülich was made available through project HBO22. Part of the computations were performed on the “mesocentre de calcul SIGAMM”. The work of H.Homann benefitted from a grant of the DAAD. This research was supported in part by the National Science Foundation under Grant No. PHY05-51164, by the Agence Nationale de la Recherche under Project DSPET, DFG-FOR 1048, and the SOLAIRE Network (MTRN-CT-2006-035484).
References
- Yan and Lazarian (2003) H. Yan and A. Lazarian, Astrophys. J. Lett. 592, L33 (2003).
- Falceta-Gonçalves et al. (2003) D. Falceta-Gonçalves, M.C. de Juli, and V. Jatenco-Pereira, Astrophys. J. 597, 970 (2003).
- Tielens and Peeters (2002) A. G. G. M. Tielens and E. Peeters, in EAS Publ. Ser., edited by M. Giard, J. Bernard, A. Klotz, and I. Ristorcelli (2002), vol. 4 of EAS Publ. Ser., pp. 43–43.
- Montier and Giard (2004) L. A. Montier and M. Giard, Astron. Astrophys. 417, 401 (2004).
- Heyer et al. (2008) M. Heyer, H. Gong, E. Ostriker, and C. Brunt, Astrophys. J. 680, 420 (2008).
- Crutcher et al. (2003) R. Crutcher, C. Heiles, and T. Troland, in Turbulence and Magnetic Fields in Astrophysics, edited by E. Falgarone and T. Passot (2003), vol. 614 of Lecture Notes in Physics, Berlin Springer Verlag, pp. 155–181.
- Fromang and Papaloizou (2006) S. Fromang and J. Papaloizou, Astron. Astrophys. 452, 751 (2006).
- de Juli et al. (2007) M.C. de Juli, R.S. Schneider, L.F. Ziebell, and R. Gaelzer, J. Geophys. Res. 112, 10105 (2007).
- Onishchenko et al. (2003) O. G. Onishchenko, O. A. Pokhotelov, R. Z. Sagdeev, L. Stenflo, V. P. Pavlenko, P. K. Shukla, and V. V. Zolotukhin, Phys. Plasmas 10, 69 (2003).
- Rognlien (2005) T. D. Rognlien, Pl. Phys. Contr. Fus. 47, A260000 (2005).
- Pigarov et al. (2005) A. Y. Pigarov, S. I. Krasheninnikov, T. K. Soboleva, and T. D. Rognlien, Phys. Plasmas 12, 122508 (2005).
- Rosenberg et al. (2008) M. Rosenberg, R. D. Smirnov, and A. Y. Pigarov, J. Phys. D: Appl. Phys. 41, 015202 (2008).
- Tsytovich et al. (1999) V. N. Tsytovich, S. V. Vladimirov, and S. Benkadda, Phys. Plasmas 6, 2972 (1999).
- de Angelis (2006) U. de Angelis, Phys. Plasmas 13, 012514 (2006).
- Squires and Eaton (1991) K. D. Squires and J. K. Eaton, Phys. Fluids A 3, 1169 (1991).
- Biskamp (2003) D. Biskamp, Magneto-hydrodynamic Turbulence (Cambridge University Press, Cambridge, 2003).
- Rouson et al. (2008) D. W. I. Rouson, S. C. Kassinos, I. Moulitsas, I. E. Sarris, and X. Xu, Phys. Fluids 20, 025101 (2008).
- Shu and Osher (1988) C. Shu and S. Osher, J. Comput. Phys. 77, 439 (1988).
- Homann et al. (2007a) H. Homann, J. Dreher, and R. Grauer, Comput. Phys. Comm. 177, 560 (2007a).
- Eckmann and Ruelle (1985) J. P. Eckmann and D. Ruelle, Rev. Mod. Phys. 57, 617 (1985).
- Bec et al. (2004) J. Bec, K. Gawedzki, and P. Horvai, Phys. Rev. Lett. 92, 224501 (2004).
- Homann et al. (2007b) H. Homann, R. Grauer, A. Busse, and W. Mueller, J. Plasma Phys. 73, 821 (2007b).
- Bec et al. (2007a) J. Bec, L. Biferale, M. Cencini, A. Lanotte, S. Musacchio, and F. Toschi, Phys. Rev. Lett. 98, 84502 (2007a).
- Bec et al. (2007b) J. Bec, M. Cencini, and R. Hillerbrand, Physica D: Nonlinear Phenomena 226, 11 (2007b).
- Bec and Chétrite (2007) J. Bec and R. Chétrite, New J. Phys. 9, 77 (2007).
- Maxey (1987) M. R. Maxey, J. Fluid Mech. 174, 441 (1987).
- Douady et al. (1991) S. Douady, Y. Couder, and M. Brachet, Phys. Rev. Lett. 67, 983 (1991).