Observations of M87 and Hydra A at 90 GHz
Abstract
This paper presents new observations of the AGNs M87 and Hydra A at 90 GHz made with the MUSTANG bolometer array on the Green Bank Telescope at 8.5′′ resolution. A spectral analysis is performed combining this new data and archival VLA data on these objects at longer wavelengths. This analysis can detect variations in spectral index and curvature expected from energy losses in the radiating particles. M87 shows only weak evidence for steepening of the spectrum along the jet suggesting either re-acceleration of the relativistic particles in the jet or insufficient losses to affect the spectrum at 90 GHz. The jets in Hydra A show strong steepening as they move from the nucleus suggesting unbalanced losses of the higher energy relativistic particles. The difference between these two sources may be accounted for by the different lengths over which the jets are observable, 2 kpc for M87 and 45 kpc for Hydra A.
1 Introduction
It has long been recognized that the radiative lifetimes of the synchrotron emitting electrons in AGN jets and extended radio lobes can be shorter than the time to transport them from the nucleus to where they are observed (Felten, 1968; Willis & Strom, 1978). This requires some resupply or re-acceleration of the radiating particles well outside of the nucleus. Observations of synchrotron jets visible into the X-ray (Biretta et al., 1991) make this problem particularly acute. For a synchrotron source of a given magnetic field strength, the emission observed at a given frequency comes largely from electrons of a given energy (Pacholczyk, 1970). Thus, the spectral shape of the emission reflects the shape of the electron energy spectrum. If the predominant energy loss mechanism of these electrons is radiative (synchrotron and inverse Compton scattering) then the losses are proportional to the energy squared. This depletes the number of electrons above a corresponding energy resulting in a steepening of the spectrum by 0.5 above a break frequency corresponding to the highest energy surviving particles (Pacholczyk, 1970). If the radiating electrons age in a constant magnetic field, the break frequency will move to progressively lower frequencies.
Numerous attempts have been made to use this spectral signature to determine the radiative ages of the particles, i.e. the time since they were last accelerated to relativistic energies (Carilli et al., 1991; Blundell & Alexander, 1994; Feretti et al., 1998; Murgia et al., 1999). As was pointed out by Rudnick (2002), this procedure has a number of potential difficulties. Most serious is that the relationship of the frequency of the spectral break with the cutoff in the electron energy spectrum depends on a large power of the poorly known magnetic field strength; Pacholczyk (1970) gives the relation among the break frequency(), the magnetic field() and time() as:
Thus a lower magnetic field results in higher break frequencies. While using spectra to determine particles ages is suspect, the steepening of the spectrum along an AGN jet, especially at higher frequencies shows the relative effects of particle losses and gains.
Most of the sources in which the signatures of spectral aging have searched for have been observed over a relatively limited frequency range. Since the effects of the electron energy losses are more pronounced at higher frequencies, observations at high frequencies are valuable for evaluating the relative effects of particle losses against any re-acceleration or resupply.
In order to measure the variation of the observed spectrum along an AGN jet, both good resolution and surface brightness sensitivity over a wide range of frequencies is needed. Observations with mm interferometers have the resolution but generally not the surface brightness sensitivity for comparisons with lower frequency observations. Since single dishes explicitly sample all spatial frequencies out to the dish diameter, they have good surface brightness sensitivity. The large size of the Green Bank Telescope (GBT) gives it good resolution as well as surface brightness sensitivity.
In this paper we report on the observations of M87 and Hydra A at 90 GHz using the MUSTANG camera on 100 m the Green Bank Telescope (Jewell & Prestage, 2004) which gives 8.5′′ resolution and good surface brightness sensitivity. These results are compared with lower frequency observations at comparable resolutions using archival VLA data. The results presented give the continuum spectra from 0.3 to 90 GHz; this greatly increases the range of frequencies over which this analysis can be performed.
2 Observations
The radio sources in the AGNs M87 and Hydra A were observed on 2008 March 13 using the MUSTANG 3mm bolometer camera (Dicker et al., 2008) on the Green Bank Telescope (GBT). The MUSTANG detector array consists of 64 TES bolometers viewing the sky through a filter with bandpass of 81 to 99 GHz. Observations were made in the “On–The–Fly” (OTF) mode using a variety of scanning patterns. A cold field stop restricts the portion of the GBT illuminated to 90 m. The bolometer outputs are recorded at 1 kHz but the data streams are averaged to 20 Hz for analysis. Focus and pointing calibration used J1256-0547 for M87 and J0825+0309 for Hydra A. Flux density calibration was based on observations of planets made over the course of the season’s observations.
3 MUSTANG Data Analysis
Data analysis was carried out in the Obit package 111http://www.cv.nrao.edu/bcotton/Obit.html (Cotton, 2008). Details of the data analysis will be given in a future publication but a short description follows.
The principle difficulty in imaging the data from the MUSTANG array is separating the portion of the signal in the time-stream due to the astronomical object of interest and the “background” portion due to other sources, especially the atmosphere and the instrument itself. Rapid scanning of the telescope over the target field helps separate the signals in the time domain. The redundancy resulting from the multiple observations of a given pointing along different trajectories also helps separate the time variable background signals from the constant astronomical signals.
The MUSTANG cryogenic system uses a pulse tube cooler with a frequency of 1.4 Hz which imposes a strong modulation on the bolometer outputs. Prior to subsequent operations, the amplitude and phase of the resultant signal were fitted and removed from the data. Amplitude calibration used the response to a stable calibration signal injected into all bolometers whose strength was calibrated against observations of several planets. Data weights were derived for each bolometer time-stream from the RMS fluctuations during blank sky scans.
3.1 Imaging
Imaging used the general “OTF” technique of Mangum, Emerson, & Greisen (2007) in which the individual detector samples were multiplied by a continuous “griding” function and then re-sampled on a regular grid with spacings. For each grid cell, the weighted sum of the data times the griding function and the sum of the weights times the griding function were accumulated and the image value at that pixel was the set equal to the ratio of the two. The griding function used was an exponential sinc which helps suppress spatial frequencies larger than those sampled by the dish and results in a resolution of 8.5′′. This process will produce a “Dirty Image”, i.e., an image of the sky convolved with the telescope beam response.
3.2 Background Estimation
An iterative scheme of estimating the target brightness distribution, subtracting a model from the time-stream data and (re)estimating the backgrounds was employed. In each iteration the shortest timescale used to estimate backgrounds was reduced.
For the initial estimation of the backgrounds an empty sky was assumed and backgrounds were estimated for timescales longer than 40 seconds. This is longer than the crossing times of the target sources. Following the initial background estimation, and for subsequent iterations, the background subtracted time-stream data were imaged as outlined in Section 3.1. A deconvolved image (see § 3.4) was used to generate a sky model which was then used with the assumed telescope point spread function (PSF) to generate a residual time-stream data set from the initial calibrated time-streams. A refined background estimation was obtained from a low pass filtering of the time-stream residuals. This refined background estimation was in turn used to derive a refined sky model. Multiple iterations of this process were used, gradually reducing the shortest time scale in the background estimations to 1 second. Most of the backgrounds are common to all detectors.
3.3 GBT Imaging Quality at 90 GHz
At the epoch of these observations, uncorrected deformations of the GBT surface caused a degradation of the telescope performance. In particular, large scale errors in the surface result in an elevated error beam in the neighborhood of the main beam. While the near–in error beam is time variable in detail, general features persisted over time.
If the point spread function (PSF) of the instrument is know and stable, it is relatively straightforward to deconvolve the dirty image and replace it with one in which the psf was well behaved. The best estimate of the effective PSF of the telescope was obtained from the averaged image of calibrator observations made during the 2008 Winter observing session. A “Dirty beam” for the telescope was derived by an azimuthal average of the average calibrator beam images below the half power of the beam and an 8.5′′ Gaussian above the half power point. This beam has an elevated error pattern near the main beam and when used in a deconvolution, removes the scattered power from around regions of bright emission. Since these data were collected, a method of applying online corrections to the active surface derived from out-of-focus beammaps has significantly reduced the scattered-power problem.
3.4 Deconvolution
The dirty image and dirty beam described in the previous sections were deconvolved using a Högbom CLEAN (Hogbom, 2003). This reduces the dirty image to a set of delta functions which can be convolved by the GBT instrumental PSF to produce a sky model or convolved with a Gaussian and restored to the CLEAN residuals to get the final CLEAN image. These CLEAN images restored with a 8.5′′ FWHM Gaussian were used in subsequent analysis.
One consequence of the way in which the dirty images were made is that noise in the image pixels does not strictly have the same covariance as the dirty beam. This allows “out of band” noise which does not deconvolve and causes the CLEAN to “get stuck”, alternately digging and filling holes. A filtering of the dirty image to remove all power corresponding to spatial frequencies on smaller scales than allowed by the resolution of the instrument greatly reduces this problem.


4 VLA Data at Longer Wavelengths
In order to make a proper spectral analysis, images at comparable resolution are needed over a range of frequencies. Fortunately, these bright radio galaxies have been well studied using the VLA. Suitable resolution data were obtained from the VLA archives and calibrated and imaged in the standard fashion using Obit. The imaging was initially at 8′′ resolution using a combination of uv ranges, tapering, and the Briggs robust parameter (Briggs, 1995). Subsequently, the images were convolved to 8.5′′ for comparison with the GBT data.
5 Spectral Decomposition
The GBT and VLA images were all aligned to the same pixel grid and two sets of spectral forms were fitted in each pixel by standard least squares techniques. These forms were a continiously curved spectrum with polynomials in log(s) vs log() using up to three terms; 1) the flux density at a reference frequency, 2) the spectral index and 3) spectral curvature at the same reference frequency. The other form was a broken power law where the spectral index at frequencies above the break steepened by 0.5. All fitting used a reference frequency of 5 GHz. For each source, a set of single point spectra were derived as well as images of the spectral index, spectral curvature and break frequency.

| Posn. | Flux | Spectral | Curvature | Break Freq. | ||
|---|---|---|---|---|---|---|
| density (Jy) | index | GHz | ||||
| A | 3.9 0.2 | -0.62 0.03 | -0.05 0.01 | 1.5 | 3.3 1.2 | 2.2 |
| B | 6.1 0.3 | -0.56 0.03 | -0.05 0.01 | 1.8 | 3.0 0.2 | 2.2 |
| C | 4.9 0.2 | -0.29 0.03 | 0.03 0.01 | 1.4 | 3.9 0.8 | 13.2 |
| D | 2.6 0.1 | -0.74 0.02 | -0.04 0.01 | 0.3 | 3.9 0.1 | 3.3 |
| E | 4.1 0.2 | -0.67 0.03 | -0.04 0.01 | 0.7 | 3.4 0.1 | 3.5 |
| F | 2.7 0.1 | -0.65 0.03 | -0.05 0.01 | 1.3 | 3.3 0.1 | 2.0 |


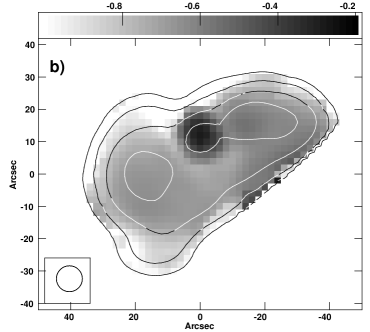
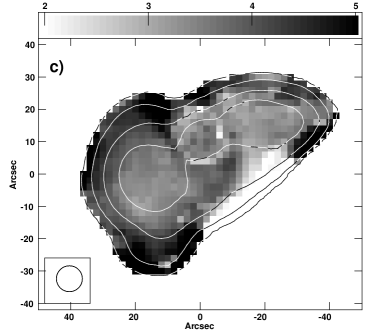
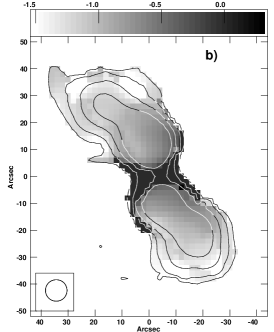
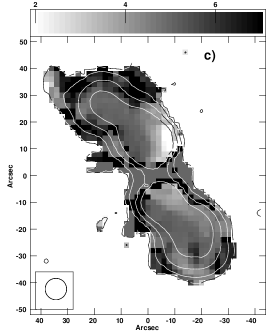
Plots of the derived image and spectral parameters are shown in Figures 3 for M87 and 5 for Hydra A. Letters on Figures 3a and 5a give the locations where individual spectra were determined. These individual point spectra are in Figures 4 and 6 for M87 and Hydra A respectively. Both continuously curved spectral fits and broken power laws are shown. Corresponding fitted parameters are given in Tables 1 and 2. These tables give the flux density in Jy, spectral index and curvature terms (when fitted), per degree of freedom of the curved spectrum fit, the break frequency in GHz from the broken power law fit and for the broken power law fits at the locations indicated in Figures 4 and 6.

| Posn. | Flux | Spectral | Curvature | Break Freq. | ||
|---|---|---|---|---|---|---|
| density (Jy) | index | GHz | ||||
| A | 0.4 0.03 | -1.20 0.08 | -0.11 0.03 | 4.7 | 6.4 0.8 | 5.4 |
| B | 3.2 0.22 | -0.80 0.03 | -0.07 0.01 | 0.1 | 4.9 0.1 | 0.2 |
| C | 0.4 0.05 | -0.47 0.07 | 1.1 | 8.2 3.2 | 0.4 | |
| D | 1.6 0.11 | -0.71 0.03 | -0.04 0.01 | 0.6 | 4.1 0.1 | 2.7 |
| E | 0.8 0.05 | -0.83 0.03 | 3.0 | 8.3 4.4 | 1.04 |


6 Discussion
The presence of optical and X-ray emission from the inner jet in M87 (Biretta et al., 1991) necessitates a resupply of energetic particles in at least this portion of the jet. The data presented above can probe the possibility of further particle resupply in the portions of the jet only detected in radio emission.
The radiative “age” of a source with break frequency of is given by Carilli et al. (1991) as
where B is in micro-gauss, in GHz and t in Myr. Thus, the electrons radiating in a 10 micro-gauss field giving rise to 90 GHz radiation will start to be seriously depleted in about 5 Myr.
6.1 M87
One of the earliest cases recognized to require particle acceleration outside of the nucleus was the optical jet in M87 (Felten, 1968). M87 is the dominant elliptical galaxy in the center of the nearby Virgo cluster. Previously published radio observations include Owen et al. (1980), Biretta et al. (1983) and Owen et al. (2000). We assume a distance to M87 of 16 Mpc which results in a linear projected size of 78 pc per arc-second. The jets are thus visible out to beyond 2 kpc from the nucleus in Figure 3.
M87 is an asymmetric two-sided FRI jet source in which both jets bend into the line of sight limiting the distance from the nucleus to which they can be observed. Figure 3 contains the jets and inner lobes embedded in the much larger region of emission shown by Owen et al. (2000). The jets on either side of the nucleus (position C) show little variation in spectral index and curvature. The approaching jet (positions A, B) have somewhat flatter spectra than in the receding jet (positions, D, E, F). The fitted break frequencies shown in Figures 3 and 4 and Table 1 show minimal variation along the visible portion of the jets. Furthermore, the continiously curved spectral model gives consistently better fits, in terms of the per degree of freedom than the broken power law spectra.
Magnetic field estimates based on minimum energy arguments and higher resolution VLA images given by Hines et al. (1989) for features in the regions probed here, range from 50 to 100 micro-gauss. This leads to estimates of radiative lifetimes of the 90 GHz emitting electrons in the range 150 to 500 kyr. We note that this is easily within the possible transport times for the radiating particles from the nucleus.
The variation in spectral index and curvature across the source shown in Figures 3 and 4 and Table 1 show very weak steepening with distance from the nucleus. The curved nature of the spectra do indicate high energy losses to an assumed initial power law electron energy spectrum. The better fit of the curved spectrum than a simple broken power law model suggests a complex particle loss/resupply history rather than a simple, radiatively evolving relativistic particle population. Since the observable portion of the jet is relatively short, the lack of evidence for electron aging could be due to either continued particle acceleration along the jet or merely insufficient time for the particle populations to evolve to the point they could be detectable in our data.
The asymmetry of the spectral index is likely due simply to the emission on the counterjet side being stongly contaminated by the steeper spectrum “cocoon”. The jet, being Doppler boosted, dominates the cocoon on its side.
6.2 Hydra A
The radio structure of Hydra A has been studied by Taylor et al. (1990) Dwarakanath et al. (1995) and Lane et al. (2004); extended regions of very steep spectrum emission are seen to the north and south of the emission in Figure 5. This source is a symmetric two-sided FRI radio galaxy with a weak, strongly self absorbed core (position C). Hydra A is at a redshift of z=0.054 (Dwarakanath et al., 1995) giving a projected linear size of 1.1 kpc per arc-second; the source is visible in Figures 2 and 5 to approximately 45 kpc from the nucleus.
Magnetic field estimates of Taylor et al. (1990) from minimum pressure arguments range from about 10 to 70 micro-gauss in various features giving estimated radiative lifetimes of the 90 GHz emitting electrons in the range 0.3 to 5 Myr.
In this galaxy, both the spectral index and curvature increase dramatically along the visible portion of the jets, especially in the north. This suggests that particle acceleration slows or stops fairly early in the jet and that the effects of particle aging are visible in the outer parts of the source. The magnetic field estimates by Taylor et al. (1990) suggest weaker field strengths in the northern lobe. By Eq. 1, weaker fields should reduce the effect of electron aging (however, see Blundell & Alexander, 1994). In the northern part of the source (locations A and B) the curved and broken spectra are comparable representations of the observed spectra whereas in the south (location E), the broken power law spectrum more nearly represents the high frequency measurements. However, in spite of strong variations in spectral index, there does not appear to be a strong variation in the break frequency as represented in Figures 6 and 6 and Table 2; if anything, the break frequency increases slightly with distance from the nucleus. This is more suggestive of a decreasing magnetic field than an aging electron population. The apparent break in the spectrum in the south may be the result of synchrotron losses in the inner regions of the jet where the magnetic field is expected to be stronger. This is inconsistent with a simple intrepretation of the steepening along the jet being due to electron losses; the fitted break frequency may not be meaningful except possibly in the south where the broken power law is a better representation of the spectrum than the curved model. The curved spectrum in the north suggests a complex electron history.
The observable portion of the jet in Hydra A is substantially longer than in M87. The longer time required to transport the radiating particles to the outer regions allows radiative losses to accumulate. This may be responsible for the apparent break in the spectrum in the south.
7 Conclusions
We present new 90 GHz observations of the FRI AGN radio sources M87 and Hydra A at 8.5′′ resolution and compare the results with lower frequency archival VLA results at comparable resolution. A spectral analysis is performed to look for evidence of particle aging or re-acceleration. M87 shows only weak variation out to 2 kpc but Hydra shows strong steepening and bending over regions extending to 45 kpc. This difference may be the result of the different size scales observed in the two sources. In M87, the length of jet observed may be too short for either the particle resupply to damp out or for the radiating particles to age to the point the the effects are visible in the observed spectral region. A continiously curved spectrum gives consistently better fits than a broken power law spectrum. This is more indicative of a complex history of the electron energetics than a simple aging of a population of radiating particles.
In Hydra A there is clear evidence of a depletion of higher energy electrons, the loss mechanisms are winning over the resupply mechanisms. Even in the case of Hydra A, there is little evidence for a variation in the break frequency with distance from the nucleus. Only in the southernmost observed portion on the jet is there credible evidence of a break in the spectrum. The generally curved nature of the observed spectra suggest complex histories of particle loss and resupply.
Acknowledgment
The National Radio Astronomy Observatory is operated by Associated Universities, Inc. under cooperative agreement with the National Science Foundation. This work was supported by a grant (AST-0607654) from the National Science Foundation.
References
- Blundell & Alexander (1994) Blundell, K. M. and Alexander, P. 1994, MNRAS, 267, 241–246
- Biretta et al. (1983) Biretta, J. A., Owen, F. N. and Hardee, P. E. 1983, ApJ, 274, L27–L30
- Biretta et al. (1991) Biretta, J. A., Stern, C. P. and Harris, D. E. 1991, AJ, 101, 1632-1646.
- Briggs (1995) Briggs, D. S., 1995 Ph.D. Thesis, New Mexico Institute of Mining and Technology
- Carilli et al. (1991) Carilli, C. L., Perley, R. A., Dreher, J. W. and Leahy, J. P. 1991, ApJ, 383, 554–573
- Cotton (2008) Cotton, W. D. 2008, PASP, 120, 439–448
- Dicker et al. (2008) Dicker, S. R., Korngut, P. M., Mason, B. S., Ade, P. A. R., Aguirre, J., Ames, T. J., Benford, D. J., Chen, T. C., Chervenak, J. A., Cotton, W. D., Devlin, M. J., Figueroa-Feliciano, E., Irwin, K. D., Maher, S., Mello, M., Moseley, S. H., Tally, D. J., Tucker, C. and White, S. D. 2008, SPIE, 7020, 4
- Dwarakanath et al. (1995) Dwarakanath, K. S., Owen, F. N. and van Gorkom, J. H. 1995, ApJ, 442, L1–L4
- Felten (1968) Felten, J. E., 1968, ApJ, 151, 861–879
- Feretti et al. (1998) Feretti, L., Giovannini, G., Klein, U., Mack, K.-H., Sijbring, L. G. and Zech, G. 1998, A&A, 331, 475–484
- Hines et al. (1989) Hines, D. C., Eilek, J. A. and Owen, F. N. 1989, ApJ, 347, 713-726
- Hogbom (2003) Högbom, J. A. 2003, Astronomical Society of the Pacific Conference Series, Zensus, J. A. and Cohen, M. H. and Ros, E., eds., 300, 17
- Jewell & Prestage (2004) Jewell, P. R. and Prestage, R. M., 2004, SPIE, 4589, 312-323
- Lane et al. (2004) Lane, W. M., Clarke, T. E., Taylor, G. B., Perley, R. A., and Kassim, N. E., 2004, AJ127, 48–52.
- Mangum, Emerson, & Greisen (2007) Mangum, J. G., Emerson, D. T. and Greisen, E. W. 2007, A&A, 474, 679-687
- Murgia et al. (1999) Murgia, M., Fanti, C., Fanti, R., Gregorini, L., Klein, U., Mack, K.-H. and Vigotti, M. 1999, A&A, 345, 769–777
- Owen et al. (1980) Owen, F. N., Hardee, P. E. and Bignell, R. C. 1980, apjl, 239, L11–L15
- Owen et al. (2000) Owen, F. N., Eilek, J. A. and Kassim, N. E. 2000, ApJ, 543, 611–619
- Pacholczyk (1970) Pacholczyk, A. G. 1970, Radio Astrophysics(San Francisco: Freeman)
- Rudnick (2002) Rudnick, L., 2002, New Astronomy Review, 46, 95–100
- Taylor et al. (1990) Taylor, G. B., Perley, R. A., Inoue, M., Kato, T., Tabara, H. and Aizu, K. 1990, ApJ360, 41-54
- Willis & Strom (1978) Willis, A. G. and Strom, R. G., 1978, A&A, 62, 375–392