The Physics of Protoplanetesimal Dust Agglomerates. III. Compaction in Multiple Collisions
Abstract
To study the evolution of protoplanetary dust aggregates, we performed experiments with up to 2600 collisions between single, highly-porous dust aggregates and a solid plate. The dust aggregates consisted of spherical SiO2 grains with 1.5 m diameter and had an initial volume filling factor (the volume fraction of material) of . The aggregates were put onto a vibrating baseplate and, thus, performed multiple collisions with the plate at a mean velocity of 0.2 m s-1. The dust aggregates were observed by a high-speed camera to measure their size which apparently decreased over time as a measure for their compaction. After 1000 collisions the volume filling factor was increased by a factor of two, while after collisions it converged to an equilibrium of . In few experiments the aggregate fragmented, although the collision velocity was well below the canonical fragmentation threshold of m s-1. The compaction of the aggregate has an influence on the surface-to-mass ratio and thereby the dynamic behavior and relative velocities of dust aggregates in the protoplanetary nebula. Moreover, macroscopic material parameters, namely the tensile strength, shear strength, and compressive strength, are altered by the compaction of the aggregates, which has an influence on their further collisional behavior. The occurrence of fragmentation requires a reassessment of the fragmentation threshold velocity.
1 Introduction
The formation of planets in the accretion disks around young stars starts with the growth of (sub-)micrometer-sized dust grains. Embedded in the thin gas of the disk, the dust grains collide due to a Brownian relative motion and inevitably stick at the small collision velocities (Blum et al., , 2000; Krause and Blum, , 2004). By this mechanism, dust grains can grow to fractal aggregates of before systematic drift significantly increases the collision velocities (Weidenschilling and Cuzzi, , 1993). Numerical simulations as well as laboratory experiments have shown that for these increasing collision velocities, aggregates are restructured and grow to non-fractal but still very porous bodies (Dominik and Tielens, , 1997; Blum and Wurm, , 2000) so that growth can continue to larger sizes.
Once the aggregation has reached millimeter sizes, further growth due to sticking collisions between similar-sized dust aggregates slows down. Different experiments have shown that collisions of mm-sized aggregates result in bouncing or fragmentation: Blum and Münch, (1993) performed collision experiments with ZrSiO4 dust aggregates with a volume filling factor (the fraction of volume filled with material) of . For velocities exceeding m s-1 they found fragmentation as the dominant process, whereas for smaller velocities the aggregates bounced. Heißelmann et al., (2007) performed similar experiments with highly porous aggregates () of 1 – 5 mm diameter, which collided with a dusty target at a velocity of 0.2 m s-1 or with each other at 0.4 m s-1. In both types of collisions the results were dominated by bouncing. Langkowski et al., (2008) [hereafter paper II], performed impact experiments of the same highly porous dust aggregates of 0.2 to 3 mm diameter and different materials onto equally porous targets of 25 mm diameter. For intermediate velocities (0.5 to 2.5 m s-1) and projectile sizes (0.5 to 2 mm) they found bouncing of the aggregate which was even more likely if the target was ”molded” to a non-flat surface (see Fig. 1c in paper II). Smaller projectiles and lower velocities led to sticking of the dust aggregate on the target surface, whereas larger projectiles and higher velocities resulted in a deep penetration of the projectiles with no possibility for escape (paper II). All those experiments were performed without the influence of gravity (free fall, drop tower or parabolic flight) and in all experiments the coefficient of restitution (the velocity after the impact divided by the velocity before impact) was rather small ().
Many experiments of paper II and Heißelmann et al., (2007) were performed with the same sample material. While in paper II different compositions were used (SiO2 (monodisperse spheres), irregular SiO2, and irregular diamond), Heißelmann et al., (2007) focussed on porous aggregates of 1.5 m diameter SiO2 monospheres. They were formed by the random ballistic deposition mechanism introduced by Blum and Schräpler, (2004) and Blum et al., (2006) [hereafter paper I], had a diameter of 25 mm, and a volume filling factor of . The dust samples could be cut or broken into mm-sized aggregates to perform the collision experiments. Although pure silica is not the most abundant material in protoplanetary nebulae, paper I and II showed that the material properties of the dust (composition, size distribution, and shape) do not significantly alter the experimental outcome. Therefore, we regard the material representative according to their mechanical properties of aggregates made of a broad collection of refractory grains and use the same material in the experiments presented below.
The motivation for this work is the explanation of the coefficient of restitution in the collisions of the described mm-sized SiO2 aggregates, which is as low as in aggregate-aggregate as well as in aggregate-target collisions (Heißelmann et al., , 2007). This means that only a few percent of the translational energy are conserved, whereas the bulk of energy is dissipated in an unknown manner. Although the aggregates of Heißelmann et al., (2007) do not show apparent deformation after the collisions, the obvious assumption is that the energy is consumed by compression. In a microscopic view, compression results from the rolling, breaking and restructuring of inter-grain contacts which dissipates energy (e.g. Paszun and Dominik, , 2008). In a macroscopic view, compression can be described by a compressive strength curve (Blum and Schräpler, , 2004; Güttler et al., , 2009, paper I). The dissipated energy in this context is , where is the decrease of a volume inside the dust aggregate with internal pressure .
In this work, we describe an experiment, in which a dust aggregate with mm diameter is placed on a vibrating baseplate and is thus forced to perform multiple collisions with this plate. Although this is not a zero gravity experiment, gravity is not important for the individual collisions as Heißelmann et al., (2007) have shown that even under microgravity conditions sticking never occurs at the relevant velocities of m s-1 and that the collision time is too short for substantial gravitational influence (see the image sequence in Figs. 4 and 5 of Heißelmann et al., (2007)) . The velocities are the same as those between aggregate and target in the experiments of Heißelmann et al., (2007). Performing multiple collisions, the cumulative compaction is larger than in a single collision and can, thus, be assessed.
2 Experimental Setup
As a starting material for a mm-sized, highly porous protoplanetary dust aggregate we chose the well-defined dust aggregates introduced and characterized by Blum and Schräpler, (2004). They consist of 1.5 m diameter monodisperse SiO2 spheres, possess a volume filling factor of and were formed by random ballistic deposition (Blum and Schräpler, , 2004). From these 25 mm aggregates we cut out cubes of 2.5 mm diameter with a compaction of the aggregate rim to a maximum of (Heißelmann et al., , 2007).
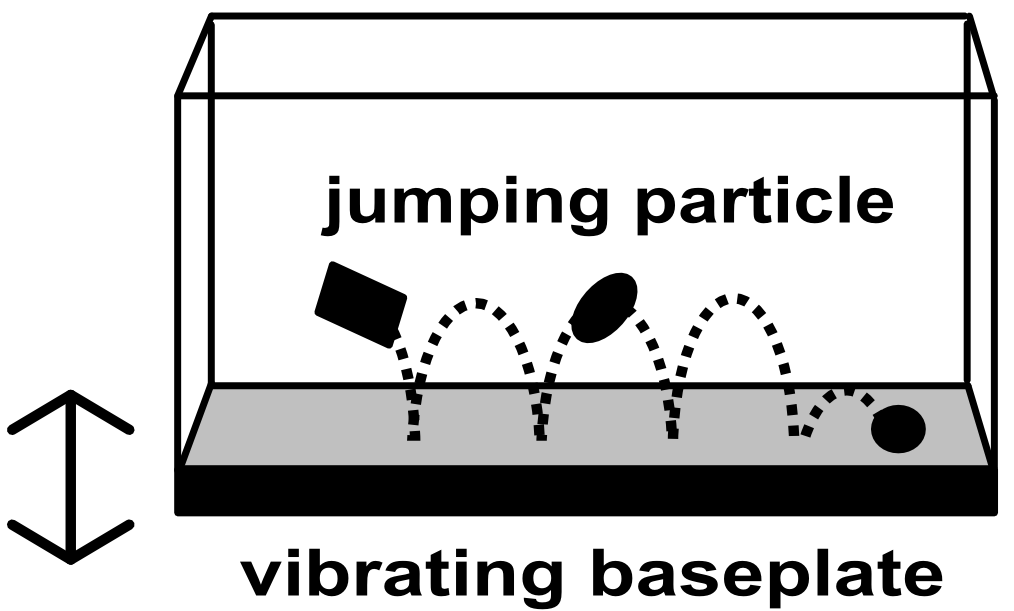
Each small aggregate was weighed (mass ) and put into a box with plexiglass walls and an aluminum baseplate of mm2 size (Fig. 1). The aggregate was observed with a high-speed camera at a frame rate of 380 frames per second in back-light illumination while the box was vibrated in the vertical direction at a frequency of 100 Hz with a peak-to-peak amplitude of 0.4 mm for different durations (10 to 80 s). This led to a jumping motion of the aggregate and 200 to 2600 bouncing collisions, after which the aggregate (final mass ) and the eroded material in the box (total mass of the debris ) were again weighed.
In each image, the cross-sectional area and the position of the aggregate were measured. The position measurements yield the number of collisions, which are underestimated by 20 %, because collisions near the edge of the box were not illuminated well. From the maximum height between two collisions the aggregate’s velocity at the time of the collision can be determined assuming a free fall motion of the aggregate. Although the experiments were performed in air, the frictional effect of the ambient gas is negligible, as the maximum friction force N is much smaller than the projectile’s weight N. Here , , , and are a typical aggregate mass ( mg), the corresponding aggregate size ( mm), an average aggregate velocity ( m s-1), and the viscosity of air (); is the gravitational acceleration.
As the velocity of the baseplate is unknown for the exact time of collision, a statistical collision velocity distribution is presented in section 3. The imaged cross-sectional area of the aggregate was converted into a volume by assuming a sphere which is a coarse approximation at the onset of the experiments but a good approximation after 150 collisions (Fig. 2). A total of 18 individual bouncing experiments was performed (Table 1).
| experiment | initial mass | duration | number of | eroded mass | mean collision | resulting filling |
|---|---|---|---|---|---|---|
| [] | [s] | collisions | [% of ] | velocity [] | factor | |
| 4.96 | 71 | 2400 | 20 | 0.50 | ||
| 2 | 3.62 | 33 | 1200 | 9 | 0.32 | |
| 3 | 3.90 | 43 | 1400 | 0 | 0.38 | |
| 4 | 2.68 | 30 | 1050 | 34 | 0.25 | |
| 5 | 2.64 | 13 | 550 | 9 | 0.28 | |
| 6 | 2.88 | 14 | 250 | 12 | 0.21 | |
| 7 | 2.10 | 10 | 200 | 24 | 0.16 | |
| 8 | 2.34 | 15 | 500 | -9 | 0.24 | |
| 9 | 1.92 | 14 | 550 | 23 | 0.21 | |
| 10 | 3.46 | 12 | 300 | 10 | 0.21 | |
| 11 | 4.46 | 46 | 1750 | 6 | 0.39 | |
| 12 | 4.40 | 57 | 2150 | 13 | 0.35 | |
| 13 | 4.04 | 43 | 1650 | 8 | 0.32 | |
| 14 | 4.60 | 77 | 2600 | 19 | 0.32 | |
| 5.86 | 47 | 1700 | 14 | 0.34 | ||
| 3.86 | 17 | 500 | 7 | 0.23 | ||
| 4.44 | 53 | 2300 | 10 | 0.32 | ||
| 18 | 4.88 | 44 | 1600 | 8 | 0.34 |
3 Results
In this section, we present the calculation of the distribution of collision velocities. We will then quantify the compaction of the dust aggregates and give an analytical approximation for practical use. Moreover, we will present further consequences of the structural change of the aggregates, namely the fragmentation of a dust aggregate at small velocities and the development of the coefficient of restitution.
3.1 Collision Velocities
The maximum height of the dust aggregate between two collisions can be measured from the image with the highest aggregate position and it determines the aggregate’s velocity at the time of impact, . As the impact time is only known with an error of 2.6 ms , as the maximum plate velocity of 0.13 m s-1 is in the same range as the collision velocity, and as the baseplate velocity rapidly changes, we make a statistical approach to calculate the distribution of collision velocities. The probability of a given plate velocity is given as
| (1) |
where Hz is the oscillation frequency of the plate and determines a velocity interval around . is the inverse velocity cosine function
| (2) |
where mm is the amplitude of the plate and is the angular frequency. For an aggregate with velocity plate velocities do not lead to a collision while the maximum plate velocity is the likeliest. Thus, the velocity distribution of the plate (Eq. 1) is convolved with a linear collision probability, cropped for and shifted by . This is the velocity distribution of a single collision. The same procedure is performed for each collision and all normalized distributions summed up yield the overall velocity distribution for one experiment.
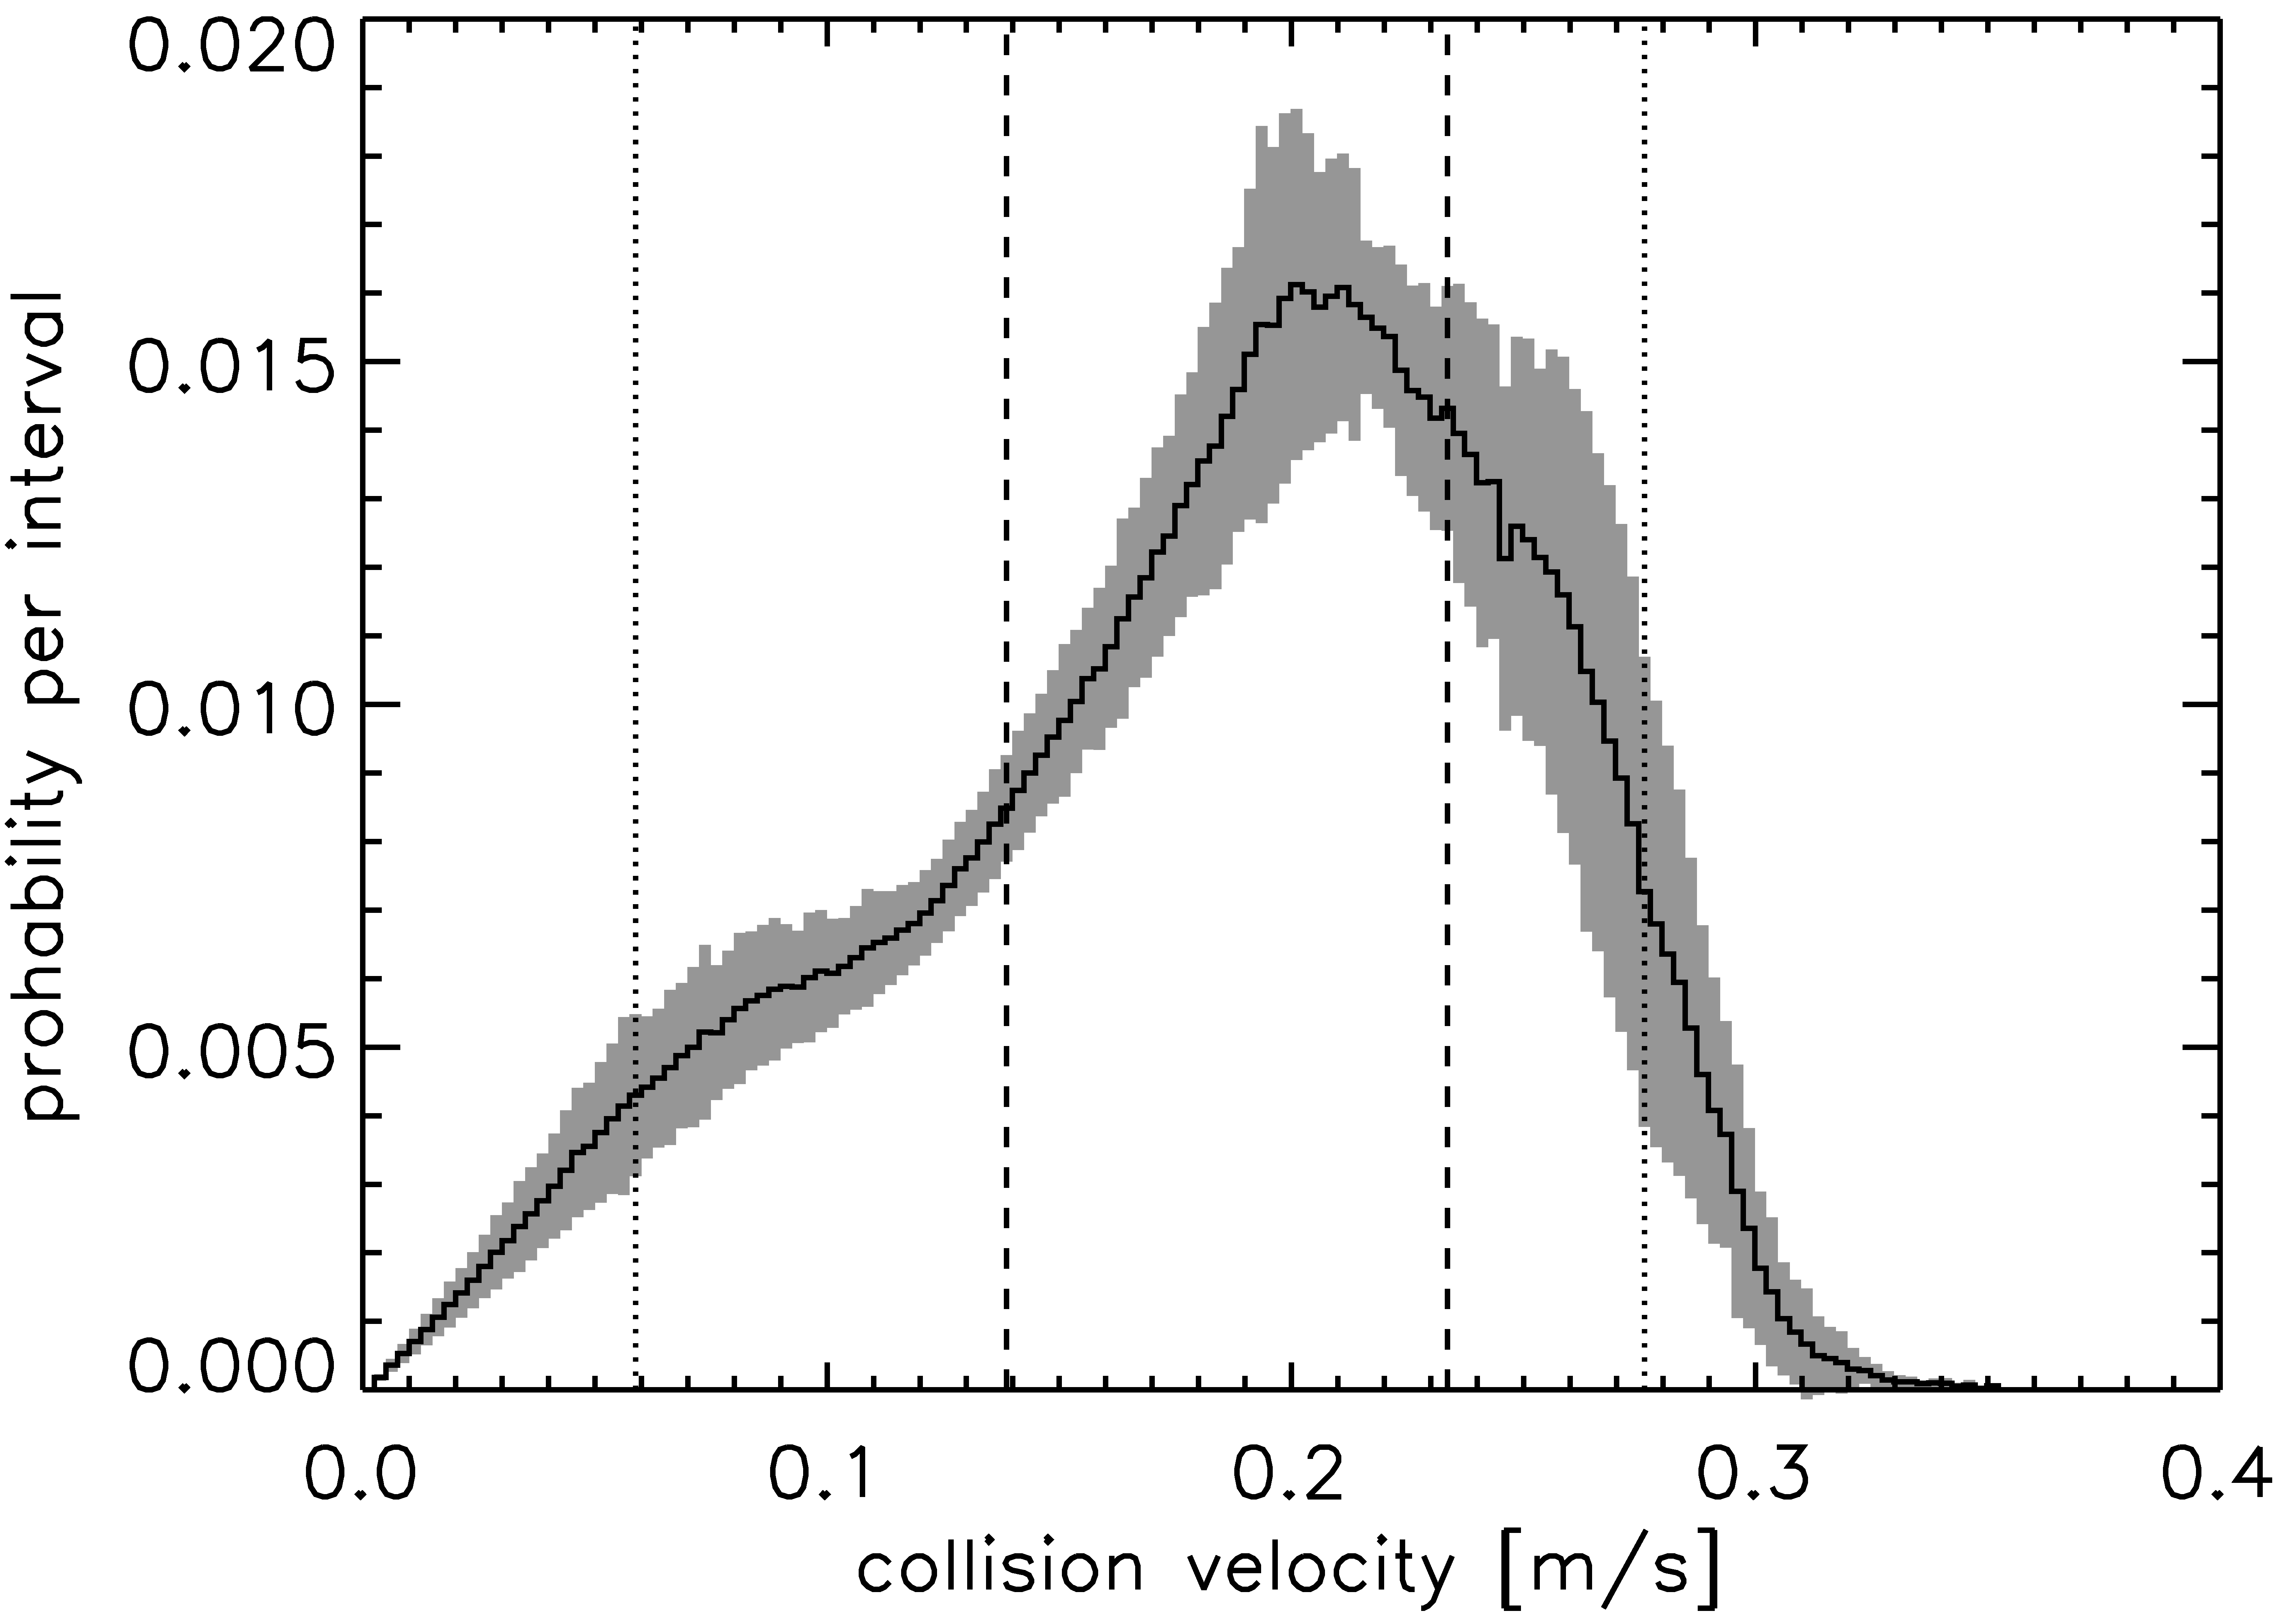
Figure 3 shows the mean of the velocity distributions of all experiments (solid line) with the standard deviation (grey shaded area). All velocities are smaller than 0.35 m s-1, the median velocity is 0.19 m s-1, while 50 % of all collisions are within 0.14 and 0.23 m s-1. The velocity range for the individual experiments given in Table 1 is the 50 % range from the individual distributions.
3.2 Compaction of the Dust Aggregate
The prime objective of the experiments is to measure the increase of the averaged volume filling factor of the dust aggregate after collisions, i.e.
| (3) |
Here, is the initial mass of the aggregate, and is the initial volume calculated from by assuming an initial volume filling factor of (Blum and Schräpler, , 2004). The volume was calculated from the projectile’s cross section by assuming a sphere, thus, . The mass slightly decreases due to erosion at the target. However, experiments with different durations did not show any change in the relative erosion (see Table 1) and most of the eroded fragments were sticking to the baseplate at the place of the first few collisions. Thus, assuming that the erosion took place in the very first collisions and was caused by the preparation of the sample, we take .
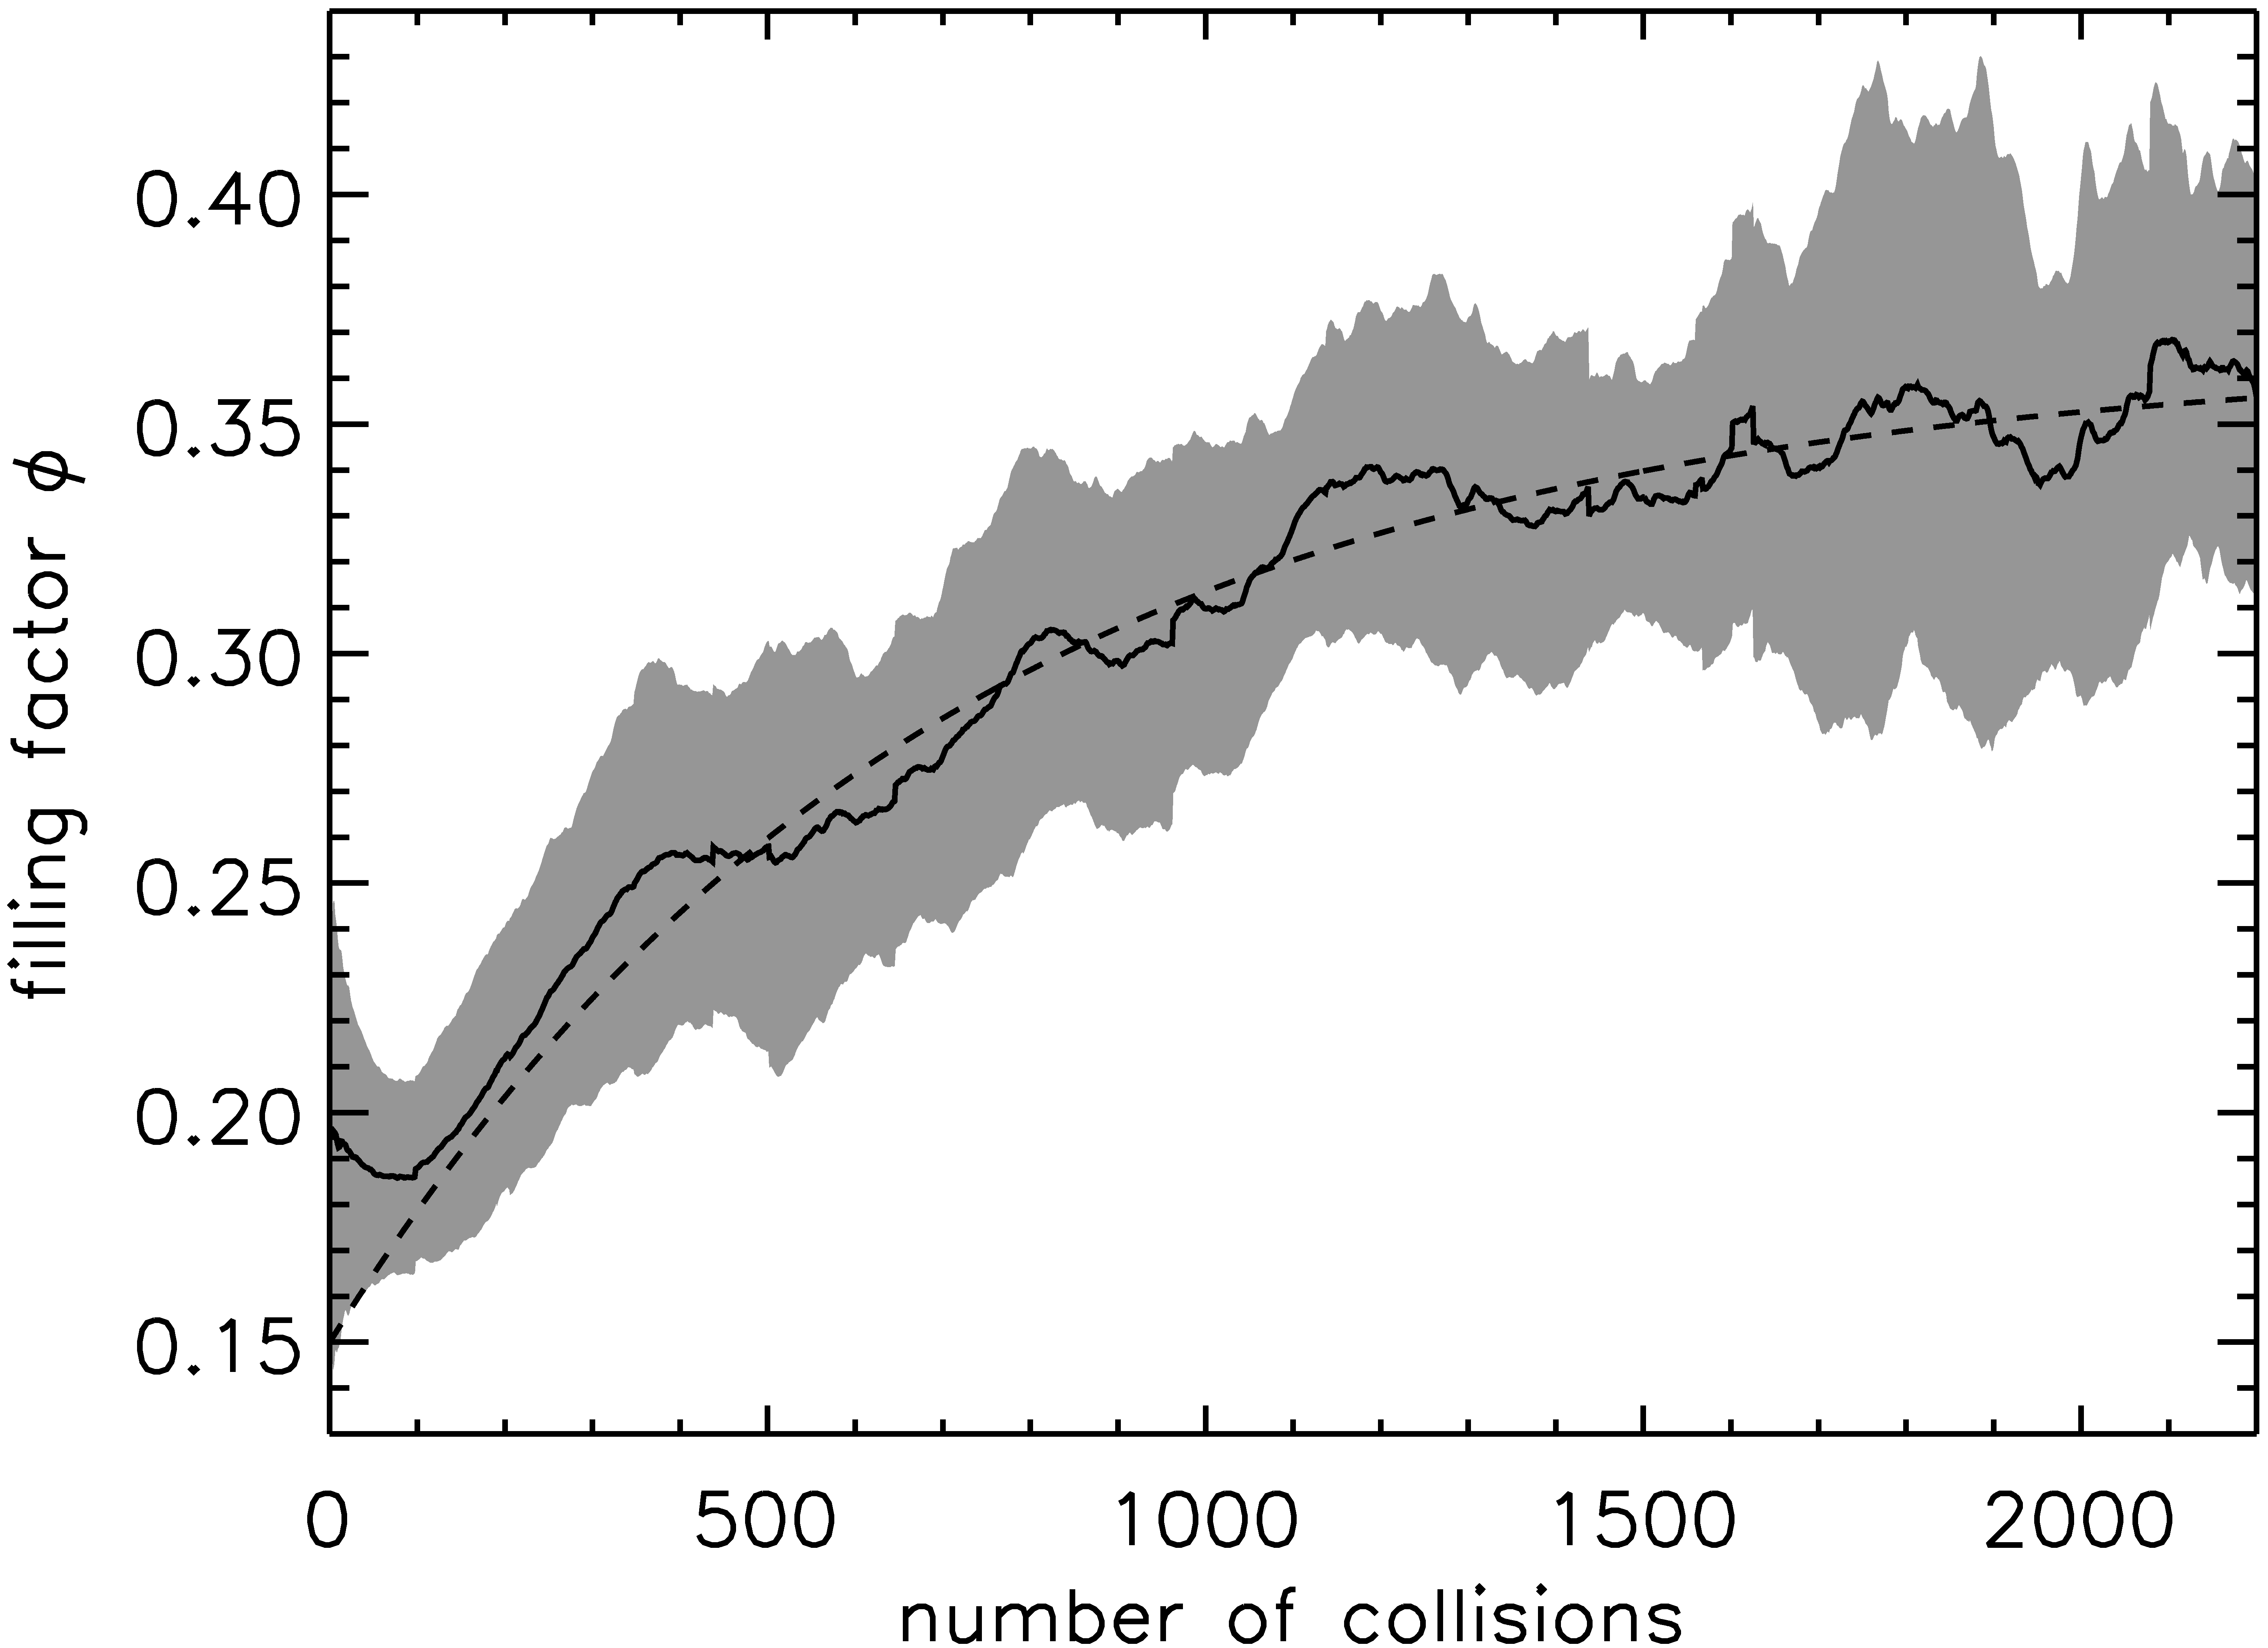
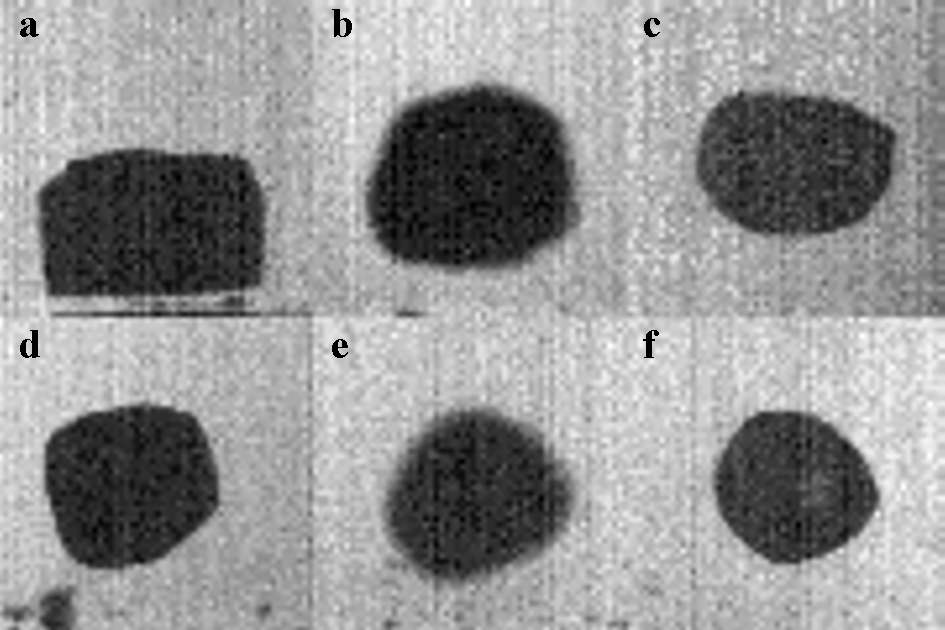
The decrease of the volume of the dust aggregate over the course of collisions with the baseplate is obvious as presented in the image sequence of Fig. 2. From each experiment we calculated the volume filling factor from Eq. 3 and took a boxcar average over 100 collisions to reduce stochastical scattering from the rotation of the aggregate. The mean filling factor and the standard deviation of all experiments are presented in Fig. 4 (solid line and grey shaded area).
The filling factor for is greater than the initial filling factor of , which is due to a combination of various systematic errors: The scaling is inaccurate if the aggregate is in the front or back of the box which results in an error of in , and the choice of the threshold for estimating the size yields an error of . In three experiments, the aggregate appeared from the smallest side in the beginning which overestimates , and the assumption of a sphere instead of the cuboid underestimates the filling factor until the aggregate is significantly rounded. Due to those uncertainties it is reasonable to regard the data only for and assume .
We give an analytic approximation which represents the filling factor for (dashed line, Fig. 4):
| (4) |
with , and . Accounting for the systematic error in the collision number , which is underestimated by 20 % (section 2), we take for practical use. For later application, we can calculate the volume of the aggregate (from Eqs. 3 and 4) as a function of the collision number
| (5) |
where we ignore the mass loss in the first collisions and take .
In a very simple model, we assume that the compression is the cause for the loss of kinetic energy, thus
| (6) |
where for the first collision can be calculated by deriving Eq. 5 for and :
| (7) |
Thus, we can calculate the pressure in the aggregate (first collision) as
| (8) |
For an aggregate with mg, , m s-1, and this yields a pressure of 3424 Pa. Using the compressive strength curve proposed by Güttler et al., (2009) we can calculate the volume filling factor in the compressed volume to be
| (9) |
For omindirectional dynamic compression, Güttler et al., (2009) developed the empirical parameters , , , and Pa, which yields a volume filling factor , which is slightly higher than the end compression of the aggregate.
The relation between the volume decrease of the agglomerate and the volume with compressed material is determined by the mass balance in the volume :
| (10) |
If we assume that this relation holds for every collision, we can calculate the volume fraction of the compressed material for the equilibrium situation to be:
| (11) | |||||
| (12) | |||||
| (13) | |||||
| (14) |
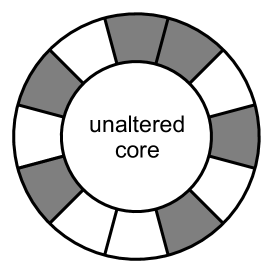
Inserting the given values, we learn that the volume of the compressed material for is 77 % of the end volume of the agglomerate. Thus, the aggregate is inhomogeneously compacted and has an unaltered core of 61 % in radius.
3.3 Influence of the Compaction on the Mechanical Properties
The change of the volume filling factor must clearly have an influence on the mechanical properties of the dust aggregate. One related finding is that in four experiments the aggregate fragmented during the succession of impacts (Fig. 5). Those experiments are marked in Table 1 and do not show a clear systematic difference to the other experiments in which the aggregate did not fragment. The number of collisions and the filling factors in those experiments are rather high – except for experiment 16.
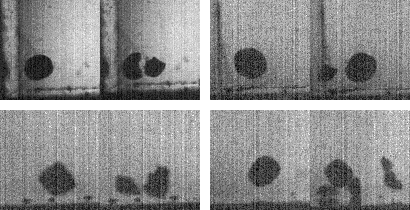
A possible explanation is a decrease of the critical fragmentation velocity with increasing volume filling factor or, at least, an increasing breakup probability. Figure 5 shows very gentle fragmentation in contrast to the broad size distribution of fragments found at higher velocities (Blum and Münch, , 1993). This breakup is usually found when fragmentation occurs at velocities near the fragmentation threshold. However, as the dependence on the number of collisions does not show a clear tendency, a second explanation is a general breakup probability for which we can give a rough estimate for mm-sized dust aggregates in low-velocity collisions as:
| (15) |
where is the total number of collisions in all experiments (Table 1).
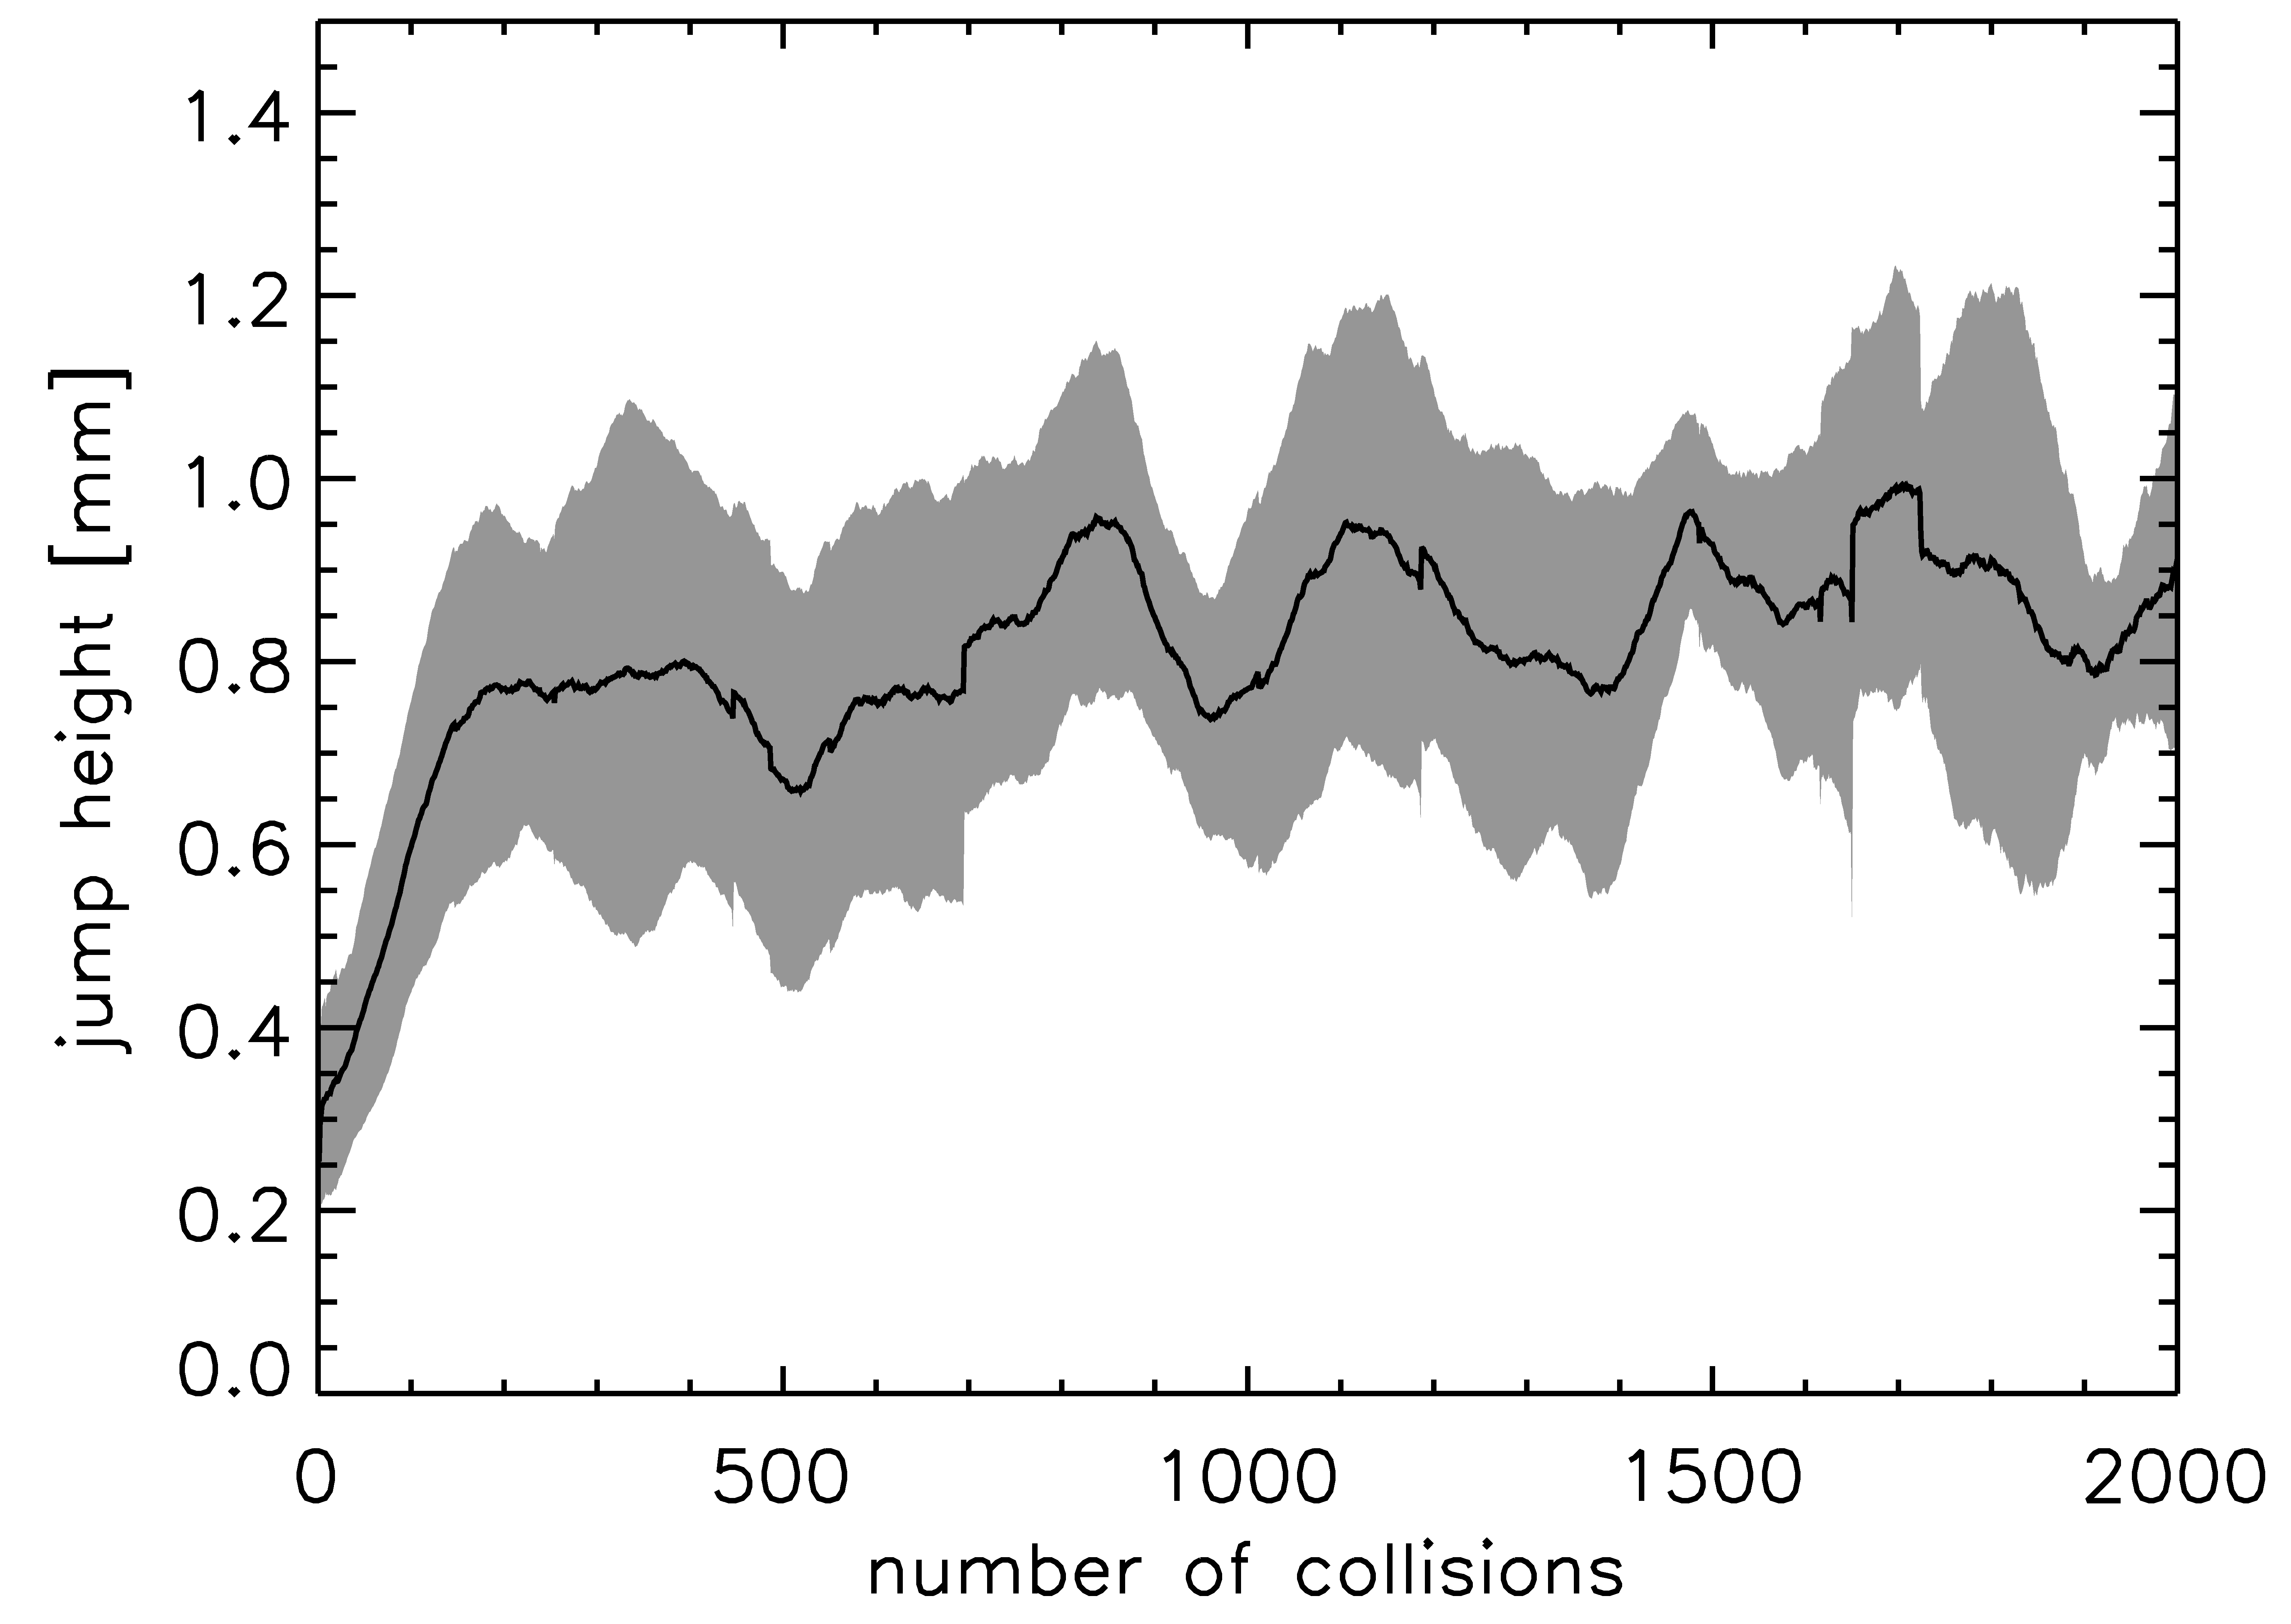
Another influence of the structural change might be expected for the coefficient of restitution: The coefficient of restitution is a measure for the dissipation of energy and from section 3.2 we know that compaction is a plausible dissipation mechanism. However, as the compaction is not constant over time, the coefficient of restitution is not expected to be either. As the mean baseplate velocity does not change with time, a change in the coefficient of restitution would result in a variation of the maximum height of the aggregate. Figure 6 shows that the jump height of the aggregate does only slightly increase with time for . A linear fit of all heights for yields a mean slope of m / 1000 collisions. The increasing height in the very beginning might be due to structural changes but concurrently the aggregate always collides with a broad side in these first collisions, which must have a substantial but unknown influence on the height.
4 Discussion
In this section we discuss the relevance for the protoplanetary nebula, namely, scaling the results for different sizes and velocities and estimating whether multiple bouncing collisions can occur in a reasonable timescale. Furthermore, we discuss the consequences of the aggregate compaction for their further evolution.
4.1 Collision Model
We will develop a scaling relation for the aggregate compaction in size and collision velocity. From the momentum balance of the colliding aggregate, we can give the pressure in the aggregate as
| (16) | |||||
| (17) |
where is the change of momentum of the colliding aggregate, taking place within the collision time , and is the contact area with the baseplate. For the contact area we make the assumption that the total surface of the aggregate interacted after collisions (), where is the e-folding width of the exponential function in Eq. 4.
Indeed, this simple model of maximum compaction of a fraction of the aggregate volume only if a previously passive site on the aggregate surface is hit, yields the very same behavior as Eq. 4, which justifies this assumption (see Fig. 7). Thus, we can combine Eqs. 8 and 17 to calculate the contact time
| (18) |
For the parameters of the mm aggregate in section 3.2 this leads to a contact time of ms, which is a realistic result. Indeed, the collision time in the experiments of Heißelmann et al., (2007) can be confined to less than 20 ms (see their image sequence) and preliminary studies dedicated to measure the collision time of aggregates with with a solid plate yield approximately 5 ms (Heißelmann et al., pers. comm.).
We approximate the situation by an elastic sphere with a Poisson number of zero, colliding with a wall and take the relation for the contact time from Hertz, (1881) as
| (19) |
where is the shear modulus of the sphere. Dintwa et al., (2008) compile the assumptions made in the Hertz model and value the importance of frictional contact, non-flat contact surface and large strains. As for the aimed accuracy in our model, the deviations from the Hertz model they found (and only for large strains) are rather small (within a few percent) so that we use Eq. 19 to calculate the shear modulus of the dust aggregate to be Pa. Combining Eqs. 18 and 19, we get a scaling relation for the compression of an aggregate as
| (20) | |||||
| (21) |
The upper velocity limit for this extrapolation is 0.56 m s-1 as for this velocity the volume filling factor reaches the physical maximum of , which is the random close packing of spheres. This high filling factor is, however, unlikely to be reached in collisional compression, because the aggregate will then rather fragment. Thus, the model predicts a fragmentation threshold for m s-1 in multiple collisions. Velocities below a few mm s-1 lead to an insignificant compaction of .
We follow the same Hertzian ansatz to derive a scaling relation for the the e-folding collision number . The radius of the contact area in the Hertz model is
| (22) |
Thus, the the e-folding collision number scales like
| (23) | |||||
| (24) |
With the scaling relations in Eqs. 21 and 24 we get and and we are able to give the increase of the aggregate’s volume filling factor in each collision as
| (25) |
with , , and for m s-1. For a constant velocity this description is equivalent to Eq. 4 but it has the advantage that it is independent of the collision history of an aggregate (e.g. independent of ) and is therefore capable to account for non-constant bouncing velocities.
4.2 Collision Timescale
| solar-nebula model | [g cm-2] | [mm] | [m-3] | [cm s-1] | [years] | [years] | |
|---|---|---|---|---|---|---|---|
| Weidenschilling, (1977) | 1700 | 1.50 | 1.50 | 0.27 | 1.62 | 1374 | |
| 2.66 | 20.00 | 0.03 | 24 | ||||
| Andrews and Williams, (2007) | 20 | 0.80 | 1.50 | 40.20 | 0.10 | 85 | |
| 0.11 | 20.00 | 0.06 | 46 | ||||
| Desch, (2007) | 50500 | 2.17 | 1.50 | 0.02 | 4.00 | 3398 | |
| 77.50 | 20.00 | 0.03 | 24 |
To value the importance of the bouncing and compacting collisions, we estimate the timescale on which subsequent collisions occur in the protoplanetary nebula. For simplicity we make the best-case assumption that the entire mass is in the relevant aggregate size. A comparable sharp size distribution was found for the first growth of fractal aggregates (Krause and Blum, , 2004) but is unknown for the mm-size range. The mean collision timescale is then
| (26) |
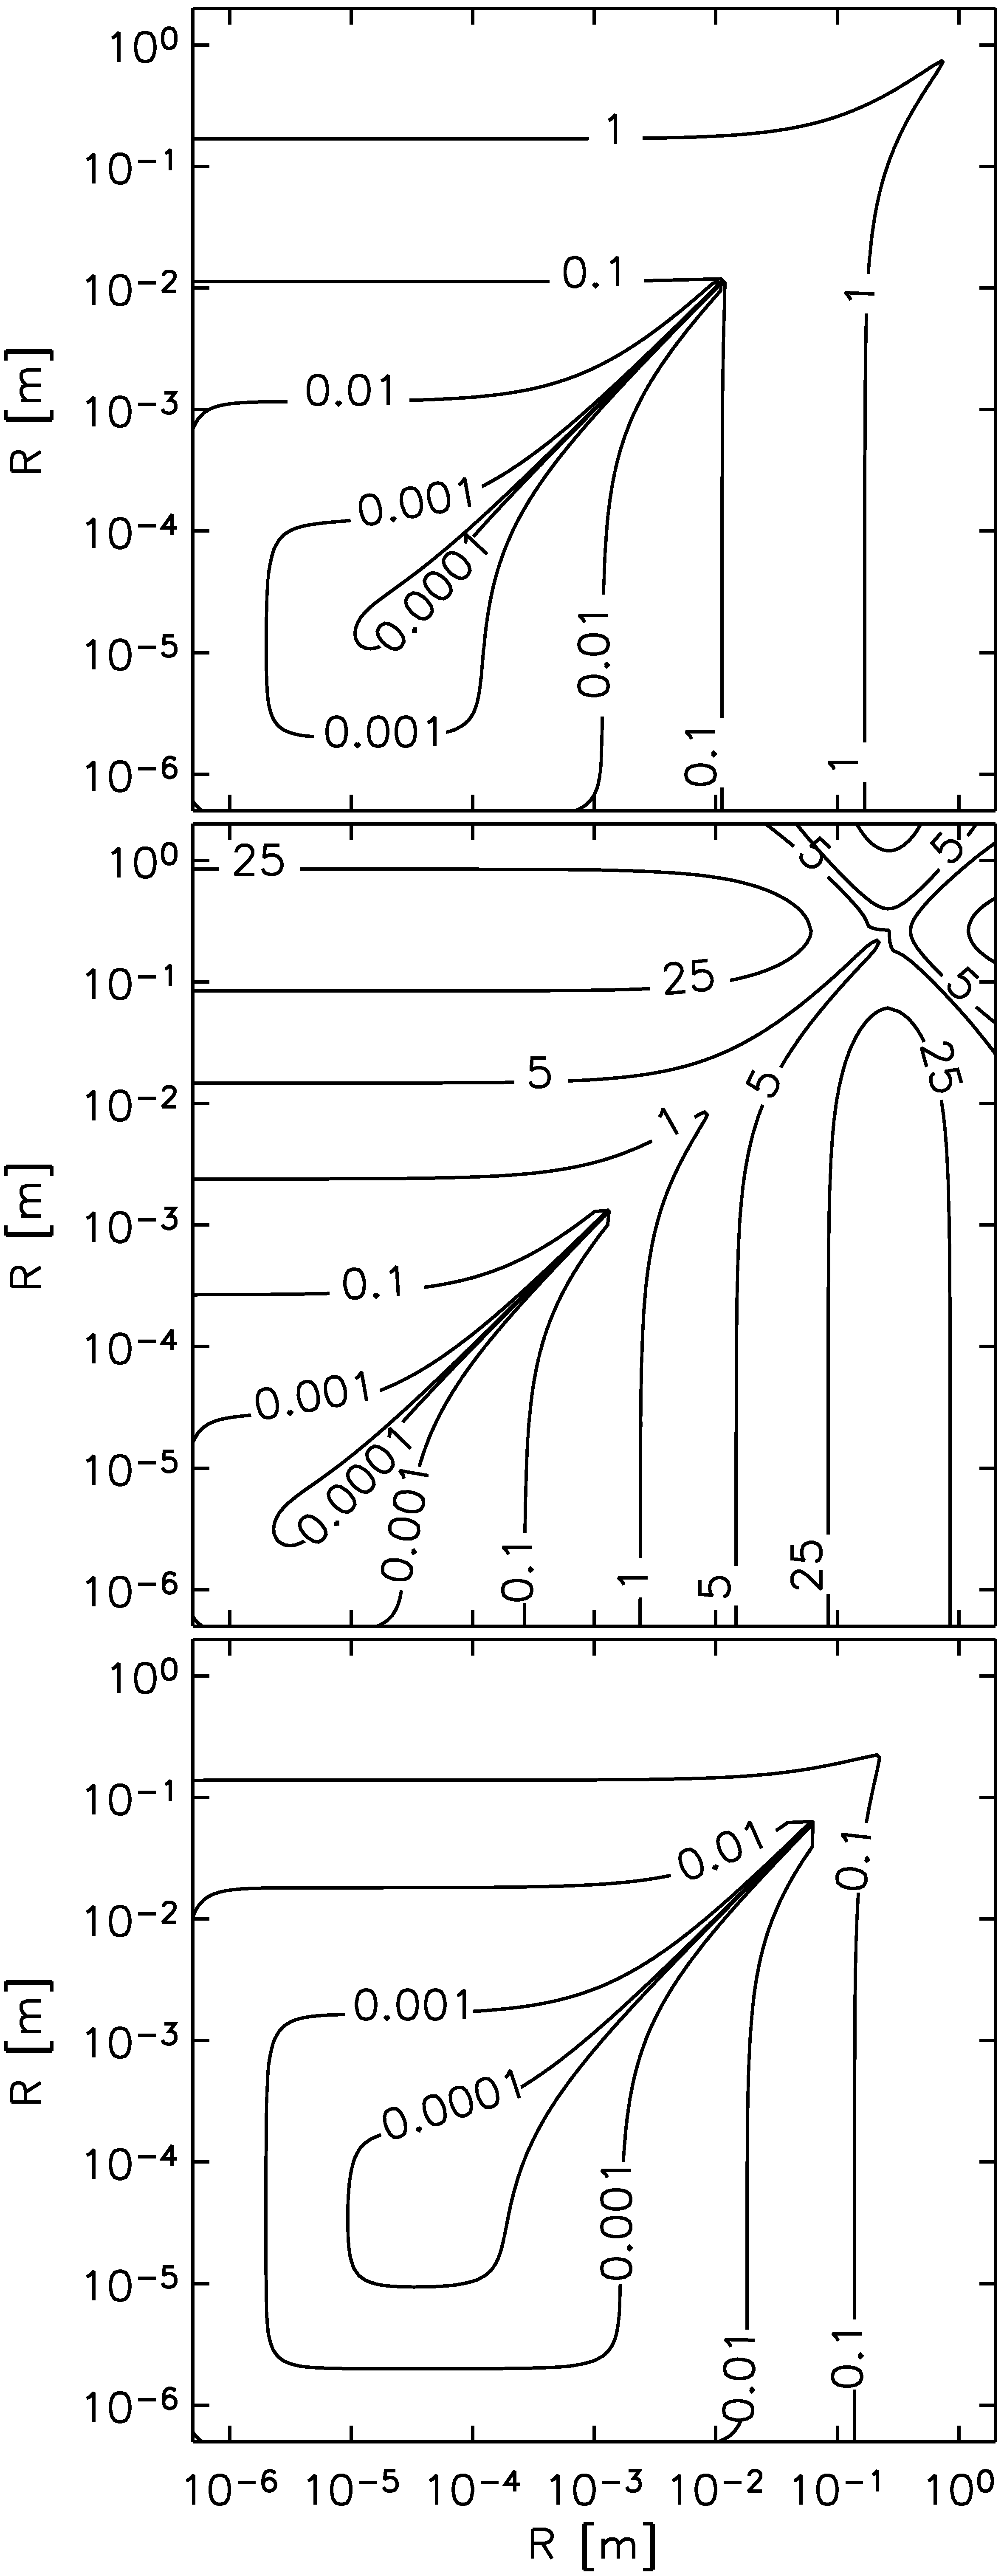
where is the number density of dust aggregates, is the collisional cross-section of two colliding aggregates, and is the relative velocity. A broad size distribution does not extremely alter the effect of collisional compaction. If we consider such a wide size distribution and concentrate on the compaction of an aggregate at the high-mass end by collisions with smaller aggregates, the collision timescale decreases due to the increasing number density of smaller particles, , whereas the collision cross section and the relative velocity do not significantly change (see Fig. 8). The decrease in collision time is (partly) compensated by the smaller contact area in the collision (see Eq. 22) so that the number of collisions required to cover the whole surface of the large aggregate scales like . Thus, the relevant timescale for the total compaction scales as . Therefore the data given in Table 2 are upper limits. If we assume a gas-to-dust ratio of 100, we can give a general number density of dust aggregates in the midplane of the protoplanetary disk as
| (27) |
This equation follows directly from the expressions for the dust particle density in the midplane, Eqs. A16 and A18 in Brauer et al., (2007). Here, is the surface density of the gas in units of [g cm-2] at 1 AU in the disk, is the distance to the star in [AU], and are the power indices for the surface density and temperature, respectively, is the mass of the star in [], is the temperature at 1 AU in units of [280 K], and and are the radius in [mm] and mass density in [kg m-3] of a representative dust aggregate. We assume that the dust particles are always in equilibrium between vertical dust settling towards the midplane of the disk and turbulent diffusion which mixes the dust up again into the higher regions of the protoplanetary disk (Dubrulle et al., , 1995; Cuzzi and Weidenschilling, , 2006). Larger particles settle closer to the midplane and, hence, lead to higher dust number densities. The last square root term in Eq. 27 accounts for this effect.
We assume to be in a nearly non-turbulent region in the midplane of the disk, the so-called dead zone. Due to the high dust opacity in the midplane the ionization degree in this region is too low for the magneto rotational instability to operate (Balbus and Hawley, , 1991; Reyes-Ruiz, , 2001). However, there are other sources for turbulence, such as Kelvin Helmholtz instability (Weidenschilling, , 1979; Johansen et al., , 2006), baroclinic instabilities (Klahr, , 2004; Petersen et al., , 2007), and possibly free charges mixed to the interior of the disk from the upper layers leading to a slight coupling of the midplane gas to the magnetic fields (Turner et al., , 2007). Therefore, we assume a low, but non-zero turbulent -value of (Cuzzi and Weidenschilling, , 2006). This low turbulent -value influences the number densities of the dust as well as the relative velocities of solid particles in the disk (Ormel and Cuzzi, , 2007).
We identify three solar nebula models which significantly spread the space of parameters in surface density. The first model is the minimum mass solar nebula (MMSN) model as calculated by Hayashi, (1981) and Weidenschilling, (1977). We adopt a second model based on recent interferometric millimeter observation of disks in the Taurus-Auriga and Ophiuchus-Scorpius star formation regions (Andrews and Williams, , 2007). These observations suggest much flatter surface density distributions than in the MMSN model. Finally, we consider a revised MMSN model which accounts for planetary migration in the early solar system (Desch, , 2007). In this new MMSN model, most of the mass is in the inner parts of the disk which leads to very high surface densities of several g cm-2, raising the question of gravitational instability. The surface densities at 1 AU and the power law indices of each disk model are given in Table 2. From these surface densities we can calculate the number density of aggregates (Eq. 27), also given in Table 2. For this calculation and also further on we use K, , , and kg m-3.
Different surface densities lead to different relative particle velocities in the protostellar disk. Figure 8 shows the relative velocities in the midplane of the disk at 1 AU for all three models. For calculating these velocities, we followed Brauer et al., (2008) and included Brownian motion, relative radial drift velocities, and relative velocities caused by turbulent gas motion as calculated by Ormel and Cuzzi, (2007). We remark that these relative velocities may differ from earlier works due to the fact that we adopt more recent calculations of relative particle velocities in turbulence (Ormel and Cuzzi, , 2007), and because the solid particle density used here is only 300 kg m-3 accounting for porous particle growth.
To deduce the mean collision velocities of two nearly equal sized aggregates with radius , we calculate relative velocities in the interval , accounting for a not perfectly sharp size distribution, and take the mean relative velocity in this interval. Thus, collision velocity, number density (Eq. 27) and cross section yield the collision timescale for different models. We also scale the size of the aggregate (cf. section 4.1) so that we get a mean relative velocity of 0.2 m s-1. For these sizes and velocities, we get collision timescales of less than a year. After the time , the aggregates are significantly compacted and all these times are short in terms of planet formation.
4.3 Consequences for Further Protoplanetary Growth
We address three important consequences of the results of this work: (i) The aggregates are compacted and therefore change their surface-to-mass ratio. This has consequences for their coupling to the gas and their relative velocities. (ii) The compacted aggregate possesses macroscopic parameters like tensile strength, compressive strength and shear strength different to the strengths of the non-compacted aggregate. (iii) The finding of unexpected fragmentation requires a review of the fragmentation threshold.
(i) The friction time, the time in which a protoplanetary dust aggregate is coupled to the surrounding rarified gas, is in the free molecular flow regime defined as (Epstein, , 1924)
| (28) |
where and are the mass density and the mean thermal velocity of the gas. and are properties of the dust aggregate, namely, its mass and its geometrical cross section . In section 3.2 we found that the aggregate volume decreases by a factor of two within 1000 collisions without changing its mass, which increases its friction time by a factor of 1.6. The friction time determines the aggregate’s velocity relative to the nebular gas and, thus, relative to other aggregates (Weidenschilling and Cuzzi, , 1993). As the size of the aggregate decreases from the compaction, its relative velocity would be that of an uncompacted aggregate with twice its diameter.
(ii) The macroscopic material parameters are clearly connected to the coordination number (number of contacts per dust grain) and thus to the volume filling factor. The compressive strength curve (Blum and Schräpler, , 2004; Güttler et al., , 2009, paper I) gives the relation for the compressive strength as a function of the filling factor. Blum and Schräpler, (2004) measured the tensile strength for differently-compressed dust aggregates and found an increasing tensile strength, closely linear to the coordination number. The shear strength (so far not measured for dust aggregates) is also believed to be depending on the filling factor (Sirono, , 2004; Schäfer et al., , 2007; Güttler et al., , 2009). Güttler et al., (2009) perform Smooth Particle Hydrodynamics simulations using macroscopic material parameters to develop a collision model for protoplanetary dust aggregates. Sirono, (2004) found the occurrence of fragmentation to be depending on the ratio between tensile strength and compressive strength. As the compressive strength is much more sensitive to compaction than the tensile strength (Blum and Schräpler, , 2004), the compaction will clearly have an influence on the fragmentation threshold which is qualitatively shifted to smaller velocities.
(iii) The occurrence of fragmentation is rather surprising. Earlier experiments (Blum and Münch, , 1993, paper II) show fragmentation for velocities m s-1, which is well above the maximum velocity of the experiments presented here (0.3 m s-1). One possible explanation is a decreased fragmentation threshold due to the change of macroscopic parameters (see (ii)). However, Blum and Münch, (1993) performed experiments with intermediate porosities (), still with a different material (ZrSiO4), and found the same threshold. Explanations based on cracking and cumulative damage of the aggregate in multiple collisions are thinkable to reduce the aggregate strength but this – although of major importance – remains open for further investigation. A second possibility is a low but non-zero fragmentation probability, which would clearly be depending on velocity and material parameters, and has a finite value per collision for m s-1. Although this probability disregards the history of the aggregate, it is so far the only possible treatment of the breakup in multiple collisions.
Acknowledgement
We thank the Deutsche Forschungsgemeinschaft for funding this work within the Forschergruppe 759 ”The Formation of Planets: The Critical First Growth Phase” under grant Bl298/7-1.
References
- Andrews and Williams, (2007) Andrews, S. M. and Williams, J. P. (2007). High-Resolution Submillimeter Constraints on Circumstellar Disk Structure. ApJ, 659:705–728.
- Balbus and Hawley, (1991) Balbus, S. A. and Hawley, J. F. (1991). A powerful local shear instability in weakly magnetized disks. I - Linear analysis. II - Nonlinear evolution. ApJ, 376:214–233.
- Blum and Münch, (1993) Blum, J. and Münch, M. (1993). Experimental investigations on aggregate-aggregate collisions in the early solar nebula. Icarus, 106:151.
- Blum and Schräpler, (2004) Blum, J. and Schräpler, R. (2004). Structure and Mechanical Properties of High-Porosity Macroscopic Agglomerates Formed by Random Ballistic Deposition. Phys. Rev. Lett., 93(11):115503.
- Blum et al., (2006) Blum, J., Schräpler, R., Davidsson, B. J. R., and Trigo-Rodríguez, J. M. (2006). The Physics of Protoplanetesimal Dust Agglomerates. I. Mechanical Properties and Relations to Primitive Bodies in the Solar System. ApJ, 652:1768–1781.
- Blum and Wurm, (2000) Blum, J. and Wurm, G. (2000). Experiments on Sticking, Restructuring, and Fragmentation of Preplanetary Dust Aggregates. Icarus, 143:138–146.
- Blum et al., (2000) Blum, J., Wurm, G., Kempf, S., Poppe, T., Klahr, H., Kozasa, T., Rott, M., Henning, T., Dorschner, J., Schräpler, R., Keller, H. U., Markiewicz, W. J., Mann, I., Gustafson, B. A., Giovane, F., Neuhaus, D., Fechtig, H., Grün, E., Feuerbacher, B., Kochan, H., Ratke, L., El Goresy, A., Morfill, G., Weidenschilling, S. J., Schwehm, G., Metzler, K., and Ip, W.-H. (2000). Growth and Form of Planetary Seedlings: Results from a Microgravity Aggregation Experiment. Phys. Rev. Lett., 85:2426–2429.
- Brauer et al., (2008) Brauer, F., Dullemond, C. P., and Henning, T. (2008). Coagulation, fragmentation and radial motion of solid particles in protoplanetary disks. A&A, 480:859–877.
- Brauer et al., (2007) Brauer, F., Dullemond, C. P., Johansen, A., Henning, T., Klahr, H., and Natta, A. (2007). Survival of the mm-cm size grain population observed in protoplanetary disks. A&A, 469:1169–1182.
- Cuzzi and Weidenschilling, (2006) Cuzzi, J. N. and Weidenschilling, S. J. (2006). Particle-Gas Dynamics and Primary Accretion, pages 353–381. Meteorites and the Early Solar System II.
- Desch, (2007) Desch, S. J. (2007). Mass Distribution and Planet Formation in the Solar Nebula. ApJ, 671:878–893.
- Dintwa et al., (2008) Dintwa, E., Tijskens, E., and Ramon, H. (2008). On the accuracy of the Hertz model to describe the normal contact of soft elastic spheres. Granular Matter, 10(3):209–221.
- Dominik and Tielens, (1997) Dominik, C. and Tielens, A. G. G. M. (1997). The Physics of Dust Coagulation and the Structure of Dust Aggregates in Space. ApJ, 480:647.
- Dubrulle et al., (1995) Dubrulle, B., Morfill, G., and Sterzik, M. (1995). The dust subdisk in the protoplanetary nebula. Icarus, 114:237–246.
- Epstein, (1924) Epstein, P. S. (1924). On the resistance experienced by spheres in their motion through gases. Phys. Rev. Lett., 23(6):710–733.
- Güttler et al., (2009) Güttler, C., Krause, M., Geretshauser, R., Speith, R., and Blum, J. (2009). Towards a Dynamical Collision Model of Highly Porous Dust Aggregates. In Powders & Grains 2009 Conference Proceedings. submitted.
- Hayashi, (1981) Hayashi, C. (1981). General Discussions - Fundamental Problems in the Theory of Stellar Pulsation. In Fundamental Problems in the Theory of Stellar Evolution, volume 93 of IAU Symposium, pages 339–342. D. Reidel Publishing Co.
- Heißelmann et al., (2007) Heißelmann, D., Fraser, H., and Blum, J. (2007). Experimental Studies on the Aggregation Properties of Ice and Dust in Planet-Forming Regions. In Proceedings of the 58th International Astronautical Congress 2007. IAC-07-A2.1.02.
- Hertz, (1881) Hertz, H. (1881). Über die Berührung fester elastischer Körper. Journal für die reine und angewandte Mathematik, 92:156–171.
- Johansen et al., (2006) Johansen, A., Henning, T., and Klahr, H. (2006). Dust Sedimentation and Self-sustained Kelvin-Helmholtz Turbulence in Protoplanetary Disk Midplanes. ApJ, 643:1219–1232.
- Klahr, (2004) Klahr, H. (2004). The Global Baroclinic Instability in Accretion Disks. II. Local Linear Analysis. ApJ, 606:1070–1082.
- Krause and Blum, (2004) Krause, M. and Blum, J. (2004). Growth and Form of Planetary Seedlings: Results from a Sounding Rocket Microgravity Aggregation Experiment. Phys. Rev. Lett., 93(2):021103.
- Langkowski et al., (2008) Langkowski, D., Teiser, J., and Blum, J. (2008). The Physics of Protoplanetesimal Dust Agglomerates. II. Low-Velocity Collision Properties. ApJ, 675:764–776.
- Ormel and Cuzzi, (2007) Ormel, C. W. and Cuzzi, J. N. (2007). Closed-form expressions for particle relative velocities induced by turbulence. A&A, 466:413–420.
- Paszun and Dominik, (2008) Paszun, D. and Dominik, C. (2008). Numerical determination of the material properties of porous dust cakes. A&A, 484:859–868.
- Petersen et al., (2007) Petersen, M. R., Julien, K., and Stewart, G. R. (2007). Baroclinic Vorticity Production in Protoplanetary Disks. I. Vortex Formation. ApJ, 658:1236–1251.
- Reyes-Ruiz, (2001) Reyes-Ruiz, M. (2001). The Magnetorotational Instability across the Dead Zone of Protoplanetary Disks. ApJ, 547:465–474.
- Schäfer et al., (2007) Schäfer, C., Speith, R., and Kley, W. (2007). Collisions between equal-sized ice grain agglomerates. A&A, 470:733–739.
- Sirono, (2004) Sirono, S.-I. (2004). Conditions for collisional growth of a grain aggregate. Icarus, 167:431–452.
- Turner et al., (2007) Turner, N. J., Sano, T., and Dziourkevitch, N. (2007). Turbulent Mixing and the Dead Zone in Protostellar Disks. ApJ, 659:729–737.
- Weidenschilling, (1977) Weidenschilling, S. J. (1977). The distribution of mass in the planetary system and solar nebula. Ap&SS, 51:153–158.
- Weidenschilling, (1979) Weidenschilling, S. J. (1979). Self-Induced Turbulence and the Onset of Gravitational Instability in a Dust Layer. Bulletin of the American Astronomical Society, 11:552.
- Weidenschilling and Cuzzi, (1993) Weidenschilling, S. J. and Cuzzi, J. N. (1993). Formation of planetesimals in the solar nebula. In Levy, E. H. and Lunine, J. I., editors, Protostars and Planets III, pages 1031–1060.