Optical constants of silicon carbide for astrophysical applications. II. Extending optical functions from IR to UV using single-crystal absorption spectra
Abstract
Laboratory measurements of unpolarized and polarized absorption spectra of various samples and crystal stuctures of silicon carbide (SiC) are presented from 1200–35,000 cm-1 ( 8–0.28 m) and used to improve the accuracy of optical functions ( and ) from the infrared (IR) to the ultraviolet (UV). Comparison with previous 6–20 m thin-film spectra constrains the thickness of the films and verifies that recent IR reflectivity data provide correct values for in the IR region. We extract and needed for radiative transfer models using a new “difference method”, which utilizes transmission spectra measured from two SiC single-crystals with different thicknesses. This method is ideal for near-IR to visible regions where absorbance and reflectance are low and can be applied to any material. Comparing our results with previous UV measurements of SiC, we distinguish between chemical and structural effects at high frequency. We find that for all spectral regions, 3C (-SiC) and the polarization of 6H (a type of -SiC) have almost identical optical functions that can be substituted for each other in modeling astronomical environments. Optical functions for of 6H SiC have peaks shifted to lower frequency, permitting identification of this structure below m. The onset of strong UV absorption for pure SiC occurs near 0.2 m, but the presence of impurities redshifts the rise to 0.33 m. Optical functions are similarly impacted. Such large differences in spectral characteristics due to structural and chemical effects should be observable and provide a means to distinguish chemical variation of SiC dust in space.
1 Introduction
Silicon carbide (SiC) is of great interest in the context of dust in a variety of astrophysical environments and is the most well-studied type of presolar grain (Clayton & Nittler, 2004; Bernatowicz et al., 2006, and references therein). Isotope measurements exist for thousands of presolar SiC grains (mostly of the cubic structural form) and suggest that they came from AGB stars and supernovae; the majority of meteoritic SiC grains are thought to have originated in circumstellar shells of carbon stars (C-stars). Astronomical SiC was discovered via observations of a broad m emission feature seen in many C-star spectra (Hackwell, 1972; Treffers & Cohen, 1974) that is associated with stretching of the Si-C bond. In the absence of strong infrared (IR) features from amorphous or graphitic carbon grains, the presence and variations of the 11 m SiC feature provide a useful diagnostic for inferring the physical conditions in the circumstellar dust shells of C-stars (e.g., Baron et al., 1987; Willem, 1988; Chan & Kwok, 1990; Goebel et al., 1995; Speck et al., 1997; Sloan et al., 1998; Speck et al., 2005). Consequently, study of SiC may allow us to test theories of grain formation, evolution and destruction in many astronomical environments. Thompson et al. (2006) showed that relating observational data on the SiC peak position, strength, and shape to the underlying continuum temperature did not yield useful information about circumstellar shell structure and evolution, and concluded that radiative transfer modeling is necessary to disentangle the dust shell parameters. The ability to perform and achieve the latter has been limited by a lack of grain-size-independent optical functions (real and imaginary indices of refraction and ) for SiC at all relevant wavelengths.
Studying SiC presents several opportunities for understanding cosmic dust. In particular, the prevalence of SiC grains around carbon stars and in presolar samples suggests that some SiC grains survive the interstellar medium (ISM) and are incorporated into new planetary systems (e.g., Bernatowicz et al., 2006, and references therein). However, the abundance of SiC in the ISM determined in most studies is extremely low (e.g., Whittet et al., 1990; Kemper et al., 2004), with only one study estimating abundances consistent with 10% of Si atoms being bound in SiC (Min et al., 2007). Because UV extinction is the main constraint in most ISM dust grain models, this disparity is connected to the high photon flux in the UV (Kim, Martin & Hendry, 1994; Zubko et al., 2004; Weingartner & Draine, 2001), coupled with the fact that optical strengths for SiC in the UV vary among published studies (cf. Philipp, 1958; Choyke & Patrick, 1957).
In addition, recent Spitzer Space Telescope observations have shown that carbon stars are much more common in lower metallicity Local Group galaxies than in our own Galaxy (Lagadec et al., 2007, 2008; Zijlstra et al., 2006; Sloan et al., 2008). Detection of an SiC feature near 11 m provides a diagnostic for the nature of these objects. Furthermore, SiC is commonly found in extreme carbon stars and planetary nebulae (PNe) in the Large Magellanic Cloud (Stanghellini et al., 2007; Bernard-Salas et al., 2008; Gruendl et al., 2008), and not commonly found in their Milky Way counterparts (Barlow, 1983; Rinehart et al., 2002; Casassus et al., 2001; Speck et al., 2009). Consequently SiC presents a tool for understanding the effect of metallicity on dust formation, evolution, and survival. Thorough investigation of these environments requires reliable optical functions for SiC with a broad wavelength coverage.
Pitman et al. (2008, hereafter designated Part I) provided new mid- and far-IR reflectance spectra and grain-size-independent optical functions for several SiC samples and discussed the limitations of existing mid- to far-IR datasets on and for SiC (e.g., use of the commercially available hexagonal rather than the space-relevant cubic structural forms of SiC, dependence on grain-size distribution of original laboratory sample measured, and the relationship between structure and spectral parameters from symmetry analysis). In particular, Part I confirmed that previous SiC reflectance studies (e.g., Spitzer et al., 1959; Bohren & Huffman, 1983) correctly assessed peak strengths and widths but found that peak positions were about 4 cm-1 too low, due to the low resolution and lack of internal calibration in the older instruments used. Quantitatively analyzed IR reflectivity data (Part I) and previous laboratory studies of SiC, particularly at high frequency, provide much of the information required for the applications discussed above, but improvements are needed in the following areas:
-
1.
Published visible-UV spectroscopic data for -SiC cover only part of the needed spectral range, and past visible-UV reflectance and absorbance datasets for -SiC are not entirely consistent with one another. For both - and -SiC, was obtained only for the visible (Thibault, 1944; Philipp, 1958; Philipp & Taft, 1960; Choyke & Patrick, 1957). Furthermore, those data are not in electronic form and have been incorporated into previous derivations of optical functions via digitization, which provides limited spectral resolution and accuracy.
-
2.
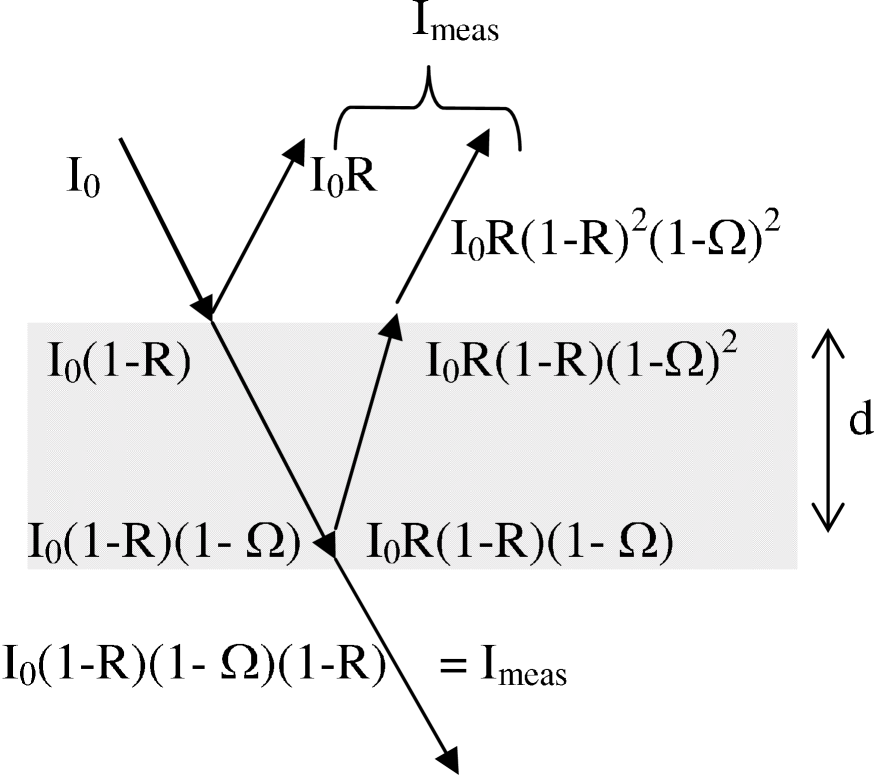
For SiC, the near-IR to visible region has low reflectivity ( 20%) and low absorption coefficients ( 0.1 m-1). As a consequence, not only do primary reflections occur at the front surface, but moreover, secondary reflections at the back surface of the sample are significant (Fig. 1). These back-reflections affect both reflection and absorption/transmission measurements, thereby contributing errors to the extracted optical functions for these regions.
-
3.
In the UV region, both and are high, from which accurate optical functions can be extracted; however, few modern laboratories are equipped for measurements above about 33,000 cm-1. Very high frequency data in early literature can be evaluated and utilized if data are corrected for reflectivity are gathered in the visible.
To address these issues, this paper provides new, single-crystal absorption spectra of the same samples used in Part I, but at higher frequencies and over the spectral range where is low, to better constrain up to the UV. Combining these new data with the optical functions from Part I and our previous thin-film IR data (Speck et al., 1999, 2005) both augments existing data by significantly extending the wavelength coverage, and provides a cross-check on the accuracy of the previous data.
In addition we develop a new approach – the “difference method” – for extracting and values from transmission spectra and also utilize “limiting values” as in previous literature (e.g. Lipson, 1960). Our approach can be applied to any material, not just SiC. Because transmission is easily and commonly measured, the difference method and limiting values may be used to greatly expand the database of astronomically relevant near-IR to UV optical functions and aid implementation of radiative transfer models for many environments, not just C-stars.
2 Experimental methods
We investigated seven different samples, listed in Table 1. Although the prevalent form of astronomical SiC is the cubic (3C, or -SiC) polymorph, large single-crystals of that type are not available. Hence, we examined vapor deposited 3C as well as several crystals with one specific hexagonal, layered structure (6H). The label is used to describe diverse hexagonal variations of the SiC structure. Part I describes sample characteristics in detail, which are summarized in Table 1. The colors of the samples are used to denote which sample is being examined. Because color is indicative of impurities, this attribute is significant, as will be discussed in § 4.3.1.
The 6H SiC samples are anisotropic, so it is necessary to gather spectral data parallel and perpendicular to the layers (the and crystal axes) to provide data for the extraordinary and ordinary rays, respectively. Sample thicknesses were determined by using a calibrated micrometer and also by using a binocular microscope with a calibrated reticule. If possible, absorbance spectra were obtained from commercially polished sections. Thin samples were prepared by grinding and polishing sections of moissanite, a gemstone grade variety of 6H SiC. Twin planes provided reference points to maintain correct orientations (- or - plates). For the near-IR to visible studies of tiny platelets, thicknesses were obtained from interference fringes using:
where is thickness and is the wavenumber spacing of the interference fringes. Fringes tend to occur where is similar to the wavelength of the incident light and when the faces are perfectly parallel. Values of from our reflectivity study (Part I) and interference fringe spacing in the near-IR were used. Nearly identical values of for thin platelets were obtained using direct measurements of from refractometry (Shaffer & Naum, 1969; Shaffer, 1971) and fringe spacing in the visible.
Room temperature (18–19∘C) IR absorption spectra were acquired at normal incidence using an evacuated Bomem DA 3.02 Fourier transform spectrometer111Bomem Inc., Quebec, Canada. (FTIR) at 1 cm-1 resolution below 4000 cm-1 and at 4 cm-1 resolution at higher frequencies. Resolutions of this level are considered reasonable for non-gaseous samples acquired at room temperature. The accuracy of the instrument is 0.01 cm-1. Far-IR data () were collected using a SiC globar source, a liquid helium cooled bolometer, and a coated mylar beam-splitter. Mid-IR data ( 450–4000 cm-1) were collected using a SiC globar source, a liquid nitrogen cooled HgCdTe detector, and a KBr beam-splitter. Near-IR data ( 1800–7000 cm-1) were collected using a SiC globar, a liquid nitrogen cooled InSb detector, and a CaF2 beam-splitter. For 4000–10,000 cm-1, we used a quartz lamp, a liquid nitrogen cooled InSb detector, and a quartz beam-splitter. To access the 9500–21,000 cm-1 range, we substituted a silicon avalanche detector. Large samples were mounted on apertures at the focal point in the sample compartment, and a wire-grid polarizer was used to obtain polarization information from the moissanite sample. Most of our 6H samples were - plates, from which unpolarized data (equivalent to the orientation , where is the electric field vector) were gathered. Small platelets from Alfa/Aesar™ were placed on apertures of 100 m diameter and data were collected using a Spectra-Tech IR microscope222Spectra-Tech Inc. (Thermo Electron Corp.), Stamford, CT, USA..
Additional, independent measurements were obtained from the platelets (on apertures) at UV wavelengths using the spectroscopic facilities at the Geophysical Laboratory, Carnegie Institution of Washington. This system consists of a custom-made, all-reflective microscope with Cassegrain-type mirror objectives and two off-axis paraboloids as a transfer optics, coupled to a Nicolet 750 Magna FT-IR spectrometer for IR measurements and to a grating monochromator-spectrograph with a CCD detector, and configured for the visible and UV regions (Goncharov et al., 2006).
We used a CaF2 beam-splitter and a halogen lamp for near-IR acquisitions, and a combination halogen/deuterium light source for the visible-UV spectral range. Spectral resolution was about 16 cm-1 through the whole spectral range (2400–40,000 cm-1).
3 Data Analysis and the Difference Method
Because transmission through a sample is more easily and commonly measured than reflection, we present two methods for extracting and from transmission measurements: the “difference” and limiting methods. Which method is applicable depends not only the material property (or equivalently ) but also on the thickness. Because optical functions are frequency dependent, for any given thickness, each method will give accurate results over only certain spectral segments. Practical issues such as sample characteristics (Table 1) strongly influence thickness and therefore which method is viable for the region of interest. In addition, the experimenter can vary thickness to optimize the accuracy of the results. The equations underlying both methods are definitions for the various optical properties. The following analysis assumes normal incidence of a collimated light beam on a sample and that interference fringes do not exist or can be removed, e.g., by smoothing. Instruments record the light that is transmitted through a sample, rather than the light that is actually absorbed by it. Software for both spectrometers provide absorbance using the convention from the spectroscopy, chemistry and mineralogy literature (SCM),
| (1) |
where is the intensity exiting the sample and is the intensity entering the sample (which is obtained by collecting a reference spectrum). The effect of surface reflections is neglected in the SCM literature largely because is unknown. Instead, empirical baseline corrections are used, which suffice to extract widths and relative intensities needed for many applications. However, baseline corrections do not provide the information on and needed for modeling radiative transfer.
To compute the amount of light that is actually absorbed, the true or ideal absorption coefficient () requires correcting for specular (surface) reflections of magnitude , where is the proportion of incident light reflected only from the front surface as shown in Fig. 1, as follows:
| (2) |
Conversion to natural logarithms via Eq. 2 is needed to directly compare measured absorption spectra with the ideal absorption coefficients obtained from reflectivity data (see, e.g., Part I, Figures 3a–10a).
Transmission spectra measured from two samples with different thicknesses, , but that are otherwise identical, are described by Eq. 2 with different values for . Taking the difference between those equations (not shown) eliminates the reflection term, thereby allowing determination of :
| (3) |
where the subscripts “thin” and “thck” indicate the two different sections being measured. Specular reflectance is then obtained from:
| (4) |
We refer to this approach as “the difference method.” To the best of our knowledge, this equation has not previously been published, although the above analysis is an extension of existing analysis in the spectroscopy literature (i.e., use of limiting values for transparent spectral regions, e.g., Lipson, 1960), described below.
The imaginary part of the complex index of refraction, , is defined as
| (5) |
Since we can extract both and from the two transmission spectra, we can then obtain , the real part of the complex index of refraction, from the following equation:
| (6) |
which assumes that the surrounding medium (air or vacuum for single-crystal studies) has = 1.
Applying this analysis requires meeting certain conditions. The thicker section cannot be opaque over any part of frequency range being investigated. The thinner section cannot be so thin that its absorbance is negligible. The polish must be nearly perfect for both sections and the thicknesses must be such that fraction of light reflected from the front surface is similar to the fraction of light transmitted through each crystal. Also, any experimental uncertainties connected with measuring thicknesses will be propagated into errors in the optical functions. Multiple measurements can decrease the uncertainties associated with computing differences, provided that all sections are identical in composition and surface polish.
Due to the stringent requirements for the difference method, we utilize cross-checks. One independent confirmation exists for in the visible because in this spectral region, 1 for small to moderate values of . For this case, Eq. 6 simplifies to
| (7) |
which can be evaluated using measurements of in the visible, obtained independently by matching the sample’s optics to that of a liquid with known refractive index.
A second cross-check, or alternative approach to our “difference method” is use of limiting values for determining and . For regions where is nearly zero, spectral measurement of a fairly thin sample provides because transmission, = , is given by
| (8) |
and can be simplified for the case of negligible absorption to
| (9) |
Substituting Eq. 7 into Eq. 9 yields (e.g. Lipson, 1960). Both reflections from the front and back surfaces of the sample section are accounted for (Fig. 1). Use of limiting values requires a well-polished sample. To obtain or , additional transmission data is then acquired from a very thick sample, and the results for are used in Eq. 2.
If both sample thickness and are very large, a special case occurs. When scaling large obtained from 1 mm sections to thicknesses near 1 m, the correction for reflectivity becomes negligible and can be directly computed. Again, a good polish is needed or scattering occurs which has a frequency dependence.
By applying both the “difference” and limiting methods, we can compute and from multiple transmission spectra of identical samples of different thicknesses. By comparing the results over frequency regions where both methods are applicable, we can construct a consistent set of optical functions and ensure that surface polish is not affecting the values. Such a comparison requires laboratory measurements over a wide range of thicknesses. Furthermore, this approach can be applied to any material, not just SiC.
4 Results and Comparison to Previous Studies
4.1 Near-IR absorption of 3C -SiC
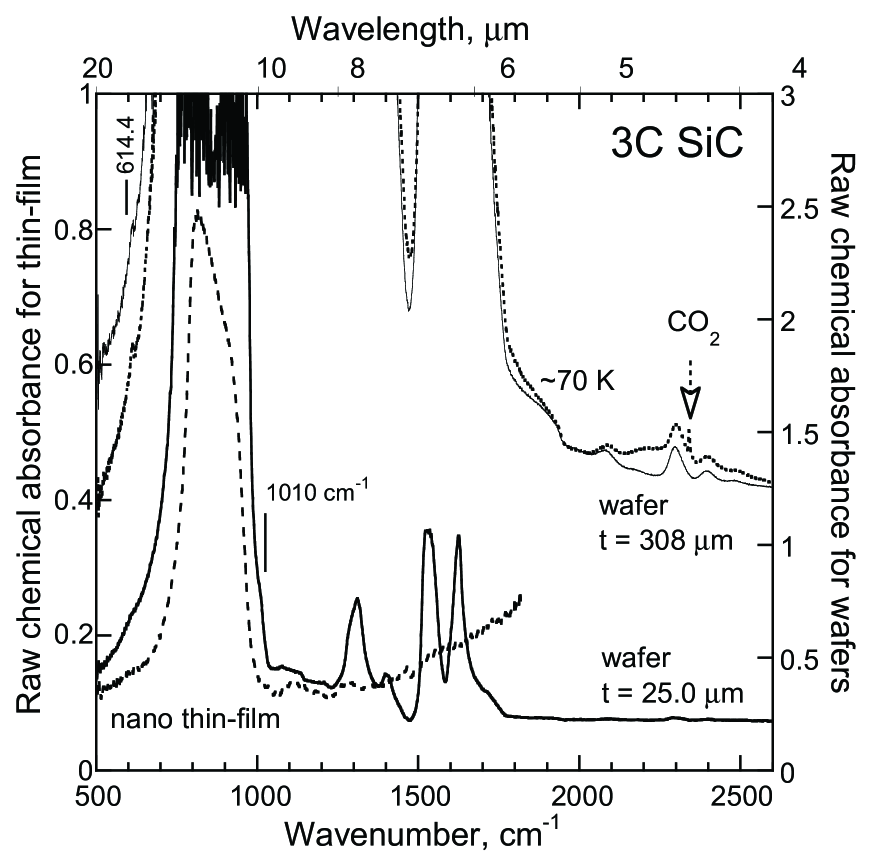
Laboratory absorption spectra from a thin wafer of cubic SiC show one very strong IR mode from 950–1000 cm-1 that is off-scale (Fig. 2). The noisy profile close to the barycenter is affected by stray light and is not intrinsic. This main feature results from Si-C stretching and is the transverse optic (TO) component. This triply degenerate mode also has a longitudinal optic (LO) component. Ideally, no other IR mode is active in 3C. However, as is common in diatomic substances (e.g., Hofmeister et al., 2003), structure is superimposed on this main band. A weak shoulder at 614.4 cm-1 is associated with the longitudinal acoustic (LA) mode, which is present due to resonance with the TO and LO modes. Transverse acoustic (TA) modes have frequencies too low for such resonances to occur. Peak positions of the fundamental modes are given in the footnotes in Table 2.
From 1000–1800 cm-1, a series of fairly intense overtone-combination bands exist that are well resolved for sample thicknesses of 5–100 m. From 1800–2700 cm-1, weak overtone-combination bands exist that are well resolved for 100 m to several mm. Positions of the overtones and the relationships to the fundamental modes are given in Table 2. Most of the modes are clearly connected to some combination of the fundamentals, but some cannot be assigned with confidence, as indicated by the question marks in this table. It is difficult to predict the activity and frequency of overtone-combination modes because this type of phonon involve anharmonic interactions of fundamental modes (e.g., Mitra, 1969). Sometimes Raman modes can sum to provide overtones in the IR whereas some combinations of IR modes are forbidden. Overtones lacking an obvious assignment could be connected with impurities, non-stoichiometry, or stacking disorder.
By comparing intensities of the shoulder near 1800 cm-1 from the spectra of the thin wafer to spectra of a much thicker wafer, we confirmed that the thin wafer indeed has a thickness of 25 m (Fig. 2).
Absorbance spectra at liquid N2 temperatures of the 3C wafer were also acquired by attaching the thick wafer to a cold finger. No shifts in peak positions were seen. Bands are sharper but have roughly the same area as measured at room temperature (Fig. 2). From this, we infer that absorption spectra of SiC are little affected by temperature, consistent with the incompressibility of SiC (e.g., Knittle, 1995), i.e., bond lengths for silicon carbide vary little with pressure or temperature. Positions and widths of the main bands will change even less than indicated by Fig. 2 upon cooling because of the fundamental mode changes at about half the rate of for the simple overtones.
The polish on the thin and thick sections were quite different (the vapor deposit has some texture) and opaque spectral regions exist, making it difficult to apply the difference method. For example, near 2500 cm-1, using Eqs. 3 and 4 gives as 0.00279 m-1 and as 0.048. This computation of differs by a factor of 4 from the value in Part I and is attributed to variations in polish on the surfaces of the samples. We therefore determine the absorbance of the 1 m wafers (§ 4.1.1) by scaling from the very thick (308 m), strongly absorbing section.
4.1.1 Composite spectra of 3C SiC; inference of thin-film thicknesses and band strengths
Thin film spectra of bulk -SiC may not be precisely equivalent to spectra of the wafer because the bulk sample is not stoichiometric (Speck & Hofmeister, 2004) and because it was difficult to create uncracked thin films of uniform thickness for this extremely hard material.
We instead compare absorption spectra of our wafer to thin-films of nanocrystalline -SiC (Fig. 3; data shown from Speck et al., 2005). In the thin-films, LO modes and shoulders are exaggerated due to a small proportion of the light crossing the film at non-normal incidence (see Berreman, 1965). Because the reflections mainly arise from the smooth, highly polished diamond faces of the sample holder, rather than from the relatively rough thin-film, and are included in the reference spectrum, accounting for SiC reflections does not provide results that are consistent with reflectivity measurements and analyses (see results for MgO by Hofmeister et al., 2003). Therefore, we compared the raw thin-film data directly to the single-crystal measurements. We did not directly compare our data to available absorption spectra from dispersions (e.g., Mutschke et al., 1999), because peak profiles are affected to an unknown degree by factors such as light leaking around grains (e.g., Hofmeister et al., 2000, 2001).
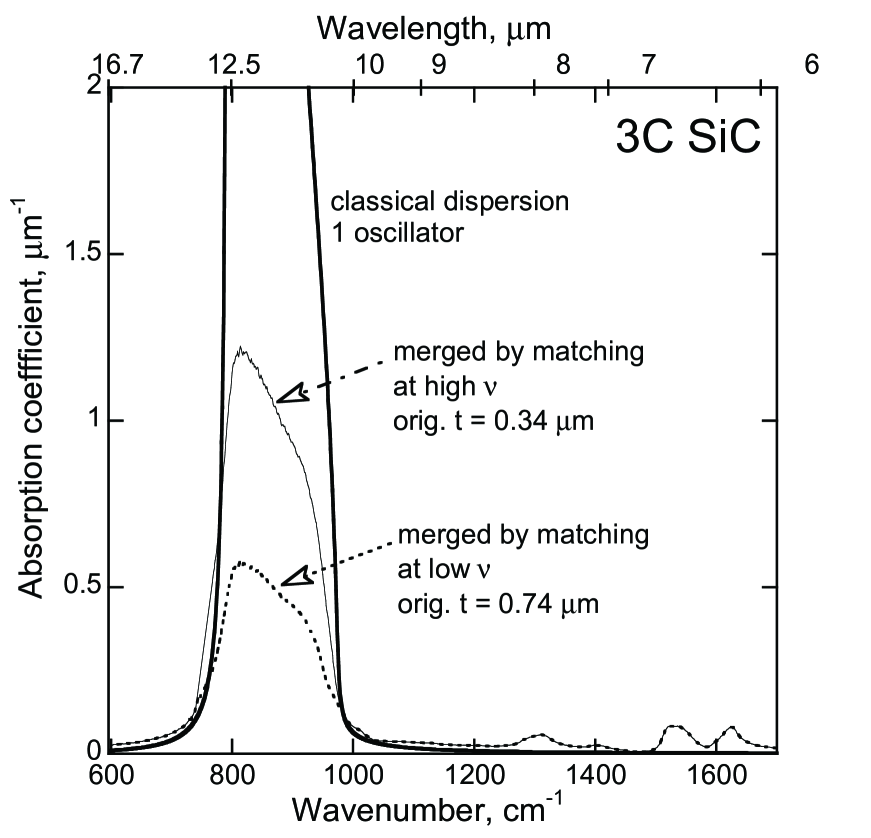
The thin-film data could be matched to the ideal absorption coefficient at either high or low frequency, but not at both. Fig. 3 therefore presents two possible merges for the SiC wafer and thin-film absorption spectra, one at 750 cm-1 and one at 1000 cm-1. Although inferred thicknesses for both merges agree with results for other minerals (Hofmeister et al., 2003; Hofmeister & Bowey, 2006), the high frequency merge (suggesting an original thickness of 0.34 m) is preferred because it gives more reasonable strengths for the overtones and is provided in electronic form (Table 3). Overtones were not seen in thin-film spectra and must be sufficiently weak to be hidden by noise or interference fringes. A thinner wafer is needed to reduce the ambiguity in merging spectra, thereby more accurately determining the thickness of the thin film, but it is difficult to grind samples to the ca. 5 m in thickness needed while maintaining parallel faces. Note also that our comparison of thin-film spectra to those of the wafer ignored the contribution of reflectivity as a function of frequency (see Eq. 2).
As a first approximation, the electronic file for the true absorption coefficient includes subtraction of 0.00145 m-1 which was computed from the reflectivity correction term in Eq. 2 using = 0.2 at 2500 cm-1. We neglect the frequency dependence of because for the thick, strongly absorbing samples the correction term is small.
4.1.2 Laboratory measurements vs. ideal absorption coefficients
Our merged -SiC absorbance spectra can be reconciled with the ideal absorption spectra derived from classical dispersion analysis of reflectivity (Part I), as follows. Due to light leaking through cracks in the thin-film, the main peak and 800–950 cm-1 is rounded. The merged absorbance spectra “fits” into the ideal absorption peak at about half-maximum. Excess intensity near the LO position is expected, due to non-normal beam incidence and possibly a wedge-shaped film (the diamond faces in the sample holder are not perfectly parallel). The excess intensity from the LO component also shifts the absorption maximum from the TO component towards the LO position, as seen in the comparison to the high frequency merged spectrum (Fig. 3). This comparison supports the lower value of the thickness (0.34 m), inferred through comparison in the previous section.
4.2 Near-IR absorptions of 6H samples
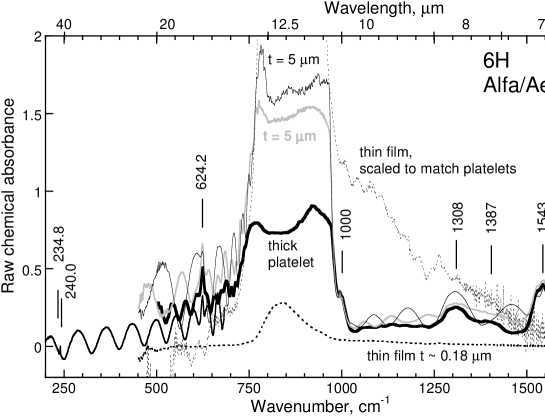
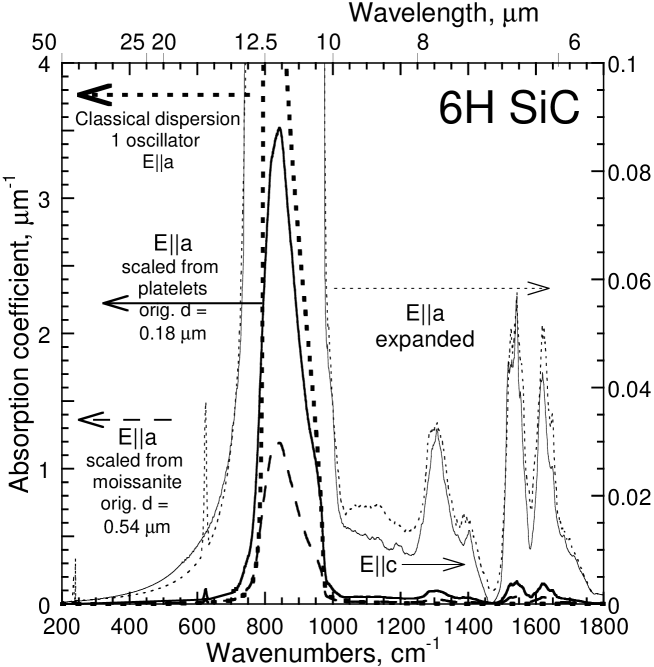
Figure 4 compares measured absorbance spectra from 6H platelets of various thicknesses to a thin-film made from the same material. The thin-film may contain some particles oriented with , but this situation is unlikely because crushing would flatten the platelets rather than reorient them. A small (below 5%) component of would not be detected.
Two platelets with measured thicknesses of 5 m gave slightly different absorbance spectra. Most of the differences are observed for the low intensity peaks and result from superposition of interference fringes on the weak peaks. Because the positions (spacing) and intensities of these interference fringes vary among the spectra taken from the three platelets, the weak overtone-combination modes can be discerned (Fig. 4). In addition, the far-IR data show some low frequency modes associated with zone folding (see Part I; Nakashima & Harima, 1997).
Variations seen in the height of the main peak originate in slight differences in thickness that are within the uncertainty of the measurements. The flat peaktops occur because of diffraction around the particles and because samples of this thickness are opaque at peak center, due to the combination of high reflectance and absorbance. Also, the peak height appears lower for the thick plate because of the combined effects of surface reflectance and stray light.
We also thinned the sample of moissanite and obtained absorption spectra for both polarizations for several thicknesses (Fig. 5). For the SiC platelets and moissanite, peak positions appear to be the same within uncertainties of 1-2 cm-1, depending on peak width. We therefore report peak positions in Table 2 obtained from the best resolved peaks in the moissanite spectra. Assignments are based on proximity of the peak positions obtained from summing the frequencies of the fundamental modes and on the shifts of peak positions between the two polarizations.
Based on binocular microscope and micrometer measurements, the thickness of the thinnest moissanite piece is constrained to be 85–90 m. In addition, the thickness of the thick platelet was uncertain because this sample was too small to measure using a micrometer, and the determination using the binocular microscope was suspect. By comparing the average of the two absorbance spectra obtained from two thin SiC platelets to the absorbance spectrum obtained from the thick SiC platelet (Fig. 4), we infer that the latter had a thickness of 22 m. Comparison with moissanite spectra gave a similar value. Note that Fig. 4 shows a scaled spectrum, not the absorbance for a 22 m section.
4.2.1 Cross-checks: comparing 6H and 3C SiC
Hexagonal forms of SiC frequently have stacking faults and twinning that could produce extra, internal reflections and affect extracted values of and . We therefore compared measured absorbance spectra of 3C SiC (Fig. 2) to those of our various 6H samples (Fig. 4 and Fig. 5). We found that peak positions and spectral profiles differed only slightly among the various orientations and layering arrangements, and thus internal reflections are not a concern for the thinner samples.
Similarity of the 3C to 6H spectra supports equivalence of spectra from the platelets and moissanite. The main difference in spectra occurs between the two polarizations of 6H and 3C largely results from the 10 cm-1 difference between the TO peak positions of Si-C fundamental stretch in the two orientations. Intensities and widths seem to not be strongly affected by structural form.
4.2.2 Composite spectra of 6H SiC; inferred thin film thicknesses and band strengths
Spectral segments with the highest resolution and least noisy peaks were merged to form the composite absorbance spectrum for over all wavelengths (Fig. 6), and for at high frequency. The merge suggests an original thickness of 0.54 m for the thin film and a thickness of 15 m for the thinnest platelets. The former value is consistent with the thickness inferred for the thin-film of the cubic SiC sample, whereas the latter value is outside the uncertainty of the determinations made with the binocular microscope. The overestimation in the latter value largely results from the data containing specular reflections that effectively increase the absorption. The fit within the peak envelope of the classical dispersion analysis is good. If instead we assume that the thicknesses of the platelets are correct (i.e., we use an average of two thicknesses that were measured as near 5 m), then the original film was 0.18 m thick and fits within the envelope except near the shoulders. The different thicknesses obtained for the thin film through comparison is largely connected with reflectivity not being subtracted.
The merged spectrum for the 0.54 m-thick sample is provided in electronic form (Table 4) for 6H because it is similar in thickness to the 3C film, and because we have only succeeded in making films as thin as 0.18 m for soft materials, which SiC is not. For this spectrum, we spliced in segments in the far-IR from Paper I’s classical dispersion analysis because our far-IR laboratory absorption data had strong fringes. Fringes are unavoidable because the sample thickness needed to resolve the far-IR peaks is optimal for creating fringes in this range (= 25–100 m). The fringes are very similar to peak widths in this spectral region which makes spectral subtraction or polynomial fitting difficult to perform accurately. Note that the fits are very close on the edges of the peaks. This spectrum can be multiplied by a factor of three, and still be within the uncertainties of our merge. However, the overtone region is best represented by the data as provided. For ideal values of , the results from classical dispersion (electronic Table 5) were substituted across the main peak.
4.3 SiC absorptions in the visible to UV
We studied a relatively thick 6H platelet using both the Bomem (FTIR) spectrometer and Nicolet-CCD spectrometer system. Data obtained from these two different instruments agree well for frequencies below 16,000 cm-1 (not shown). Above this frequency, high throughput and high sensitivity of available detectors overcome advantages of using an FT approach (e.g., Griffiths & deHaseth, 1986) and so we focus on results from the CCD spectrometer.
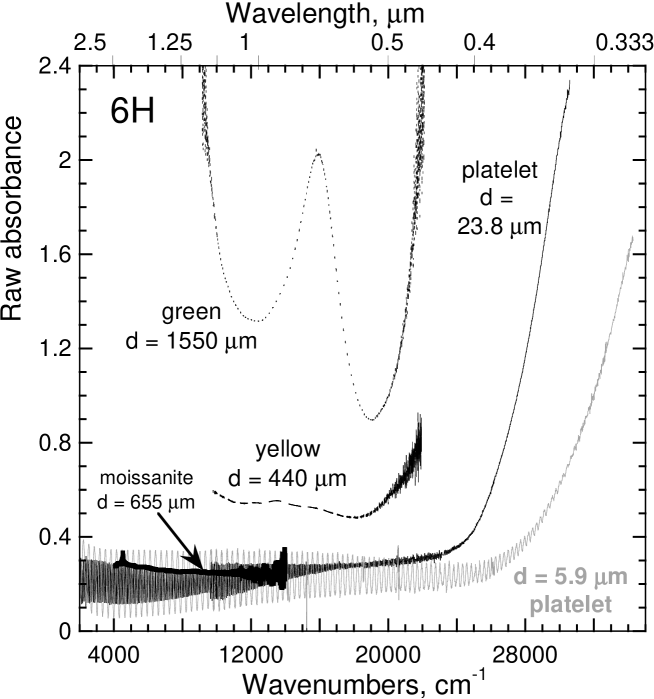
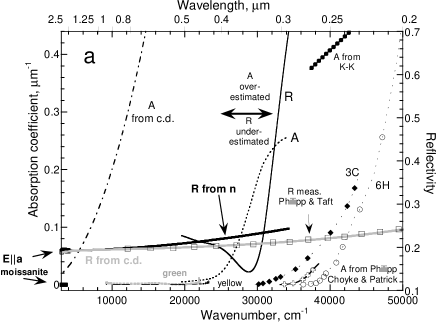
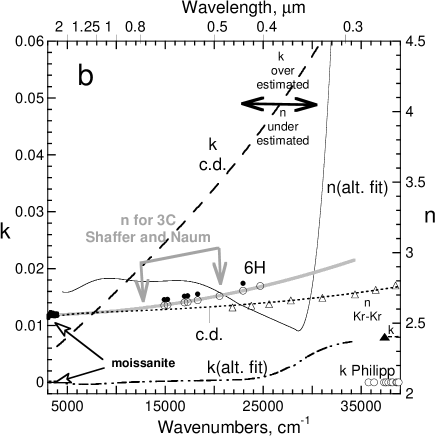
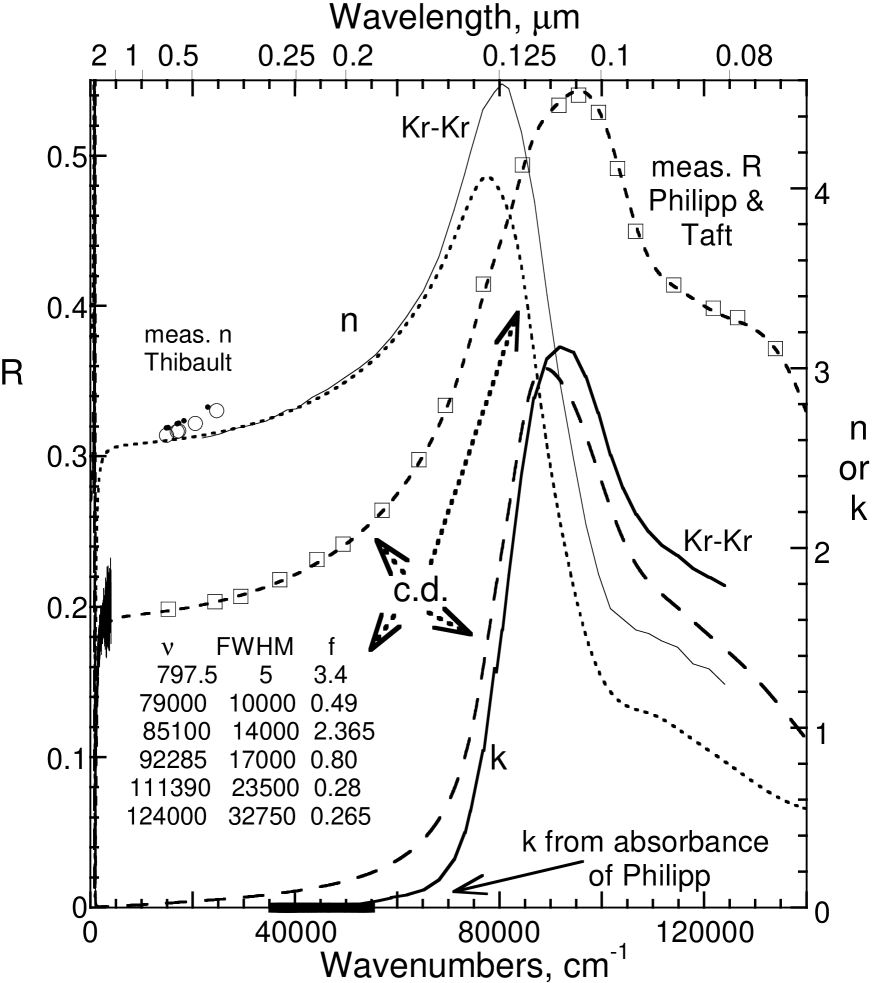
Raw data obtained from two 6H platelets with surfaces as grown (Fig. 7) contain interference fringes, the separation of which provides accurate thicknesses of 5.9 and 23.8 m, respectively. The absorbance of the thicker platelet is sufficiently high such that data acquisition was limited to . To avoid fringes in our derived optical functions, we fitted the results to 5th order polynomials above (not shown). To extrapolate data for the thick platelet up to 35,000 cm-1, we linearly fit absorbance of the thick platelet from 30,000 to 30,600 cm-1. This linear extrapolation provides the lowest possible values of at the highest frequency attained, and the largest values (Fig. 7). The variation is small, however, and all such fits agree with obtained by Philipp & Taft (1960) through Kramers-Kronig analysis of their UV reflectance data. Data on the platelets were also fit to higher (up to 9th) order polynomials and extended to lower frequencies, but the results (Fig. 8) were essentially the same. In all cases, calculated reflectivity is consistent with direct measurements and index of refraction measurements at the red end of the visible, with a dip occuring near 29,000 cm-1, and a steep rise to high frequency. There is some leeway in the fitting, which apparently underestimates and values and overestimates and in the calculations near 30,000 cm-1, and vice versa elsewhere.
4.3.1 Stoichiometry, impurity, and color effects
In this subsection, we use the observed spectral differences and the known connection of impurities with absorptions in the visible-UV region to ascertain trends. Colors of samples generally indicated the presence of impurities. The colors of our samples are listed in Table 1.
The steep rise in and for the SiC platelets into the UV above is due to the band gap in this semiconducting material. The spectral characteristics appear to be affected by non-stoichiometry and other types of impurities existing in these materials, as indicated by coloration. For example, absorption measurements of 6H by Philipp (1958) roughly agree with results by Choyke & Patrick (1957) for colorless samples, but their values are lower than extrapolation of our difference results for the tan platelets or with the trends for the yellow and green slabs.
A steep rise to the UV for our deeply colored green and yellow 6H SiC begins near 21,000 cm-1 whereas spectra for the yellow 3C sample of Philipp & Taft (1960) upturns near 32,000 cm-1, and spectra for their colorless samples upturn at 35,000–38,000 cm-1. The previous absorbance data were corrected for surface reflections using from microscopy. Although values from microscopy are slightly larger than the direct measurements (Fig. 8), small differences in give a negligible logarithmic correction term and are not important in determining . Also, the microscopy data were collected from colored SiC samples by Thibault (1944), which have higher and than the colorless variety. The platelets are actually fairly dark, because color is apparent at 25 m thicknesses, so it may not be valid to make a direct comparison to the previous data obtained from light colored samples (i.e. our darker samples contain more or different impurities). Given the steep rise for all samples, our linear extrapolation probably underestimated and overestimated above 31,000 cm-1 (Fig. 8), and the high-order polynomial fits are probably the better representation (Fig. 8). Nonetheless, the extrapolation in is consistent with that obtained from the Kramers-Kronig analysis of UV reflectance data for 6H SiC by Philipp & Taft (1960).
Note also that of 3C equals that of 6H SiC when light is polarized perpendicular to the crystal axis; this is consistent with behavior at longer wavelengths. All evidence points to impurities, not structure, being the main cause of variation in the visible-UV region, as expected because electronic transitions are excited at such high frequencies.
The difference method (§ 3) calculates a decrease in between 23,000 and 29,000 cm-1, which is not in accord with classical dispersion analysis. This behavior is an artifact and is possibly due to the impurity content of the two platelets differing. It is more likely that the surface smoothness differed slightly. Variation in the amount of scattering is the most likely explanation for the dip in . The steep rise in , however, is attributed to impurities, given the correlation in the upturn in with the intensity of coloration. Reflectance will also upturn as and are correlated. We propose that the impure samples have more band structure in the UV than does pure, stoichiometric SiC, and reflectance increases at lower frequencies for deep colors. The linear extrapolation underestimates and overestimates . This behavior and the trend in from microscopy of colored SiC suggests that impure, colored SiC samples have either an additional lower lying UV reflectivity band than the colorless variety, or perhaps that the entire band complex (Fig. 9) is shifted to lower frequency.
The similar raw absorbance obtained for both platelets and a much thicker moissanite sample (Fig. 7) is consistent with absorption coefficient being essentially negligible in the near-IR to visible region. For this case, limiting values (see § 3) are a better means of constraining optical functions than the difference method because errors result from subtraction of measured values of the absorbance that are very close to one another. First, absorbance and reflection measurements of the 2.91 mm moissanite crystal constrain and near 4000 cm-1 (Fig. 8). Second, additional constraints are provided by the very thick green and yellow 6H slabs (Fig. 7). The green 6H sample has a strong absorption feature near 16,000 cm-1 and the yellow 6H slab absorbs weakly in this spectral region. Absorption coefficients were calculated for the green and yellow 6H slabs by using 0.2 (Fig. 8, also see Part I), which is reasonable because varies little from 9000 to 23,000 cm-1. Agreement is good with the difference calculation (Fig. 8), especially below 16,000 cm-1 where the Bomem system operates well.
4.3.2 Classical dispersion analysis of previous UV reflectivity data
Reflection measurements of 6H by Philipp & Taft (1960) are consistent with a gradual increase in from moissanite measurements in the near IR. Kramers-Kronig analysis performed by Philipp (1958) gives values that are consistent with our difference method but that are much larger than the measurements of Philipp (1958). Because of this discrepancy, we performed a classical dispersion analysis (see Part I) of Philipp & Taft (1960)’s reflectivity data. Using five oscillators with positions, FWHM and oscillator strengths () shown in Fig. 9, we were able to reproduce their measurements as well as our values for of moissanite in the near IR. We found that the best fits were obtained by setting = 1.56. Measurements of are made in the visible region and do not offer an independent constraint. Although good agreement was obtained with Kramers-Kronig analysis at low frequency for , the results for are slightly lower than direct measurements of by microscopy (Fig. 8). Values for do not agree. When overlapping peaks are present, as is the case here, Kramers-Kronig analysis can fail, but the appearance of the optical functions does not suggest this is the case. Generally speaking, classical dispersion analysis is considered more trustworthy because it does not require extrapolation of from zero to infinity. The classical dispersion analysis provides much higher values of (Fig. 8) than even the difference method. Such high values are not correct given the available absorption data, and point to small errors existing in the absolute measurements of at low frequency, i.e., where the detector was least sensitive.
As discussed in § 4.2.1, stacking disorder occurs for hexagonal varieties of SiC. This presents a potential problem when measuring of 6H, because combined with small sample size it can lead to back reflections. Whichever of these problems exists is manifest at low frequency, where is lowest. Imperfections in surface polish are likely for the platelets. This inflates but not in the difference method. Errors in in the UV may also be instrumental effects for these very difficult, vacuum measurements. Absolute values for reflectivity also depend on the standard used for comparison (generally metallic silver).
4.3.3 Construction of high frequency optical functions for SiC
This section combines the available data to provide two sets of high frequency optical functions for SiC, one that represents stoichiometric, pure SiC, and another that represents impure SiC. Both sets are valid for the 3C structure and 6H with .
The starting point at 4000 cm-1 for pure and impure SiC is provided by our measurements of and for the 2.91 mm thick sample of moissanite. For impure SiC, electronic Table 7 is a linear interpolatation of from the moissanite value at 4000 cm-1 to for the platelets at 20,000 cm-1 obtained from applying the difference method to the low order polynomial and incorporates values obtained from as shown in Fig. 8 to 30,000 cm-1. The fit of Shaffer & Naum (1969) constrains from 10,000 to 30,000 cm-1 with linear interpolation below. Above 50,000 cm-1, Table 7 incorporates the classical dispersion analysis for and . Between 30,000 and 50,000 cm-1, linear interpolations were made.
For pure SiC in electronic Table 8, between 36,000 to 56,000 cm-1 is constrained using the absorbance of 6H -SiC measured by Philipp (1958), whereas classical dispersion analysis is used above 70,000 cm-1, and interpolation is made between the segments. For 10,000 cm-1, classical dispersion analysis is used, and interpolation to moissanite data is made below 4000 cm-1. Classical dispersion fits to Philipp & Taft (1960) UV reflectance measurements of 6H provides for extrapolation to infinity. For more accurate characterization of both impure and pure SiC, additional measurements of or of from gemmy, colorless moissanite are needed for both polarizations in the visible and UV.
5 Discussion
In carbon-rich dusty environments, SiC is one of only a few abundant dust species that exhibits an infrared spectral feature from which the physical parameters of these regions can be diagnosed (see Speck et al., 2009, and references therein). Consequently, SiC has been of great interest to researchers seeking to understand the evolution of the dust shells and infrared features of carbon stars and their successor, C-rich pre-planetary and planetary nebulae. Furthermore, the lack of observable SiC spectral features in the ISM has lead to many studies which place upper limits on its abundance (e.g., Whittet et al., 1990; Min et al., 2007; Kemper et al., 2004). Moreover, the occurrence of presolar SiC grains provides the link between dust production in aging stars (AGB stars and supernovae) and subsequent formation of planetary systems, and thus SiC serves as a tool for dust studies in many environments.
Astronomical studies of C-rich environments utilize two forms of laboratory data: (1) absorbance spectra, which are often converted to mass absorption coefficients for direct comparison to observational spectra, under the assumption that the grain-sizes and shapes of the laboratory samples are similar to those dispersed in space, and (2) optical functions, which are use in various radiative transfer models and in analyzing the effect of grain morphologies on spectral features, in which case single-reflection events are commonly assumed. In § 3–4, we presented absorption coefficients for single-crystal SiC samples with both 3C and 6H structural types and different amounts of impurities measured over a broader wavelength range. We focused on near-IR and visible frequencies because this region has been largely neglected. Merging our IR to UV measurements with previous far-UV data allowed us to provide continuous wavelength coverage for absorbance and optical functions of SiC, thereby permitting better constraints on its extinction for all astrophysical environments. To provide and over all wavelengths, we expanded upon work by Lipson (1960) and developed a method to extract optical functions from transmission measurements which to the best of our knowledge has not been used heretofore in astronomy. The basis is that reflection processes are an intrinsic part of transmission/absorption experiments (Fig. 1). In Section 4, we compared our new data with previous measurements at high (e.g., Philipp & Taft, 1960) and low (Part I) frequency, and found that values for optical functions are indeed high in the infrared. Through the comparison, we delineated the strong effects of polarization and impurities. This section discusses limitations of the method to derive and and astronomical implications of the method and our results.
5.1 Caveats in using difference method and limiting values to obtain ,
The difference method can be used to calculate and for any material from absorption measurements of crystals with different thicknesses. However, accurate values are obtained only under certain conditions. Except for thickness, the samples used must be identical: the orientation and impurity content must be the same, and the surface polish must be uniform for all samples. Imperfections in the surface polish do not seem to affect but alter from intrinsic values; this affects the calculated strongly and to a minor extent. In addition, the measured absorbance cannot be minuscule. For thin samples where is near zero, limiting values provide better constraints. Measuring absorbance of additional, larger crystals and obtaining independent measurements of the will constrain and at all frequencies above the main peak. Using large, single-crystals is the most accurate means of determining for wavelength regions in which is low. The difference method is particularly useful in the visible region, where absorbance is high but is low (see Eq. 5.)
We found that the best approach is to collect data from single-crystals of diverse thicknesses and to use both limiting values and the difference method. For SiC, our analysis was complicated by the variation in color (impurities) for our samples and those previously studied. Color differences clearly alter absorption coefficients in the visible-UV region. We provide end-member values for and , based on presence and absence of color. The difference methods and limiting values cannot be applied to measurements of powder dispersions (see § 5.2).
5.2 Why derived from thin film, powder dispersion, reflectivity measurements differ
Although is a material property and should in principle be independent of the method used to determine it, in practice, values of for any given substance are influenced by the experimental technique. The underlying problem is that laboratory studies do not directly measure absorption, but rather determine transmission which contains a reflection component, and, moreover, at any given wavelength, and are correlated. Near the frequencies where light is strongly absorbed, light is also strongly reflected. For SiC in particular, approaches 97% near of 10 m. Thus, at frequencies near the SiC fundamental mode, large particles are effectively opaque and the 3% of light that is transmitted is attenuated sufficiently that the small amount which emerges from the sample is within the noise level of detection. For SiC, particles with sizes near 1 m are effectively opaque. This size is consistent with grains in space and in powder dispersions used in laboratory studies. The effect creates non-linear dependence of transmission measurements, used to determine absorbance, on grain size for strong IR modes. For small-grain dipsersions (e.g., in a KBr pellet), the grains can clump, increasing the effective grain size to larger than the average created during grinding. This skews the grain-size distribution and makes a greater portion of the particles in the pellet effectively opaque, which is problematic as optically thin conditions are assumed in analyzing laboratory spectra.
Second, in addition to the processes of reflection and absorption, a non-negligible amount light is transmitted unattenuated through parts of the pellet matrix; powder dispersions transmit some unattenuated light at all frequencies because the particles do not completely cover the area. Such light leakage makes the fundamental peak in dispersion spectra of SiC both more rounded and lower in measured or derived values at peak center when compared to thin film spectra (Speck et al., 1999, 2005) or in ideal absorption coefficients (Part I). For detailed discussion of light leakage (see Hofmeister et al., 2001, 2003). SiC in particular is discussed by (Hofmeister et al., 2000).
The two effects combined mean that and thus (Eq. 5) obtained from powder dispersion methods is lower than the bulk grain-size independent property near the main peak obtained from reflectivity data. Measurements of from thin films are a little less than from reflectivity data, particularly at the main peak, but larger than from powder dispersions, because light leakage exists in the film, but is much less than in the dispersion. In essence, it is the presence of reflectivity in all types of absorption measurements that causes the variation in the derived values of from intrinsic, reflectivity measurements.
These differences between measurement techniques preclude the use of powder dispersions with the difference method because (1) the thickness of the material in a pellet sample is not well constrained; and (2) multiple reflections may occur from the particulates in the powder.
Consequently, thin film absorbance spectra offer an improvement over powder dispersion spectra (e.g., Hofmeister et al., 2001, 2003), but because film thickness is difficult to measure accurately, quantities such as , band strengths, and extinction coefficients are accompanied with experimental uncertainties. In this paper, we constrained thickness of films previously used to collect mid-IR data through comparison with near-IR spectra of single crystals. The resulting high values of for the main Si-C stretching mode support the results of Part I
The presence of reflections and light leakage in transmission measurements makes derivation of mass absorption coefficients from powder dispersion data highly uncertain. This problem is exacerbated by the potential effect of grain shape. Many astronomical studies use mass absorption coefficients obtained from powder dispersion data, , to estimate the relative abundances and total masses of dust species in a given circumstellar shell (e.g., Albrecht & Chini, 2000; Stevens & Gear, 2000; Kemper et al., 2002, 2004). In light of the limitations on using powder dispersions, the validity of these derived abundances is suspect.
Using the new optical functions presented here, it is possible to calculate for arbitrary grain sizes and grain shapes. Furthermore, the effect (or lack thereof) of impurities can be assessed. Thus the errors on previous derivations of abundances and dust masses can be estimated and true limits of these properties of dusty regions can be achieved.
5.3 Importance of reflectivity in modeling extinction in the near-IR to visible regions
In radiative transfer models, light that is extinguished by dust contains absorbing and scattering components.
This section shows how the Q factors are related to material properties for the spectral regions focused on in the present paper and ties our results to radiative transfer modeling.
The exact method by which -values are calculated varies, and the simplest case (spherical grains) uses Mie theory to compute these efficiency factors from the complex index of refraction (van de Hulst, 1981). It is unlikely that astrophysical grains are all spherical, and recent studies have investigated the effects of grain shapes on spectral features (e.g., Bohren & Huffman, 1983; Mutschke et al., 1999; Min et al., 2003; Andersen et al., 2006). However, the underlying relationship between the scattering and absorption efficiencies ( values) and laboratory measurements of , from which s are derived will apply to all grain shapes. Here we use Mie theory as an illustration.
From Mie theory:
| (10) |
| (11) |
where and is grain size. It is assumed that .
Using the definition = 1/ and Eq. 5 we obtain:
| (12) |
From Eqn. 5 and Figures 8 and 9, is near zero for the transmitting near-IR to visible region. In this region is small but finite and not very frequency dependent. Consequently, the denominator in Eq. 12 is near the constant 4, and the numerator is proportional to the product . Through this relationship between and , the low values of absorptivity control values of making it near zero in the near-IR to visible region. Thus, extinction is due to scattering, not absorption, over this particular spectral region.
To further probe the connection of radiative transfer with material properties, we simplify the expression for :
| (13) |
This is proportional to from eq. 7:
| (14) |
Again, in the near-IR to visible spectral region, is small but finite and weakly dependent on frequency. To first order, the numerator and denominator involving cancel, and in the near-IR to visible region is controlled by its strong dependence on frequency and by the specific values of . Our analysis shows that reflection is important in radiative transfer, not only in spectral regions where absorption dominates, but even more so in spectral regions characterized by weak to negligible absorptions. Constraining in the visible through laboratory measurements is important.
5.4 Potential uses of new data on and for SiC over the IR to UV
In Part I we provided quantitative mid-IR laboratory measurements of SiC, which already improved the data available for astronomers in a variety of dusty fields, most notably by including SiC, rather than the polytype, and by having truly grain-size independent data. However, the new data presented here augments Part I by extending the wavelength coverage blueward. This is important because SiC grains are found in environments where the radiation field is strong in visible or UV regions. Furthermore, our data show that while the main 11.3m peak may not be diagnostic of grain impurities, the UV absorption is.
In addition, it is now possible to use the SiC optical functions to analyze grain-size and grain-shape effects (c.f. Bagnulo et al., 1995; Speck et al., 2005). It has been suggested that there is an evolution in SiC grain sizes with the evolution of the star (Speck et al., 2005). Studies of the effect of grain size evolution have not been possible not only because of a lack of grain size independent data, but also because as the host stars evolve, the radiation field contains more high energy photons and the optical data needed for modeling has been lacking. Furthermore, the SiC feature prevalent in carbon star spectra becomes much less common as these stars progress to the end of the AGB phase and into the post-AGB and PNe phases.
Whereas SiC is commonly seen in C-star spectra, its occurrence in Galactic (Milky Way) planetary nebulae (PNe) is less common (Barlow, 1983; Rinehart et al., 2002; Casassus et al., 2001), even though C-stars evolve into C-rich PNe. However, evolution of these grains from the C-star to PNe phase is not understood, and other spectral features (e.g., m plateau due to PAH emission) may mask the SiC band (see Speck & Hofmeister, 2004). Even though SiC is apparently rare in Galactic PNe - there are a handful of examples. We need to include SiC optical functions into the models to see how much can be hidden.
This trend in the occurrence of the SiC feature from C-stars to pre-planetary nebulae and PNe is not echoed in recent studies of the LMC. The SiC feature remains observable, and thus including SiC into models of Magellanic cloud objects is essential. Knowledge of optical properties of SiC is essential to understanding dust formation in lower metallicity environments such as the Magellanic Clouds (MCs) and local group galaxies (Lagadec et al., 2007, 2008; Zijlstra et al., 2006; Speck et al., 2006; Sloan et al., 2008). Furthermore, recent observations of PNe in the Magellanic Clouds show that SiC features are much more common in these low metallicity environments (Stanghellini et al., 2007; Bernard-Salas et al., 2008). In addition, the recent discovery of extreme (optically-obscured) C-stars in the LMC shows that SiC absorption features also occur more often in these low metallicity environments (Gruendl et al., 2008). Understanding why SiC features are more common in these highly evolved carbon-rich environments than their Galactic counterparts requires reliable, grain-size-independent optical functions for SiC. Moreover, modeling of PNe requires wavelength coverage into the ultraviolet (UV) region, as this is where the radiation from the exciting central star peaks.
The fact that we can distinguish between samples of different purities based on the UV extinction has potentially far reaching consequences. In particular, the inclusion of SiC into dusty photo-ionization codes like MOCASSIN (Ercolano et al., 2005) and CLOUDY (Van Hoof et al., 2004) is desirable. It will be very interesting to see the impact of varying SiC purity on the overall outputs of these codes. Furthermore, the ability to use UV observations to determine the purity of the SiC grains provides a valuable test of the hypotheses put forward by Speck & Hofmeister (2004) on the “21m” feature, for example.
The changes in the UV absorption properties could potentially have huge impacts on hydrodynamic models of PNe shaping where the details of the interaction of light and dust grains is important.
6 Conclusions
We have discussed in detail the relationships between reflectance and transmittance measurements and how material properties such as optical functions can be extracted from such data. We emphasized that absorbance and absorption coefficients are derived, not measured, quantities, and that reflection plays a crucial role in both laboratory measurements and radiative transfer models.
Although absorbance can be compared directly to observational spectra in the IR, this does not take the effect of grain shape into account. The extracted and values can be used for more detailed analyses of astrophysical dust.
Reliable, grain-size/shape independent optical functions covering a broad wavelength range for a range of minerals is a growing need in the astronomy community. To address these needs,
-
1.
we have devised a new “difference” method, in order to obtain and from single-crystal absorption data. For spectral regions where both reflectivity and absorptivity are low but non-negligible, transmission data from two sections with different, known thicknesses reflect the same amount of light at the front and back surfaces, while simultaneously absorbing different amounts of light. The transmission data thus yield two equations with two unknowns, which can be solved uniquely for and . If used carefully, the difference method and use of limiting values can provide and over a broad wavelength range for astronomically relevant minerals using widely available transmission techniques.
-
2.
We presented new SiC absorbance data which both extends the coverage of existing data from IR to UV wavelengths and checks optical functions derived from reflectance measurements. To improve upon our previous thin-film IR data (Speck et al., 1999, 2005), we merged it with new single-crystal spectra at slightly higher frequencies, thereby constraining film thickness (after Hofmeister & Bowey, 2006) and allowing accurate extraction of . This also makes direct comparison with absorption coefficients extracted from reflectivity data in Pitman et al. (2008) possible.
-
3.
We implemented the difference method to provide IR to UV optical constants for SiC ( 1000 cm-1) for 6H SiC with . These data are also valid for 3C SiC, the structural type more dominant in astrophysical environments but are affected by impurity content at high frequency. Infrared peak positions for are shifted from those of 3C, particularly for the overtones, permitting the 6H species to be distinguished. We have thereby extended our previous reflectivity determinations of and for SiC into the UV spectral region. We also fitted available UV reflectivity to Lorentz oscillators as another check and to extend the frequency range.
-
4.
We provided detailed measurements on SiC overtone-combination bands, which are affected by structure and orientation. We have shown that the impure (colored) and pure varieties of commercially prepared SiC produce identical values just below the visible. We have also confirmed that the 3C spectrum is nearly identical to that of 6H when oriented with as determined in Pitman et al. (2008) for the fundamental frequency modes. Available data indicate that the equivalence holds for all spectral regions, if sample purity is the same.
Our new approach – the difference method – for extracting optical functions from transmission spectra can be applied to any material, not just SiC. Because transmission is easily and commonly measured, our difference method may be used to greatly expand the database of astronomically relevant near-IR to UV optical functions and aid implementation of radiative transfer models for many environments, not just C-stars.
References
- Albrecht & Chini (2000) Albrecht M., & Chini R., 2000, Meeting Abstract. Instituto de Radioastronomia Millimetrica (URAM), Universidad de Granada and Instituto de Astrofisica de Andalucia (IAA).
- Andersen et al. (2006) Andersen, A. C., Mutschke, H., Posch, Th., Min, M., & Tamanai, A. 2006, JQSRT, 100, 4
- Bagnulo et al. (1995) Bagnulo, S., Doyle, J. G. & Griffin, I. P. 1995, A&A, 301, 501.
- Barlow (1983) Barlow, M.J., 1983, in: Planetary nebulae; Proceedings of the Symposium, London, England, August 9-13, 1982 Dordrecht, D. Reidel Publishing Co., p. 105.
- Baron et al. (1987) Baron, Y., de Muizon, M., Papoular, R., Pégourié, B., 1987, A&A, 186, 271.
- Bernard-Salas et al. (2008) Bernard-Salas, J. et al., 2008, in prep.
- Bernatowicz et al. (2006) Bernatowicz, T. J., Croat, T. K. & Daulton, T. L. 2006, in Meteorites and the Early Solar System II, eds. D. S. Lauretta & H. Y. McSween, Jr. (University of Arizona Press, Tucson) 109.
- Berreman (1965) Berreman, R. G. 1963, Phys. Rev. 130, 2193.
- Bohren & Huffman (1983) Bohren, C. F., & Huffman, D. R. 1983, Absorption and Scattering of Light by Small Particles (John Wiley & Sons Inc., New York) 530.
- Boudet et al. (2005) Boudet, N. et al. 2005, ApJ, 633, 272.
- Casassus et al. (2001) Casassus, S., Roche, P. F., Aitken, D. K.,Smith, C. H., 2001, MNRAS, 327, 744.
- Chan & Kwok (1990) Chan, S.J., Kwok, S., 1990, A&A, 237, 354.
- Choyke & Patrick (1957) Choyke, W. J., & Patrick, L. 1957, Phys. Rev., 105, 1721.
- Clayton & Nittler (2004) Clayton, D. D., & Nittler, L. R. 2004, ARA&A, 42, 39.
- Ercolano et al. (2005) Ercolano, B., Barlow, M. J., & Storey, P. J. 2005, MNRAS, 362, 1038.
- Goebel et al. (1995) Goebel, J.H.,Cheeseman, P., Gerbault, F., 1995, ApJ, 449, 246. Rumyantsev, S. L. 2001, in Properties of Advanced Semiconductor Materials GaN, AlN, SiC, BN, SiC, SiGe, eds. M. E. Levinshtein, S. L. Rumyantsev & M. S. Shur (John Wiley & Sons, Inc., New York) 93.
- Goncharov et al. (2006) Goncharov, A. F., Struzhkin, V. V. & Jacobsen, S.D. 2006, Science, 312, 1205-1208.
- Griffiths & deHaseth (1986) Griffiths, P. R., & deHaseth, J. A. 1986, Fourier Transform Infrared Spectormetry (John Wiley & Sons, Inc., New York) 656 pp.
- Gruendl et al. (2008) Gruendl, R.A., et al., 2008, ApJ, 688, L9.
- Hackwell (1972) Hackwell, J. A. 1972, A&A, 21, 239.
- Harris (1995) Harris, G. L. 1995, Density of SiC, in Properties of Silicon Carbide. Ed. Harris, G.L., EMIS Datareviews Series, N13, 3.
- Hofmeister et al. (2000) Hofmeister, A. M., Rosen, L. J. & Speck, A. K. 2000, in ASP Conf. Ser. 196, Thermal Emission Spectroscopy and Analysis of Dust, Disks, and Regoliths, eds. M. L. Sitko, A. L. Sprague & D. K. Lynch, 291.
- Hofmeister et al. (2001) Hofmeister, A. M., Keppel, E., Bowey, J. E. & Speck, A. K. ISO beyond the peaks: The 2nd ISO workshop on analytical spectroscopy (ed. A. Salama, M.F. Kessler, K. Leech, B. Schulz), 343.
- Hofmeister et al. (2003) Hofmeister, A. M., Keppel, E., & Speck, A. K. 2003, MNRAS, 345, 16.
- Hofmeister & Bowey (2006) Hofmeister, A. M., & Bowey, J. E. 2006, MNRAS, 367, 577.
- Kemper et al. (2004) Kemper, F., et al., 2006, ApJ, 609, 806.
- Kemper et al. (2002) Kemper, F., Jäger, C., Waters, L. B. F. M., Henning, Th., Molster, F. J., Barlow, M. J., Lim, T., & de Koter, A. 2002, Nature, 415, 295.
- Knittle (1995) Knittle, E. 1995, In: Ahrens T J (ed.) Mineral Physics and Crystallography: A Handbook of Physical Constants. American Geophysical Union, Washington D.C., p. 98 142.
- Lagadec et al. (2007) Lagadec, E., et al. 2007, MNRAS, 376, 1270.
- Lagadec et al. (2008) Lagadec, E., et al. 2008, MNRAS, 383, 399.
- Lipson (1960) Lipson, H. G. 1960 In: O’Connor, J. R., & Smiltens, J. (eds.) Silicon Carbide. Permagon, New York, p. 371 375.
- Kim, Martin & Hendry (1994) Kim, S.-H., Martin, P. G., & Hendry, P. D. 1994, ApJ, 422, 164. 1987, ApJ, 322, 374.
- Mennella et al. (1998) Mennella, V. et al. 1998, ApJ, 496, 1058.
- Min et al. (2003) Min, M., Hovenier, J. W., de Koter, A., 2003, A&A, 404, 35.
- Min et al. (2007) Min, M., Waters, L. B. F. M., de Koter, A., et al. 2007, A&A, 462, 667.
- Mitra (1969) Mitra, S. S. 1969, In: Nudelman, S., & Mitra, S. S. (eds.) Optical Properties of Solids. Plenum Press, New York, p. 333-452.
- Mutschke et al. (1999) Mutschke, H., Andersen, A. C., Clément, D., Henning, Th. & Peiter, G. 1999, A&A, 345, 187.
- Nakashima & Harima (1997) Nakashima, S., & Harima, H. 1997, Physica Status Solidi (A), Applied Research, 162, 39.
- Philipp (1958) Philipp, H. R. 1958 Phys. Rev., 111, 440.
- Philipp & Taft (1960) Philipp, H. R., & Taft, E. A. 1960, In: O’Connor, J. R., & Smiltens, J. (eds.) Silicon Carbide. Permagon, New York, p. 366-370.
- Pitman et al. (2006) Pitman, K. M., Speck, A. K., & Hofmeister, A. M. 2006, MNRAS, 371, 1744.
- Pitman et al. (2008) Pitman, K. M., Hofmeister, A. M., Corman, A. B., & Speck, A. K. 2008, A&A, 483, 661.
- Rinehart et al. (2002) Rinehart, S. A., Houck, J. R., Smith, J. D., Wilson, J. C., 2002, MNRAS, 336, 66
- Shaffer (1971) Shaffer, P. T. B. 1971, Appl. Opt.,
- Shaffer & Naum (1969) Shaffer, P. T. B., & Naum, R. G. 1969, J. Opt. Soc. Am., 59, 1498.
- Sloan et al. (1998) Sloan, G.C., Little-Marenin, I.R., Price, S.D., 1998, AJ, 115, 809.
- Sloan et al. (2008) Sloan, G. C., et al. 2008, ApJ, in press.
- Speck et al. (1997) Speck, A.K., Barlow, M.J., Skinner, C.J., 1997, MNRAS, 288, 431-456.
- Speck et al. (1999) Speck, A. K., Hofmeister, A. M. & Barlow, M. J. 1999, ApJ, 513, L87.
- Speck & Hofmeister (2004) Speck, A. K., & Hofmeister, A. M. 2004, ApJ, 600, 986.
- Speck et al. (2005) Speck, A. K., Thompson, G. D. & Hofmeister, A. M. 2005, ApJ, 634, 426.
- Speck et al. (2006) Speck, A. K., Cami, J., Markwick-Kemper, C., et al. 2006, ApJ, 650, 892.
- Speck et al. (2009) Speck, A. K., Corman, A. B, Wheeler, C. H, Wakeman, K., & Thompson, G. D. 2009, ApJ, 691, in press.
- Spitzer et al. (1959) Spitzer, W. G., Kleinman, D. & Walsh, D. 1959, Phys. Rev., 113, 127.
- Stanghellini et al. (2007) Stanghellini, L., et al. 2007, ApJ, 671, 1669.
- Stevens & Gear (2000) Stevens J. A., & Gear W. K. 2000, MNRAS, 312, L5.
- Thibault (1944) Thibault, N. W. 1944, Amer. Mineral. 29, 327.
- Thompson et al. (2006) Thompson, G. D., Corman, A. B., Speck, A. K., & Dijkstra, C. 2006, ApJ, 652, 1654.
- Treffers & Cohen (1974) Treffers, R., & Cohen, M. 1974, ApJ, 188, 545.
- van de Hulst (1981) van de Hulst, H. C. 1981, Light Scattering by Small Particles, Dover Publications Inc., New York.
- Van Hoof et al. (2004) van Hoof, P. A. M., Weingartner, J. C., Martin, P. G., Volk, K., & Ferland, G. J. 2004, MNRAS, 350, 1330.
- Weingartner & Draine (2001) Weingartner, J. C., & Draine, B. T. 2001, ApJ, 548, 296.
- Whittet et al. (1990) Whittet, D. C. B., Duley, W. W. & Martin, P. G. 1990, MNRAS, 244, 427.
- Willem (1988) Willem, 1988, XXX
- Zijlstra et al. (2006) Zijlstra, A., et al. 2006, MNRAS, 370, 1961.
- Zubko et al. (2004) Zubko, V., Dwek, E., & Arendt, R. G. 2004, ApJS, 152, 211.

| Polytype | Mineral Name | Grain Size | Comments |
|---|---|---|---|
| -SiC | synthetic moissanite | diam. = 6.5 mm | round brilliant cut gem |
| -SiC | 6H-SiC (amber) | 2 m powder; surf. area g-1 | hexagonal plates; purity: 99.8% metals basis |
| -SiC | 6H-SiC (blue) | several mm per crystal | Intergrown crystals |
| -SiC | 6H-SiC (green) | diam. ca. 4 mm | layered hexagonal crystals |
| -SiC | 6H-SiC (yellow) | diam. ca. 8 mm | single crystal, some zoning |
| -SiC | 3C-SiC wafer (fcc cubic) | diam 5 m | CVD wafer purity: 99.9995% |
| -SiC | 3C-SiC gray (fcc cubic) | diam. 2.5–25 m | equant (spherical) chips |
| 3C | 6H | |||
|---|---|---|---|---|
| Mode Type | Calc. | Meas. | Calc.a | Meas.b |
| 3TA TO | 797 | 797.5 | 797 | 797.5 |
| LATA | 881 | 881 | 891 | — |
| TOFolded | n.a. | 1012 | 1022, 1037a | 1000 |
| TOTA | 1064 | 1077b | 1054,1064 | 1073 |
| LA2TA | 1147 | 1125b | 1157 | 1136b |
| 2LA | 1225 | 1207 | 1225 | 1194 |
| LOTA | 1239 | — | 1239 | — |
| TO2fold | n.a. | 1284 | 1272 | 1286 |
| TO2TA | 1329 | 1311s | 1319, 1329 | 1308s |
| ? | — | — | — | 1387 |
| TOLA | 1413 | 1402s | 1413, 1423 | 1404, 1412a |
| 2LATA | 1496 | — | 1516 | — |
| LOTA | 1505 | 1525s | 1500, 1505 | 1520, 1526 |
| ? | — | 1535b | — | 1543 |
| LOLA | 1588 | — | 1583,1588 | 1555,1560 |
| 2TO | 1595 | 1625s | 1575, 1595 | 1618, 1620s |
| ? | — | — | — | 1648 |
| TOTALA | 1678 | — | 1678, 1688 | 1683, 1700 |
| 2TA2LA | 1762 | 1716 | 1782 | 1713,1720b |
| LOTALA | 1854 | — | 1860, 1864 | — |
| 2TOTA | 1861 | 1920b | 1841, 1861 | 1876, 1890b,s |
| ? | — | — | — | 1897 s |
| TO2LA | 2027 | — | 2037, 2047 | 1980, 1990 |
| 2TO2TA | 2128 | 2079 | 2108, 2128 | 2076, 2080s |
| 2TOLA | 2209 | 2182b | 2210, 2219 | 2179b |
| TOLO2TA | 2302 | 2297s | 2287, 2297 | 2286, 2297s |
| 3TO | 2392 | 2396 | 2364, 2392 | 2388, 2394s |
| 2TOLATA | 2475 | 2487 | 2465, 2485 | 2477, 2480 |
-
Notes: b broad, s strong, n.a. not applicable. “Calc” values based on fundamental frequencies (Part I, Nakashima & Harima 2000), summarized as follows in (cm-1) ( in m = 10,000/): TA = 266 in 3C, also at 234.8 and 244 in 6H; LA = 614.4 in 3C, or 624.4 in 6H; TO = 797.7 in 3C, 797.5 for , 787.8 for ; LO = 973 in 3C, 975 for , 970 for . 6H also has modes at 883.7 and 888.5 for .
-
a
For 6H calculated, if two entries are given, the lower frequency value pertains to . Modes marked or are found only when is oriented parallel or perpendicular to the c-axis. Unmarked entries indicate that the same frequency exists in both polarizations.
-
b
For the measured modes of 6H, modes in both polarizations are unmarked. If two entries are given, the lower frequency value pertains to ; for these split modes, entries having lower values in confirm involvement of the TO or LO components.
| Wavenumber | Absorption Coefficient |
|---|---|
| (cm-1) | (m-1) |
| 401.12 | -0.0054155 |
| 402.09 | -0.12127 |
| 403.05 | -0.071841 |
| 404.02 | -0.042450 |
| 404.98 | 0.70815 |
| 405.94 | 0.035504 |
| 406.91 | -0.057883 |
| 407.87 | 0.060957 |
| 408.84 | 0.027782 |
| 409.80 | -0.0026673 |
| ∗Table continued as electronic-only file. |
| Wavenumber | Absorption Coefficient |
|---|---|
| (cm-1) | (m-1) |
| 3.0000 | 0.00020004 |
| 4.0000 | 0.00020007 |
| 5.0000 | 0.00020012 |
| 6.0000 | 0.00020017 |
| 7.0000 | 0.00020023 |
| 8.0000 | 0.00020030 |
| 9.0000 | 0.00020038 |
| 10.000 | 0.00020047 |
| 11.000 | 0.00020056 |
| 12.000 | 0.00020067 |
| ∗Table continued as electronic-only file. |
| Wavenumber | Absorption Coefficient |
|---|---|
| (cm-1) | (m-1) |
| 2.0000 | 3.0000 |
| 3.0000 | 7.0000 |
| 4.0000 | 1.2000 |
| 5.0000 | 1.8000 |
| 6.0000 | 2.7000 |
| 7.0000 | 3.6000 |
| 8.0000 | 4.7000 |
| 9.0000 | 6.0000 |
| 10.000 | 7.4000 |
| 11.000 | 9.0000 |
| ∗Table continued as electronic-only file. |
| Wavenumber | ||
|---|---|---|
| (cm-1) | ||
| 4000.0 | 2.5574 | 6.0687 |
| 4001.0 | 2.5574 | 6.0676 |
| 4051.0 | 2.5575 | 6.0984 |
| 4101.0 | 2.5576 | 6.1292 |
| 4151.0 | 2.5578 | 6.1599 |
| 4201.0 | 2.5579 | 6.1907 |
| 4251.0 | 2.5580 | 6.2215 |
| 4301.0 | 2.5581 | 6.2523 |
| 4351.0 | 2.5583 | 6.2830 |
| 4401.0 | 2.5584 | 6.3138 |
| ∗Table continued as electronic-only file. |
| Wavenumber | ||
|---|---|---|
| (cm-1) | ||
| 4001.0 | 2.5501 | 6.0687 |
| 4051.0 | 2.5508 | 6.0591 |
| 4101.0 | 2.5515 | 6.0495 |
| 4151.0 | 2.5522 | 6.0400 |
| 4201.0 | 2.5529 | 6.0304 |
| 4251.0 | 2.5535 | 6.0209 |
| 4301.0 | 2.5542 | 6.0113 |
| 4351.0 | 2.5548 | 6.0017 |
| 4401.0 | 2.5553 | 5.9922 |
| 4451.0 | 2.5559 | 5.9826 |
| ∗Table continued as electronic-only file. |