Dirac Fermions in Graphite: the State of Art
Abstract
Macroscopic concentration of massless charge carriers with linear conic spectrum - Dirac Fermions (DF) was shown in 2004 to exist in Highly Oriented Pyrolytic Graphite (HOPG) and governs its electronic properties. These carriers can have the same nature as DF observed in graphite monolayer (Graphene) and let to view HOPG as superposition of 2D carbon layers, almost independent electronically. We overview here the recent experimental evidences of 2D Dirac Fermions in Graphite and their similarity with carriers in Graphene.
keywords:
Graphite, Graphene, Dirac Fermions, Quantum Hall EffectPACS:
81.05.Uw , 71.20.-b, and
1 Do Dirac Fermions present in graphite
Recent synthesis of graphite monolayer (Graphene) [1, 2] activated study of several challenging fundamental problems in Solid State Physics related with electronic properties of semimetals i.e. systems in which several branches of the spectrum cross close to Fermi level. It was recognized since a long time [3] and confirmed experimentally recently [1, 2] that peculiarity of electrons in graphite monolayer consists in the particular linear spectrum of charge carriers expanding in vicinity of the corner point K of the hexagonal Brillouin zone (BZ), similar to the conical dispersion of massless Dirac Fermions (DF) in 2D Quantum Electrodynamics.
Note however that according to the tight-binding calculations [4], the linear Dirac spectrum is the specific property of Graphene. Already the bilayer graphite films have the electronic dispersion that is presented as junction of up- and down curved parabolas. Although the Dirac-like branches can also appear in the n-layered () graphite, their relative phase volume is negligible and no manifestation of DF should be observed.
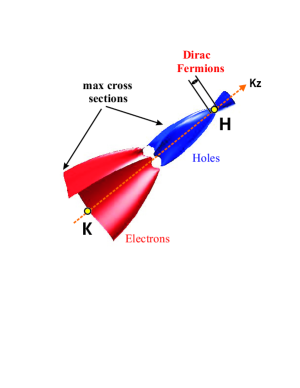
At large the multilayered system recovers the properties of bulk graphite and the classical Slonzewski, Weiss and McClure (SWM) band model [5] should be applicable. According to this model the Fermi surface (FS) of graphite is expanded around z-directed K-H edge of 3D BZ and have two almost compensated electron and hole pockets as shown in Fig. 1. The perpendicular Dirac-like dispersion exists only in the immediate vicinity of the point H and therefore the relative concentration of DF should be negligibly small.
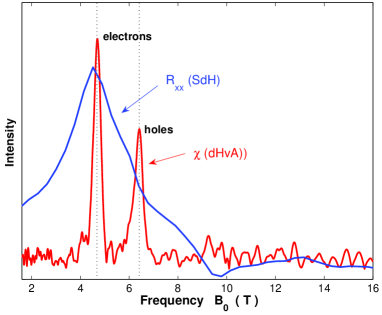
Two majority groups of carriers seen by many researchers in de Haas van Alphen (dHvA) quantum-oscillation experiments in 50’s-60’s [3] (cf. also Fig. 2) were naturally attributed to the maximal electron- and hole- cross sections of FS pockets, but no definite conclusion about their spectrum (Dirac or massive) was done.
In the beginning of 2004, basing on the phase analysis of Shubnikov de Haas (SdH) and dHvA oscillations in bulk Highly Oriented Pyrolytic Graphite (HOPG) two of us (IL&YK ) discovered that one of these groups corresponds to the macroscopic quantity of DF [6]. Evident discrepancy with SWM 3D band model concerning the quantity of DF in graphite let to the alternative view of graphite as the stack of almost independent mono- and multi- 2D carbon layers.
Since then, several independent confirmation of existence of DF in graphite where done. The objective of this communication is to overview the most important experimental results that let to judge about the nature of charge carriers in graphite.
2 Dirac Fermions from quantum oscillation
Most of the methods permitting to distinguish between normal (massive) carriers and DF are based on Landau Level (LL) quantization in magnetic field. In the massive case the equidistant LLs
| (1) |
are separated by the gap from whereas in the Dirac-like case the square root dependence takes place:
| (2) |
and the lowest LL is located exactly at . This, in particularly, leads to the difference in Bohr-Sommerfeld semiclassical quantization:
| (3) |
for which for massive carriers and in the Dirac case [7]. This factor is uniquely related to the topological Berry phase (with (mod 2)) acquired by a fermion, moving around [7] and is manifested experimentally as the phase in SdH oscillations of conductivity
| (4) |
or in another quantum oscillations. (FS dependent factor )
Determination of from SdH and dHvA oscillations was the base of our phase analysis [6]. Since, as was already mentioned, two majority groups of carriers are present in graphite (Fig. 2), we first filtered the oscillating signal from each of them and then measured their phases separately. Moreover, comparison of SdH and dHvA experiments let us to determine the sign of carriers. Conclusion was that, the lower-frequency peak in Fig. 2 corresponds to massive electrons whereas the higher-frequency peak to Dirac holes. Coincidence of results of SdH and dHvA phase analysis shows that existence of DF in graphite is the bulk and sample-independent effect.
Contradiction with band theory is not only in the predicted by SWM model massive character of both groups of carriers [8] (their maximal cross sections , are far from Dirac point H, see Fig. 1), but also in the inverse order of proportional to and oscillation frequencies: it was previously assumed [3] that .
3 Landau Level spectroscopy
Alternative way to distinguish between different types of carriers is the direct determination of the energy distribution of quantized LLs. In case of massive carriers the inter-LL distance scales linearly with as in Eq. (1) whereas in the Dirac-like case as as in Eq. (2).
Low temperature (4K) Scanning Tunnelling Spectroscopy (STS) measurements on the surface of HOPG in fields up to 12 Tesla were performed to test such LLs energy distribution [9]. It was discovered that the resulting signal reveals the traces of both massive and massless LLs, that agrees with our phase analysis Unfortunately the natural restriction of STS measurements over the sample surface permits also the alternative interpretation of the origin of DF as due to the surface effects [9].
Another measurements of LLs distribution in graphite (both in HOPG and in natural) that are free from the mentioned above surface sensitivity were done using the Far-Infrared (FIR) magneto-transmission spectroscopy [10] in which the absorbtion lines correspond to the optical transition between different LLs. Two series of LLs with normal and Dirac-like quantization in were found and attributed to point K and H of 3D BZ in SWM band model. The density of DF was found to be smaller then that, extracted from analysis of SdH oscillations [6].
Although authors of [10] agree that the dominant transitions in the Dirac series of absorbtion lines have their counterpart in the FIR spectra of graphene [11], they believe that the 3D band model is more adequate to describe the situation because of observation of the weak series of additional transitions, forbidden in pure 2D case. Note however that in this case one more series of FIR transitions, corresponded to the maximal cross section of the hole FS pocket (Fig. 1) with massive LL quantization should be observed.
4 Angle Resolved Photoemission
Coexisting of massless DF with quasiparticles with finite effective mass in graphite was also proven by Angle Resolved Photoemission Spectroscopy (ARPES) [12]. This method is the most direct and unique tool to measure the electronic structure with both energy and momentum information. The electronic spectrum was scanned in the inverse space of BZ in vicinity of points K and H in the direction. The electronic dispersion was shown does correspond to the massive carriers in K-point and to DF in H-point as was predicted by SWM band model.
Although ARPES measurements convincingly demonstrate the presence of DF in graphite, no further information about their quantity and macroscopic properties can be extracted. To know their concentration and to check the validity of the assumed in [12] 3D band model the further scans in direction along whole K-H edge are required.
5 2D Transport and Quantum Hall Effect
To give more insight in favor of 2D independent layered structure of graphite we refer on another group of experiments. Note first that because of the extremely high out- to in- plane transport anisotropy in HOPG: [13] (instead of as was measured for some graphite crystals [3]) it is unlikely that out-of-plane transport can be explained within the inter-plane hopping of SWM model. Moreover, the characteristic property of 2D conducting systems - the Quantum Hall Effect (QHE) has been discovered in 2003 in HOPG [13].
Careful analysis of QHE staircase in HOPG [14] shows that it contains the precursors of both QHE discovered in graphene [1, 2] and in bilayer graphite [15], having the semi-integer (Dirac) [16, 17] and integer (massive) [18] LL quantization correspondingly. Order and appearance of normal and Dirac steps in HOPG depends on the sample [19] and sometimes coincides with QHE staircase observed in few-layer graphite sample [20]. Such behavior confirm the hypothesis that bulk graphite is a system randomly composed of single- and few- carbon layers.
6 Raman fingerprint of Graphene in graphite
Next, we present the results of our recent micro-Raman testing of the best (in 2D transport sense) HOPG samples. (The details will be published elsewhere.) Raman study of the second order peak ”2D”, which is provided by specific to Dirac spectrum double-resonance electron transitions [21], is known to be the best tool to distinguish the mono- and multilayered graphite films [22].
Shown in Fig. 3 the upper left-shoulder-peak ”2D” in bulk graphite is indeed very different from lower, specific only to monolayer the single-Lorentzian peak of graphene [22]. Two middle plots correspond to our micro-Raman testing of HOPG with different position of few-micron laser spot on the surface.
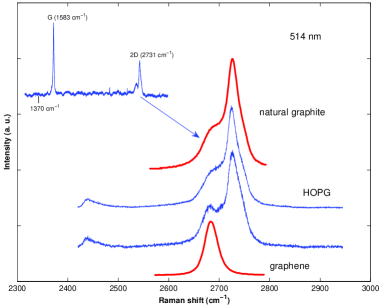
Surprisingly we found that depending on the spot position, the classical graphite peak can demonstrate the growing fingerprint feature of graphene. Because of several microns laser penetration length, such effect can be explain only by existence of macroscopic number of independent graphene layers in bulk of HOPG. Since this conclusion is coherent with other considered above experimental facts we can express even more general hypothesis that left shoulder in peak ”2D” in graphite is provided in total by the presence of graphene monolayers in the bulk.
7 Conclusion
Retrospective overview of the experimental data let to believe that macroscopic concentration of DF does exist in the bulk of graphite. Since this conclusion contradicts to classical SWM band model, further experimental and theoretical efforts should be done to clarify their nature. It is of primary importance to understand, whether the modified band theory should be constructed to explain the existence of DF or indeed, graphite can be viewed as the system of independent mono- and multi carbon layers as proposed in the present article.
This work was supported by French-Brazilian exchange program CAPES-COFECUB, by the ANR grant LoMaCoQuP (France) by agencies CNPq, FAPESP (Brazil) and by project ROBOCON of EU F7 IRSES program.
References
- [1] K. S. Novoselov, A. K. Geim, S. V. Morozov et al., Nature (London) 438, 197 (2005).
- [2] Y. Zhang, Y.-W. Tan, H. L. Stormer, and Philip Kim, Nature (London) 438, 201 (2005).
- [3] N. B. Brandt, S.M. Chudinov and Ya. G. Ponomarev, Semimetals I. Graphite and its Compounds, Amsterdam, (1988); B. T. Kelly, Physics of Graphite, Appl. Sci. Publ., London and New Jersey, 1981 and refs. therein.
- [4] B. Partoens and F. M. Peeters, Phys. Rev. B 75, 193402 (2007)
- [5] J. C. Slonczewski and P. R. Weiss, Phys. Rev. 109, 272 (1958); J. W. McClure, Phys. Rev. 119, 606 (1960)
- [6] I. A. Luk’yanchuk and Y. Kopelevich, Phys. Rev. Lett. 93, 166402 (2004).
- [7] G. P. Mikitik and Yu.V. Sharlai, Phys. Rev. Lett. 82, 2147 (1999).
- [8] G. P. Mikitik and Y. V. Sharlai, Phys. Rev. B 73, 235112 (2006).
- [9] G. Li and E.Y. Andrei, Nature Phys., 3, 623 (2007)
- [10] M. Orlita, C. Faugeras, G. Martinez et al., Phys. Rev. Lett. 100, 136403 (2008) and Preprint arXiv:0805.0553 (2008)
- [11] M. L. Sadowski, G. Martinez, M. Potemski et al., Phys. Rev. Lett. 97, 266405 (2006); Z. Jiang, E. A. Henriksen, L. C. Tung, et al., Phys. Rev. Lett. 98, 197403 (2007)
- [12] S. Y. Zhou, G.-H. Gweon and A. Lanzara, Annals of Physics 321, 1730(2006) and S. Y. Zhou, G.-H. Gweon, J. Graf et al. Nature Phys. 2, 595 (2006).
- [13] Y. Kopelevich, J.H.S. Torres, R.R. da Silva, et al., Phys. Rev. Lett. 90, 156402 (2003).
- [14] I. A. Luk’yanchuk and Y. Kopelevich, Phys. Rev. Lett. 97, 256801(2006)
- [15] K. S. Novoselov, E. McCann, S. V. Morozov et al. Nature Physics 2, 177 (2006).
- [16] V. P. Gusynin and S. G. Sharapov, Phys. Rev. Lett. 95, 146801(2005).
- [17] N. M. R. Peres, F. Guinea, and A. H. Castro Neto, Phys. Rev. B 73, 125411 (2006).
- [18] E. McCann and V. I. Fal’ko, Phys. Rev. Lett. 96, 086805 (2006).
- [19] Y. Kopelevich and P. Esquinazi, Adv. Materials 19, 4559 (2007).
- [20] K. S. Novoselov, A. K. Geim, S. V. Morozov et al., Science 306, 666 (2004).
- [21] C. Thomsen and S. Reich, Phys. Rev. Lett. 85, 5214 (2000).
- [22] A. C. Ferrari, J. C. Meyer, V. Scardaci, et al., Phys. Rev. Lett. 97, 187401 (2006).