The VLA survey of the Chandra Deep Field South III: X–ray spectral properties of radio sources

P. Tozzi11affiliation: INAF Osservatorio Astronomico di Trieste, via G.B. Tiepolo 11, I–34143, Trieste, Italy , V. Mainieri22affiliation: ESO, Karl-Schwarzschild-Strasse 2, D-85748 Garching, Germany , P. Rosati22affiliation: ESO, Karl-Schwarzschild-Strasse 2, D-85748 Garching, Germany , P. Padovani22affiliation: ESO, Karl-Schwarzschild-Strasse 2, D-85748 Garching, Germany , K. I. Kellermann33affiliation: National Radio Astronomy Observatory, 520 Edgemont Road, Charlottesville, VA, 22903–2475, USA , E. Fomalont33affiliation: National Radio Astronomy Observatory, 520 Edgemont Road, Charlottesville, VA, 22903–2475, USA , N. Miller33affiliation: National Radio Astronomy Observatory, 520 Edgemont Road, Charlottesville, VA, 22903–2475, USA 44affiliation: Dept. of Physics and Astronomy, The Johns Hopkins University, Baltimore, MD 21218, USA , P. Shaver22affiliation: ESO, Karl-Schwarzschild-Strasse 2, D-85748 Garching, Germany , J. Bergeron55affiliation: Institut d’Astrophysique de Paris, 98bis Boulevard, F-75014 Paris, France , W.N. Brandt66affiliation: Department of Astronomy & Astrophysics, 525 Davey Lab., The Pennsylvania State University, University Park, PA 16802, USA , M. Brusa77affiliation: Max–Planck–Institut für extraterrestrische Physik, Giessenbachstraße, PF 1312, 85741 Garching, Germany , R. Giacconi44affiliation: Dept. of Physics and Astronomy, The Johns Hopkins University, Baltimore, MD 21218, USA , G. Hasinger77affiliation: Max–Planck–Institut für extraterrestrische Physik, Giessenbachstraße, PF 1312, 85741 Garching, Germany , B.D. Lehmer88affiliation: Department of Physics, University of Durham, Durham, DH1 3LE, UK , M. Nonino11affiliation: INAF Osservatorio Astronomico di Trieste, via G.B. Tiepolo 11, I–34143, Trieste, Italy , C. Norman44affiliation: Dept. of Physics and Astronomy, The Johns Hopkins University, Baltimore, MD 21218, USA , and J. Silverman77affiliation: Max–Planck–Institut für extraterrestrische Physik, Giessenbachstraße, PF 1312, 85741 Garching, Germany 99affiliation: Institute of Astronomy, Department of Physics, Eidgenössische Technische Hochschule, ETH Zurich, CH8093, Switzerland
Abstract

We discuss the X–ray properties of the radio sources detected in a deep 1.4 and 5 GHz VLA Radio survey of the Extended Chandra Deep Field South (E-CDFS). Among the 266266266 radio sources detected, we find 89 sources (1/3 of the total) with X–ray counterparts in the catalog of the 1Ms exposure of the central 0.08 deg2 (Giacconi et al. 2002; Alexander et al. 2003) or in the catalog of the 250 ks exposure of the 0.3 deg2 E-CDFS field (Lehmer et al. 2005). For 76 (85%) of these sources we have spectroscopic or photometric redshifts, and therefore we are able to derive their intrinsic properties from X–ray spectral analysis, namely intrinsic absorption and total X–ray luminosities. We find that the population of submillijansky radio sources with X–ray counterparts is composed of a mix of roughly 1/3 star forming galaxies and 2/3 AGN.

The distribution of intrinsic absorption among X–ray detected radio sources is different from that of the X–ray selected sample. Namely, the fraction of low absorption sources is at least two times larger than that of X–ray selected sources in the CDFS. This is mostly due to the larger fraction of star forming galaxies present among the X-ray detected radio sources. If we investigate the distribution of intrinsic absorption among sources with LX>1042subscript𝐿𝑋superscript1042L_{X}>10^{42} erg s-1 in the hard 2–10 keV band (therefore in the AGN luminosity regime), we find agreement between the X–ray population with and without radio emission. In general, radio detected X–ray AGN are not more heavily obscured than the non radio detected AGN. This argues against the use of radio surveys as an efficient way to search for the missing population of strongly absorbed AGN.

For the radio sources without cataloged X–ray counterparts, we measure their average photometric properties in the X–ray bands with stacking techniques. We detect emission with very high confidence level in the soft band and marginally in the hard band. Given their redshift distribution, the average X–ray luminosity of these sources is consistent with being powered by star formation. We note that on average, the spectral shape of our radio sources is soft with HR0.5similar-to𝐻𝑅0.5HR\sim-0.5 and constant in different bins of radio flux. This results shows that the statistics do not indicate a significant trend in the average X–ray spectral properties, but it is consistent with the radio source population being dominated by star forming galaxies below 100100100 μ𝜇\muJy, as shown by our morphological and multiwavelength analysis presented in Mainieri et al. (2008) and Padovani et al. (2009).

Radio: surveys – X-rays: surveys – cosmology: observations – X–rays: galaxies – galaxies: active

1 Introduction

Among the most fundamental issues in astrophysics are when and how galaxies formed and how they evolved with cosmic time. In particular, it is crucial to understand the relation between the star formation processes and the mass accretion history onto the central supermassive black holes in elliptical galaxies and the bulges of spirals, as traced by the tight relation between the mass (or the velocity dispersion) of the bulges and the mass of the supermassive black holes associated with the Active Galactic Nucleus phase (Kormendy & Richstone 1995; Magorrian et al. 1998). Since these processes have different signatures throughout the electromagnetic spectrum, multiband observations are needed to unravel the complex history.

In particular, deep multiwavelength surveys help to reconstruct the cosmic evolution of AGN and star formation processes. In this respect, X–ray and radio emission are good tracers of both processes. The radio properties of the X–ray population found in deep surveys have been studied in a few papers based on VLA data in the Chandra Deep Field North (CDFN; Richards et al. 1998; Richards 2000; Bauer et al. 2002; Barger et al. 2007), combined MERLIN and VLA data in the CDFN region (Muxlow et al. 2005), and ATCA data in the Chandra Deep Field South (CDFS; Afonso et al. 2006; Rovilos et al. 2007). Deep radio surveys are also realized in shallower but wider X–ray fields like COSMOS (see Schinnerer et al. 2007; Smolcic et al. 2008a; 2008b). In this Paper, we use the deep radio data obtained with the VLA in the CDFS and Extended Chandra Deep Field South (E-CDFS) fields. The comparison of the properties of the radio sources (whose catalog is presented in Kellermann et al. 2008, hereafter Paper I) and of the X–ray sources (see Giacconi et al. 2002; Alexander et al. 2003; Lehmer et al. 2005) allows us to characterize both processes over a wide range of redshifts.

In this Paper we present a systematic study of the X–ray properties of the radio sources in the CDFS radio catalog. The radio catalog includes 266 sources (see Paper I) and constitutes one of the largest and most complete samples of μ𝜇\muJy sources in terms of redshift information. We have redshifts for 186 (70similar-toabsent70\sim 70%) of the sources, 108 spectroscopic and 78 photometric. We have reliable optical/near–IR identifications for 94% of the radio sources, and optical morphological classifications for similar-to\sim 61% of the sample. Optical and near–IR properties of the radio sources are discussed by Mainieri et al. (2008, hereafter Paper II), while a multiwavelength approach to studying the source population is presented by Padovani et al. (2009, Paper IV).

The present Paper is organized as follows. In §2 we briefly describe the radio, X–ray and optical data sets. In §3 we describe the procedure used to identify the X–ray counterparts of the radio sources. In §4 we describe the X–ray properties of the radio sources with X–ray counterparts in the catalog of Giacconi et al. (2002) for the CDFS and of Lehmer et al. (2005) for the E-CDFS. In §5 we show the average X–ray properties of radio sources without individual X–ray counterparts, obtained by stacking techniques. Our conclusions are summarized in §6. Luminosities are quoted for a flat cosmology with ΩΛ=0.7subscriptΩΛ0.7\Omega_{\Lambda}=0.7 and H0=70subscript𝐻070H_{0}=70 km/s/Mpc (see Spergel et al. 2006).

2 The data

2.1 The Radio data

We observed the whole area of the E-CDFS (0.3similar-toabsent0.3\sim 0.3 deg2) with the NRAO Very Large Array (VLA) for 50 h at 1.4 GHz mostly in the BnA configuration in 1999 and February 2001, and for 32 h at 5 GHz mostly in the C and CnB configurations in 2001. The effective angular resolution is 3.5” and the minimum rms noise is as low as 8.5 μ𝜇\muJy per beam at both 1.4 GHz and 5 GHz. These deep radio observations complement the larger area, but less sensitive (rms 14μsimilar-toabsent14𝜇\sim 14\muJy per beam), lower resolution observations of the CDFS discussed by Afonso et al. (2006)

Here we use the radio catalog presented in Paper I. A total of 266 radio sources were catalogued at 1.4 GHz, 198 of which are in a complete sample with signal–to–noise ratio greater than 5, and located within 15’ from the field center. The corresponding flux density limit ranges from 42 μ𝜇\muJy at the field center, to 125 μ𝜇\muJy near the field edge. Further discussion of the radio sources found in a larger area survey which includes the full E-CDFS with a uniform rms noise level of 6μsimilar-toabsent6𝜇\sim 6\muJy (Miller et al. 2009) will be given in a later paper.

The catalog includes radio positions, 1.4 GHz and 5 GHz flux densities, signal–to–noise ratios at the two frequencies, the largest angular size, and the radio spectral index between 5 and 1.4 GHz. Flux densities at 5 GHz are available only for similar-to\sim 70% of the sources (187 out of 266).

Among these sources, 22 have multiple components (12 are double, while 8 have three components, and only 2 sources have four components). The multiple component sources are associated mainly with classical radio galaxies. At least half of the components of multiple sources have a maximum extension larger than 3”, while only 1/3 of the single–component sources have extension larger than 3”. Clearly, the classification of a source as compact or extended depends on the spatial resolution of the radio data. Here we treat all the 266 sources in the catalog as single, and use the centroid for the multiple sources. The secondary components of multiple sources (those components which do not correspond to the centroid, but most likely to a radio lobe), are treated separately.

2.2 The X–ray data

In the E-CDFS area, we have two sets of X–ray data. The first is the 1Ms exposure in the central 0.1similar-toabsent0.1\sim 0.1 deg2 (Rosati et al. 2002; Giacconi et al. 2002; Alexander et al. 2003), the second one is the shallower 250similar-toabsent250\sim 250 ks coverage of a square region of 0.280.280.28 deg2 centered on the above field (Lehmer et al. 2005). The two data sets are treated separately, since it is not convenient to add them due to the large differences in the point spread function in the overlapping areas. Therefore, we use the deeper 1Ms data whenever the effective exposure time is larger than 25% of the effective exposure at the aimpoint (940 ks), while we use the shallower and wider E-CDFS data in the remaining area, where the quality of the E-CDFS exposure is better than the CDFS one. In this way we avoid regions close to the border of the 1Ms image, where the low effective exposure and the broadening of the PSF make the quality of data lower than that of the E-CDFS in the same region.

The 1Ms dataset of the CDFS is the result of the coaddition of 11 individual Chandra ACIS–I (Garmire et al. 1992; Bautz et al. 1998) exposures with aimpoints spaced within a few arcsec from α=𝛼absent\alpha=3:32:28.0, δ=𝛿\delta=-27:48:30 (J2000). For the X–ray data reduction of the CDFS–1Ms sources, we used the software ciao 3.0.1111For the latest version see http://cxc.harvard.edu/ciao3.4/index.html and the calibration database CALDB 2.26222For the release notes see http://asc.harvard.edu/caldb/downloads/Release_notes/CALDB_v2.26.txt, therefore including the correction for the degraded effective area of ACIS–I chips due to material accumulated on the ACIS optical blocking filter at the epoch of the observation. We also apply the time–dependent gain correction333see http://asc.harvard.edu/ciao/threads/acistimegain/. The reduction and analysis of the X–ray data are described in more detail in Giacconi et al. (2001), Tozzi et al. (2001) and Rosati et al. (2002). The final image covers 0.108 deg2, where 347 X–ray sources are identified down to flux limits of 5.5×10175.5superscript10175.5\times 10^{-17} and 4.5×10164.5superscript10164.5\times 10^{-16} erg cm-2 s-1 in the soft (0.520.520.5-2 keV) and hard (2102102-10 keV) bands respectively. In this Paper we will refer to the X–ray catalog presented in Giacconi et al. (2002).

X–ray spectral properties of the sources in the Giacconi et al.(2002) catalog have been presented in Tozzi et al. (2006). However, new redshifts have since been found for a significant number of sources, as a result of the ongoing spectroscopic follow up of the X–ray and radio sources in the E-CDFS field. In particular, 19 X–ray sources with radio counterparts in the CDFS field have new or updated redshifts with respect to Szokoly et al. (2004), while 27 X–ray sources with radio counterparts in the E-CDFS have new unpublished redshifts. For these sources the X–ray spectral analysis is updated consistently. Spectra are fitted with a power law (XSPEC model pow444See http://heasarc.nasa.gov/xanadu/xspec/manual/XSmodelPowerlaw.html) with intrinsic absorption at the source redshift (XSPEC model zwabs555http://heasarc.nasa.gov/xanadu/xspec/manual/XSmodelWabs.html) with redshift fixed to the spectroscopic or photometric value. We also include a redshifted K–shell Fe line modeled as an unresolved Gaussian component at 6.4/(1+z)6.41𝑧6.4/(1+z) keV (Nandra & Pounds 1994). We take into account the local Galactic absorption (XSPEC model tbabs666See http://heasarc.nasa.gov/xanadu/xspec/manual/XSmodelTbabs.html) with a column density frozen to NH=8×10¹⁹subscript𝑁𝐻8superscript1019N_{H}=8\times 10^{19} cm-2 (from Dickey & Lockman 1990). In performing the spectral fits, we include the effects of a methylen layer which is not yet accounted for in the calibration release CALDB 2.26 (see Vikhlinin et al. 2005). We use XSPEC v11.3.1 (see Arnaud 1996) to perform the spectral fits.

The E-CDFS survey consists of four contiguous 250similar-toabsent250\sim 250 ks Chandra observations covering approximately 0.3similar-to-or-equalsabsent0.3\simeq 0.3 deg2, flanking the 1Ms CDFS. The data and the point–source catalog are presented in Lehmer et al. (2005). The survey reaches flux limits of 1.1×10161.1superscript10161.1\times 10^{-16} and 6.7×10166.7superscript10166.7\times 10^{-16} erg cm-2 s-1 in the 0.520.520.5-2 keV and 28282-8 keV bands, respectively, and it includes 755 point–sources, of which 583 are not previously detected in the 1Ms exposure of the CDFS, mostly because of the larger covered area. For the X–ray data reduction of the E-CDFS sources, we used ciao 3.1 and CALDB 2.29. The X–ray spectral analysis of radio sources with counterparts present only in the E-CDFS catalog relies on new redshifts obtained during the spectroscopic follow–up of the E-CDFS and are presented here for the first time. The spectral analysis procedure is the same as that used for the sources identified in the 1Ms data.

2.3 The optical data

For the sources identified in the 1Ms exposure of the CDFS, the spectroscopic identification program carried out with the ESO–VLT is presented in Szokoly et al. (2004). The optical classification is based on the detection of high ionization emission lines. The presence of broad emission lines (width larger than 200020002000 km/s) like MgII𝐼𝐼II, CIII𝐼𝐼𝐼III, and at large redshifts, CIV𝐼𝑉IV and Lyα𝛼\alpha, classifies the source as a Broad Line AGN (BLAGN), Type–1 AGN or QSO according to the simple unification model by Antonucci (1993). The presence of unresolved high ionization emission lines (like OIII𝐼𝐼𝐼III, NeV𝑉V, NeIII𝐼𝐼𝐼III or HeII𝐼𝐼II) classifies the source as a High Excitation line galaxy (HEX), often implying an optical Type–2 AGN classification. Objects with unresolved emission lines consistent with an HII𝐼𝐼II region spectrum are classified as Low Excitation Line galaxies (LEX), implying sources without optical signs of nuclear activity. However, discriminating between a Type-2 AGN and an HII𝐻𝐼𝐼HII region galaxy involves the measurement of line ratios as shown in Veilleux & Osterbrock (1987), which is not used here as a classification scheme. Objects with typical galaxy spectra showing only absorption lines are classified as ABS. Among the LEX class we expect to find star–forming galaxies or Narrow Line Emission Galaxies, but also hidden AGN. Hidden AGN may be present also in the ABS class. The optical identification is flagged according to the quality of the optical information. In several cases, the optical spectral properties do not allow us to obtain a secure determination of the spectral type. As shown in Szokoly et al. (2004), the optical classification scheme fails to identify as AGN about 40% of the X–ray sources in the LEX+ABS classes. Therefore, an X–ray classification scheme, based on the source hardness ratio and observed X–ray luminosity, was developed by Szokoly et al. (2004) and compared with the optical classification (see their Fig. 13). A refined X–ray/optical classification scheme, based on X–ray spectral analysis, is presented in Tozzi et al. (2006). Optical and near-IR images of the CDFS are also used to derive photometric redshifts for all the X–ray sources without spectroscopic data. Using the widest multiwavelength photometry available today, Zheng et al. (2004) and Mainieri et al. (2005) derived photometric redshifts for the entire sample of optically identified CDFS X–ray sources.

Radio sources are identified with optical conterparts in Paper II. In some cases, the radio data and the use of new optical and MIR data from Spitzer allowed us to better identify the counterpart of some of the X–ray sources (see Brusa et al. 2008, in preparation). In these cases the X–ray spectral analysis of the source is updated with the new redshift resulting from the new identification, as discussed above. For several radio sources, the optical spectra of the counterparts are obtained in the follow–up of E-CDFS sources (see Silverman et al. 2008).

3 Matching radio sources with X–ray data

The radio catalog is presented in Paper I. To investigate the X–ray properties of the radio sources, first we match the radio sources with the X–ray catalogs of Giacconi et al. (2002, after applying the posititional shift correction as in Alexander et al. 2003), whenever their exposure time in the X–ray image is larger than 25% of the maximum exposure of the CDFS–1Ms field. For all the remaining radio sources, we match them with the catalog of Lehmer et al. (2005) in the E-CDFS field. To identify X–ray counterpart candidates, we initially selected all the pairs of radio and X–ray sources with separation less than 3σd3subscript𝜎𝑑3\sigma_{d}, where σd2=σr2+σX2superscriptsubscript𝜎𝑑2superscriptsubscript𝜎𝑟2superscriptsubscript𝜎𝑋2\sigma_{d}^{2}=\sigma_{r}^{2}+\sigma_{X}^{2} and σRsubscript𝜎𝑅\sigma_{R} and σXsubscript𝜎𝑋\sigma_{X} are the rms error of the radio and X–ray positions respectively. Typically, σxsubscript𝜎𝑥\sigma_{x} ranges from 0.2” to 1.5” depending on the off–axis angle, as computed by Giacconi et al. (2002), while σrsubscript𝜎𝑟\sigma_{r} ranges from 0.5” to 2”. 777Radio positions are listed in Paper I.. If more than one source satisfies this criterion, the preferred counterpart is the one with the smallest offset. However, this criterion for radio/X–ray source matching was refined as described below.

First we examined the 126 radio sources in the CDFS-1Ms observation. Following the matching procedure discussed above, we searched for X–ray counterparts and find 55 matching candidates. Then, we use the optical identifications both of the radio and the X-ray sources (see Paper II) to refine the positions and check for possible false matches. We then produced thumbnails of the radio, X–ray and optical images for all the candidates. Optical images are chosen from the available bands, using a priority based on depth and spatial resolution: R–band with FORS at VLT (see Giacconi et al. 2002), z–band GEMS (Rix et al. 2004), i–band ACS for GOODS (Giavalisco et al. 2004), WFI R deep (Hildebrandt et al. 2006). A close visual inspection, with the help of the optical images which have the best resolution, allowed us to discard three likely false matches, whose X–ray counterpart candidates are associated with optical sources different from the optical counterparts of the radio sources (see the contour maps of the extended sources overlaid over the WFI images with the position of the X–ray sources shown in Paper I). We also visually investigated the radio sources without X–ray match candidates to look for missed matches, but found none. The X–ray counterparts from the Giacconi and Lehmer catalogs are shown in Table I of Paper I

Down to the CDFS–1Ms flux limits (5.5×10175.5superscript10175.5\times 10^{-17} ergs cm-2 s-1 in the soft 0.5–2 keV band and 4.5×10164.5superscript10164.5\times 10^{-16} ergs cm-2 s-1 in the hard 2-10 keV band) we have 52 radio sources with X–ray counterparts (corresponding to 40% of the whole radio sample) and 74 radio sources without X–ray counterparts.

For the remaining radio sources we searched for X–ray counterparts in the E–CDFS data with the same procedure. We find 37 (corresponding to 26%) X–ray matches (after removing one false match). In total, we thus have 89 radio sources with X–ray counterparts (52 from the CDFS-1Ms data, and 37 from the E-CDFS data). This number is exactly the same found by Rovilos et al. (2007), where the ATCA data by Afonso et al. (2006) are used. However, we compared our X–ray detected radio sources with those of Rovilos et al. (2007), and we found significant differences: we have 31 X–ray detected radio sources not included in Rovilos et al, while Rovilos et al. includes 31 sources which we do not include. Among them, 23 are radio sources not present in our catalog, one has been discarded as a false match, and 7 are not included because of our matching criterion. The main difference in the two samples is accounted by the differences of the two radio surveys, both in sensitivity (Kellerman et al. 2008 is more sensitive in the center, while Afonso et al. 2007 in the outer regions) and in the accuracy of the radio positions.

The majority of radio sources (177) do not have X–ray counterparts in the X–ray catalogs, but were studied with stacking techniques. In summary, about 1/3 of the radio sources cataloged in Paper I have an X–ray counterpart in the present analysis.

4 Properties of radio sources with X–ray counterparts

For all of the radio sources with an X–ray counterpart and redshift information, we analyze the X–ray spectrum as described in Tozzi et al. (2006). We have 89 radio sources with a cataloged X–ray counterpart, 76 of them with known redshifts. Among them, 31 have spectroscopic redshifts and optical classification based on the detection of optical emission lines, while the remaining 45 sources have only photometric redshifts or uncertain optical classification.

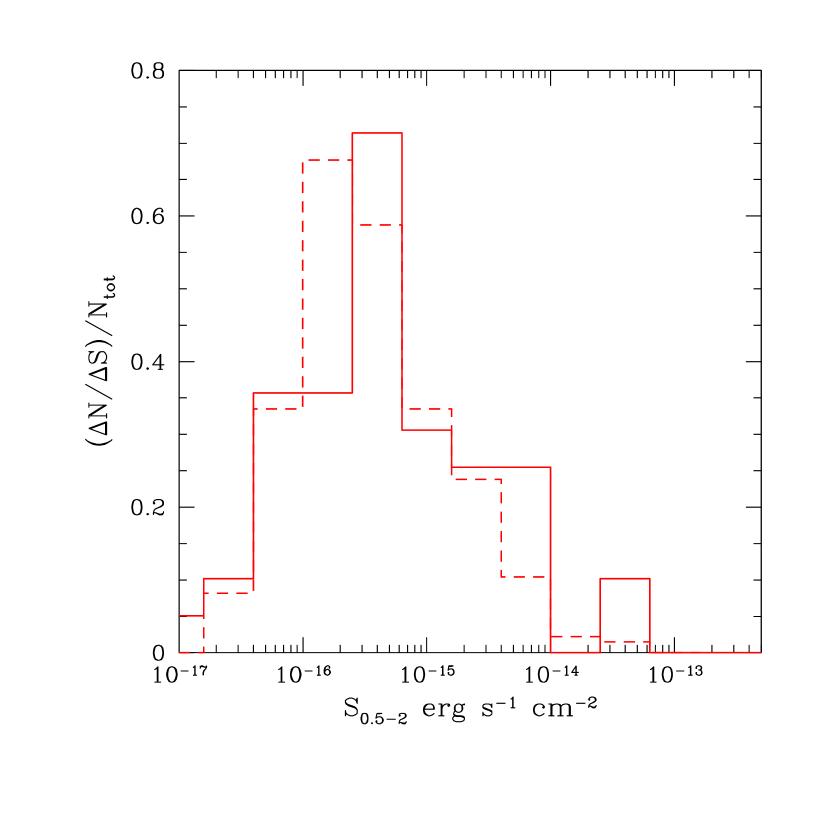
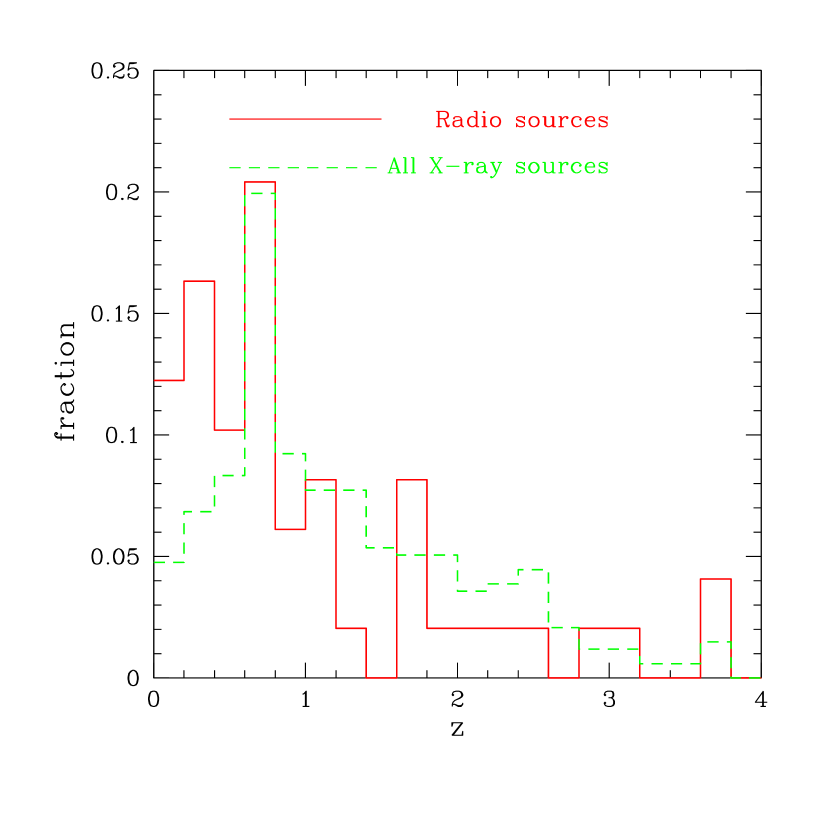
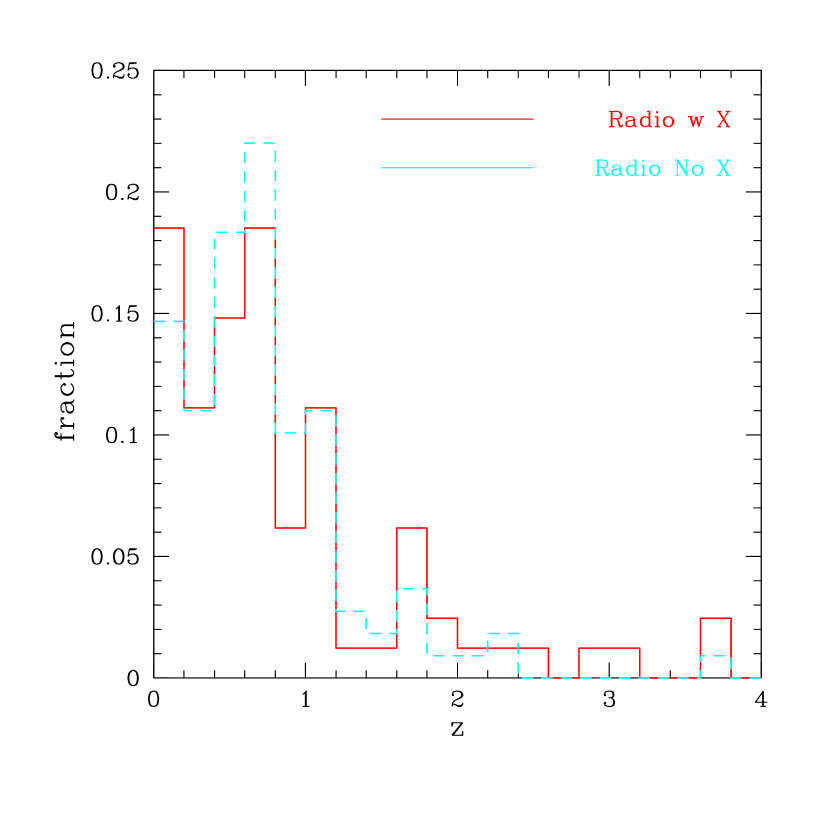
The normalized distribution of X–ray fluxes of the radio sources with X–ray counterparts found in the 1Ms field is shown in Figure 1 for the soft (left panel) and hard (right panel) bands. The distributions are compared with those of the whole X–ray sample in the 1Ms exposure of the CDFS. We find that the radio selection at the current flux density limit marginally tends to consist of the brightest X–ray sources. From a KS test, we find that the probability of the two distributions being extracted from different parent populations are 87similar-toabsent87\sim 87% and 95similar-toabsent95\sim 95% for the soft and hard bands, respectively. None of these probabilities are significant (i.e., >95absent95>95%), therefore we conclude that the additional brightness limit introduced by the radio selection is not affecting much the X–ray flux distribution. On the other hand, the normalized redshift distribution of the radio sources with X–ray counterparts is significantly shifted towards lower redshifts with respect to the distribution of the whole X–ray sample, as shown in Figure 2. The average redshift of the radio sources is z=1.01delimited-⟨⟩𝑧1.01\langle z\rangle=1.01 (median 0.73) while that of the X–ray sources is z=1.28delimited-⟨⟩𝑧1.28\langle z\rangle=1.28 (median 1.03). The two redshift distributions are inconsistent at more than the 99% confidence level. This is mostly due to the larger fraction of star forming galaxies among the X–ray sources with radio counterpart, since the radio emission is often associated with star formation. Since star forming galaxies are intrinsically fainter in the X–ray band, they are typically found at lower redshift with respect to AGN among the CDFS X-ray sources. This is the main reason of the shift towards lower redshift among radio sources with X–ray counterparts. Note that the peak at z0.7similar-to𝑧0.7z\sim 0.7 is due to the large-scale structure noted in Gilli et al. (2003).

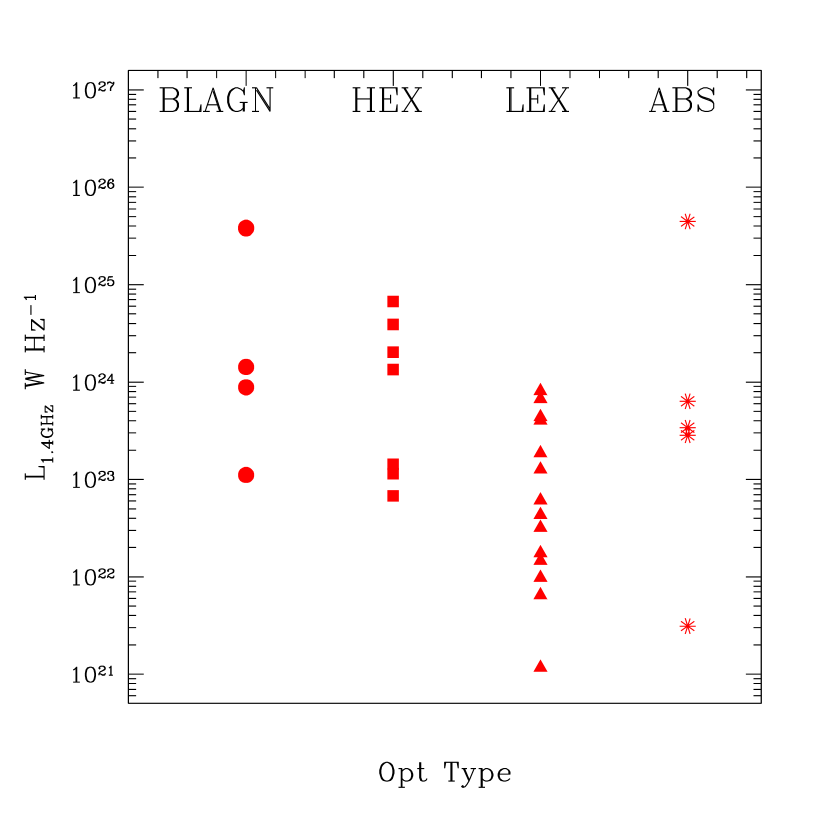
Most of the sources with spectroscopic redshifts have also an unambiguous optical classification based on the detection of high ionization emission lines, as described in §2.2. However, only 31 sources in the Szokoly et al. (2004) sample have spectroscopic redshifts and optical classification based on the detection of optical emission lines. We notice that among the radio sources with X–ray counterparts, a wide range of optical types are present. We find 12 radio sources distributed among BLAGN (5) and HEX (7), which corresponds roughly to Type I and Type II AGN respectively (see Szokoly et al. 2004; Tozzi et al. 2006). The most common optical species corresponds to LEX, which includes 14 radio sources. Among these sources we expect a larger number of star forming galaxies or Narrow Line Emission Galaxies, but also hidden AGN. Only 5 sources are in the ABS spectroscopic class.

The distribution of radio luminosities is different for the four optical types, as shown in Figure 3. The radio luminosity density is computed using the measured radio spectral slope when available (see Paper I), while we assume the average value αR=0.7subscript𝛼𝑅0.7\alpha_{R}=0.7 for sources detected only at 20 cm. The rest–frame radio luminosity density was calculated as L1.4GHz=4πdL2S1.4GHz1033(1+z)αR1subscript𝐿1.4𝐺𝐻𝑧4𝜋superscriptsubscript𝑑𝐿2subscript𝑆1.4𝐺𝐻𝑧superscript1033superscript1𝑧subscript𝛼𝑅1L_{1.4GHz}=4\pi d_{L}^{2}S_{1.4GHz}10^{-33}(1+z)^{\alpha_{R}-1} W Hz-1 where dLsubscript𝑑𝐿d_{L} is the luminosity distance (cm) and S1.4GHzsubscript𝑆1.4𝐺𝐻𝑧S_{1.4GHz} is the flux density (mJy𝑚𝐽𝑦mJy). The radio luminosity of BLAGN ranges from 1023superscript102310^{23} to a few ×1026absentsuperscript1026\times 10^{26} W Hz-1, while for HEX sources it reaches only 1025superscript102510^{25} W Hz-1. The LEX radio sources are mostly in the range from 10211024superscript1021superscript102410^{21}-10^{24} W Hz-1, typical of star forming galaxies. Sources in the ABS optical class have radio luminosities consistent with Faranoff–Riley Type I galaxies and star-forming galaxies for the lower luminosity sources, except one bright radio galaxy.

All of the information for the 76 radio sources with an X–ray counterpart and redshift are shown in Table 1 and Table 2 for the 1Ms and the E-CDFS fields respectively. X–ray luminosities are obtained from the X–ray spectral analysis, and refer to the intrinsic (de–absorbed) emitted power. For 13 radio sources with X–ray counterpart in the CDFS or in the E-CDFS fields, we do not have redshift information. These sources are shown in Table 3 and are excluded from the X–ray spectral analysis.

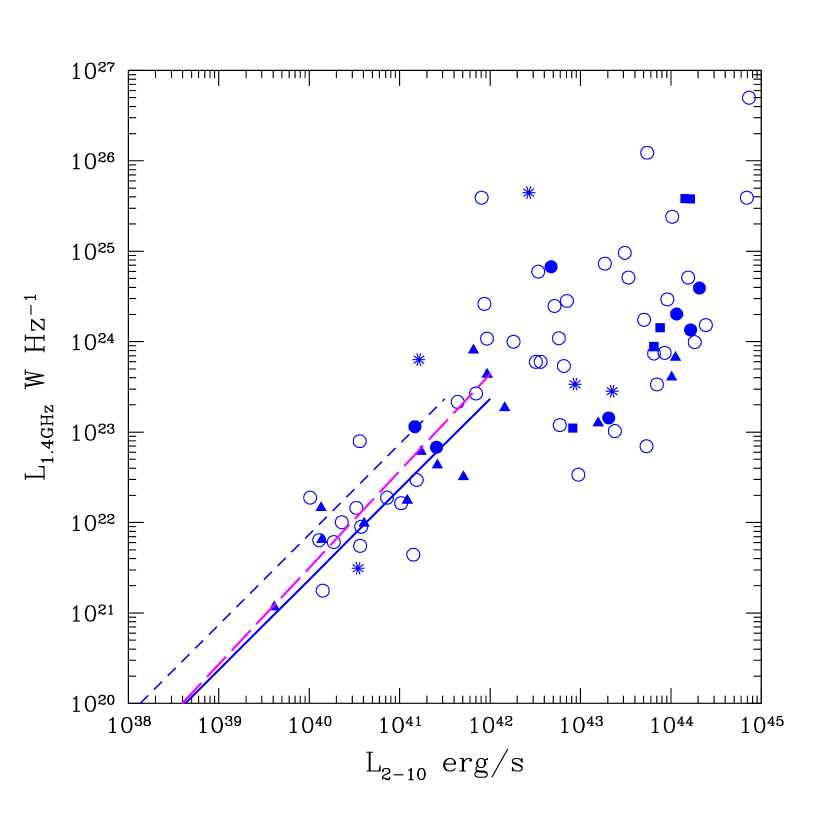
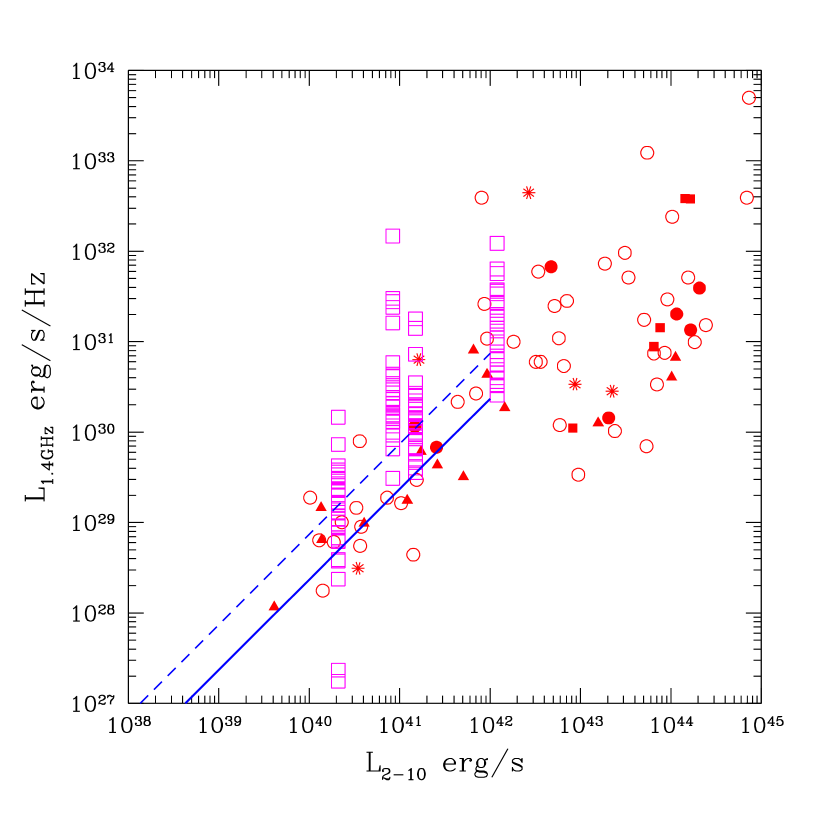
In Figure 4, we plot the 20 cm radio and hard–band X–ray luminosities for the 76 radio sources with X–ray spectral analysis and redshift information. We recall here that the X–ray luminosities represent the intrinsic power emitted in the corresponding rest–frame X–ray band (after removing intrinsic absorption), and the X–ray K–correction is already accounted for via the detailed spectral analysis. We find a clear trend in the luminosity range typical of star forming galaxies (1040LX1042superscript1040subscript𝐿𝑋superscript104210^{40}\leq L_{X}\leq 10^{42} erg s-1) and a larger scatter for higher X–ray luminosities. This result also reinforces the expectation that the majority of sources in our sample with LX1042subscript𝐿𝑋superscript1042L_{X}\leq 10^{42} erg s-1 are powered by star forming activity both in the radio and in the X–ray bands. Indeed, by looking at the sources with optical classification, the star forming galaxies sector may be conservatively defined by the conditions log(Lx)41.5similar-to-or-equals𝑙𝑜𝑔subscript𝐿𝑥41.5log(L_{x})\simeq 41.5 and log(L1.423log(L_{1.4}\simeq 23. However, this result is based only on 40% of the sources and must be taken with caution. Among 14 sources in the SF-galaxy luminosity range, the dominant optical types are LEX (10 sources) and ABS (2 sources), with only 2 HEX sources.

We notice also that the correlation expected for star forming galaxies, as found by Ranalli et al. (2003) for the X–ray luminosity range 1038<LX<1041.5superscript1038subscript𝐿𝑋superscript1041.510^{38}<L_{X}<10^{41.5} in the hard band, appears to be a factor 2similar-toabsent2\sim 2 higher. On the other hand, the radio-X–ray luminosity relation by Persic & Rephaeli (2007) for the integrated X—ray hard luminosity at high redshift (see their equations 10 and 11) is in better agreement with the X–ray detected radio sources. The same holds for the LRLXsubscript𝐿𝑅subscript𝐿𝑋L_{R}-L_{X} relation found for 122 late type galaxies in the CDFN studied by Bauer et al. (2002). A censored statistical analysis including the X–ray upper limits, confirms the linear slope and normalization of Ranalli et al. (2003), as shown in Paper IV. The presence of a robust LXLRsubscript𝐿𝑋subscript𝐿𝑅L_{X}-L_{R} relation agrees also with the recent analysis by Lehmer et al. (2008) on a sample of late type galaxies in the CDFN and E-CDFS, suggesting that X–ray emission can be used as a robust indicator of star formation activity out to z1.4similar-to𝑧1.4z\sim 1.4. All the mentioned studies, including our own, are at variance with the argument of Barger et al. (2007) that the LXsubscript𝐿𝑋L_{X}LRsubscript𝐿𝑅L_{R} relation is spurious.

On the other hand, the wide scatter at higher luminosities reflects the wide range of radio to X–ray luminosity ratio found in AGN. Within the 17 sources with LX>1042subscript𝐿𝑋superscript1042L_{X}>10^{42} erg s-1 , the dominant optical types are distributed among BLAGN (5 sources), HEX (5 sources), LEX (4 sources) and ABS (3 sources). While X–ray emission in this luminosity range is mostly associated to the AGN, the radio emission may be still associated to star formation activity in the majority of sources, as found by Rovilos et al. (2007) using the Spitzer 24 μ𝜇\mum luminosity.

Variability of the X–ray and radio luminosity may increase the scatter for the AGN sources. In order to check this possible bias, we considered the X–ray and radio luminosities separately for the sources with and without detected variability (Paolillo et al. 2004). Only the 46 sources for which variability has been measured (in the 1Ms exposure field) are included. We do not find any statistical evidence for a different behaviour (i.e., a larger scatter) among the two subsamples, which include 14 and 32 variable and non-variable sources respectively. Therefore, it seems unlikely that X–ray variability can account for a significant part of the large observed scatter in the LXsubscript𝐿𝑋L_{X}LRsubscript𝐿𝑅L_{R} relation for AGN. However, we cannot completely exclude some effect, since, as shown in Paolillo et al. (2004), probably the large majority (>90absent90>90%) of the CDFS sources are X–ray variable, their variability being undetected due to the low SNR.

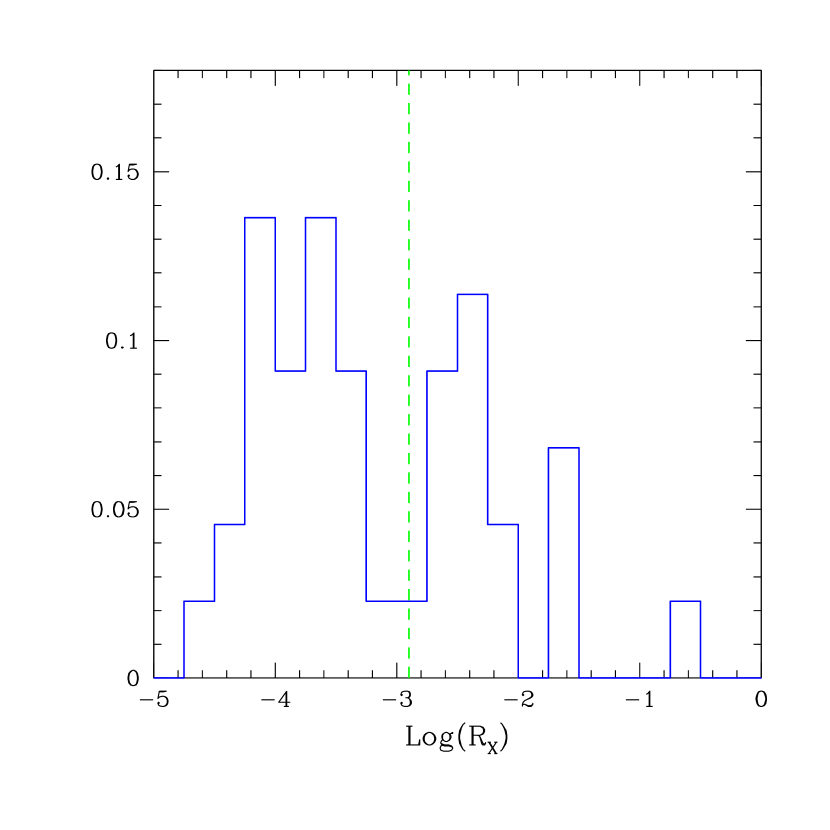
We also compute the radio loudness with respect to the hard band X–ray flux as defined in Terashima & Wilson (2003). Here we use the 20 cm luminosity rather than the 6 cm luminosity used by Terashima & Wilson: RXνLR(5GHz)/L210subscript𝑅𝑋𝜈subscript𝐿𝑅5𝐺𝐻𝑧subscript𝐿210R_{X}\equiv\nu L_{R}(5GHz)/L_{2-10}. On average, radio loudness defined by the 20 cm luminosity is shifted by 0.160.16-0.16 with respect to RXsubscript𝑅𝑋R_{X} defined at 6cm. Therefore we take log(RX)=2.9𝑙𝑜𝑔subscript𝑅𝑋2.9log(R_{X})=-2.9 as the boundary between radio loud and radio quiet AGN found by Panessa et al. (2007) with a sample of local Seyfert galaxies and low–luminosity radio galaxies. Since this criterion applies only to sources with nuclear activity, we consider only sources with LX>1042subscript𝐿𝑋superscript1042L_{X}>10^{42} erg s-1. As shown in Figure 5, the radio loudness distribution of the whole sample of sources with X–ray spectral analysis shows some bimodality. Using the same radio loud/radio quiet boundary, among the 50similar-toabsent50\sim 50 sources with L210>1042subscript𝐿210superscript1042L_{2-10}>10^{42} erg s-1, 1/3similar-toabsent13\sim 1/3 are radio loud and 2/3similar-toabsent23\sim 2/3 radio quiet.

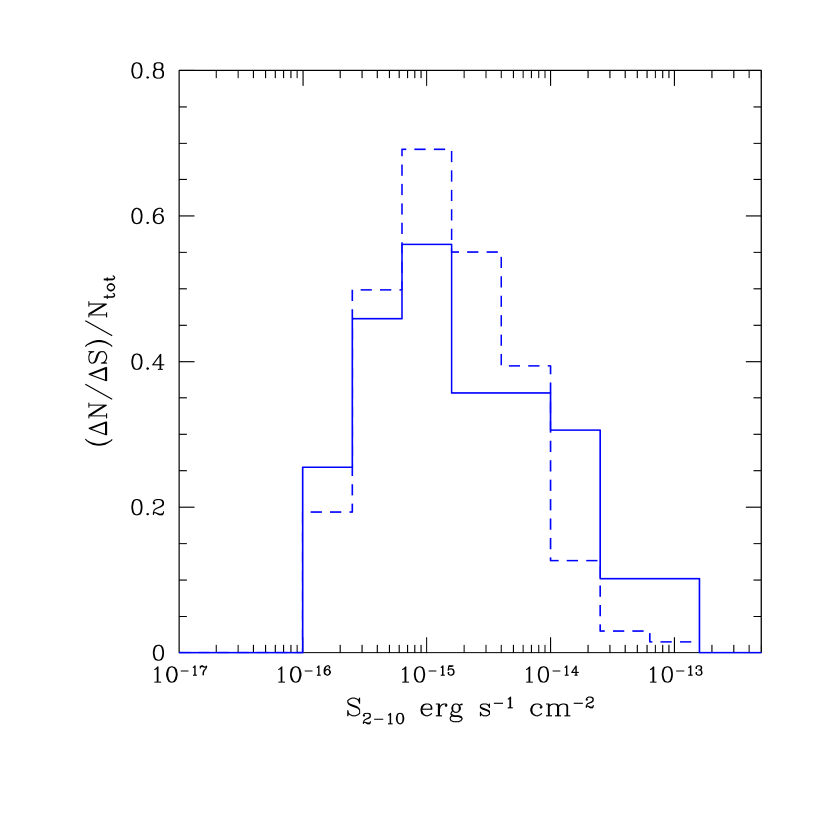
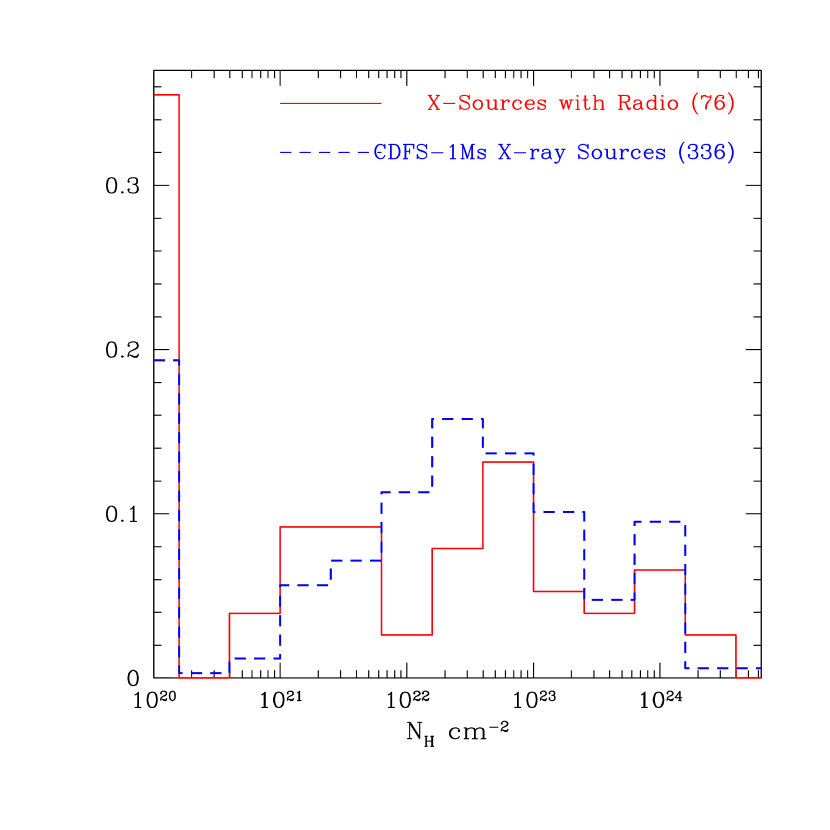
In Figure 6, left panel, we plot the fractional distribution of intrinsic absorbing columns of equivalent NHsubscript𝑁𝐻N_{H} for the 76 radio sources with X–ray spectral analysis and redshift information. The shape of the distribution for NH>1021subscript𝑁𝐻superscript1021N_{H}>10^{21} cm-2 is similar to that of the entire X–ray sample (dashed line), but the two distributions are inconsistent at more than 3 σ𝜎\sigma, due to the significantly larger number of radio sources with low intrinsic absorption. This is reflected also in the larger fraction of sources with LX<1042subscript𝐿𝑋superscript1042L_{X}<10^{42} erg s-1 in the radio sample (35%) compared with the whole X–ray sample (20%). These X–ray sources are mostly powered by starbursts, and therefore the X–ray emission does not show the intrinsic absorption found in sources with nuclear emission.

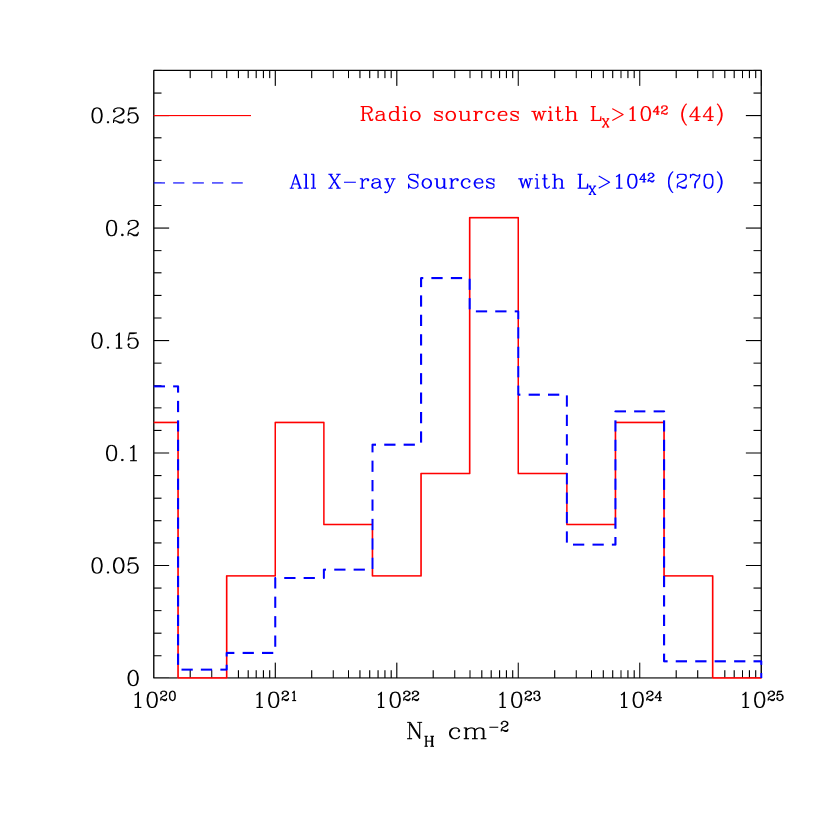
We divided sources into two subsamples according to the X–ray luminosity, and we find that radio sources with L210>1042subscript𝐿210superscript1042L_{2-10}>10^{42} erg s-1 have a distribution of NHsubscript𝑁𝐻N_{H} consistent with that of X–ray selected sources in the same luminosity range (see Figure 6, right panel). Again, this shows that the subsample of radio sources with X–ray luminosity L210>1042subscript𝐿210superscript1042L_{2-10}>10^{42} erg s-1 is representative of the X–ray selected AGN population. This does not show any significant difference in the intrinsic absorption properties of X-ray sources with and without radio counterpart. This allows one to discard a simple model in which the radio emission is associated to starbursts which in turn would absorb the X–ray emission from the AGN, as discussed by Rovilos et al. (2007). As a general remark, we recall that the gap in the distribution at NH<1021subscript𝑁𝐻superscript1021N_{H}<10^{21} cm-2 is not due to difficulties in measuring low values of NHsubscript𝑁𝐻N_{H}, especially at high redshifts. Indeed, as shown in Figure 9 of Tozzi et al. (2006), the resampling of NHsubscript𝑁𝐻N_{H} values according to the statistical error, decreases only by 20% the number of sources with NH<1021subscript𝑁𝐻superscript1021N_{H}<10^{21} cm-2. Here, for simplicity, we do not correct for this effect, nor for incompleteness (see, again, Tozzi et al. 2006) since we mostly focus on the comparison between radio sources with X–ray counterpart and the parent X–ray population.

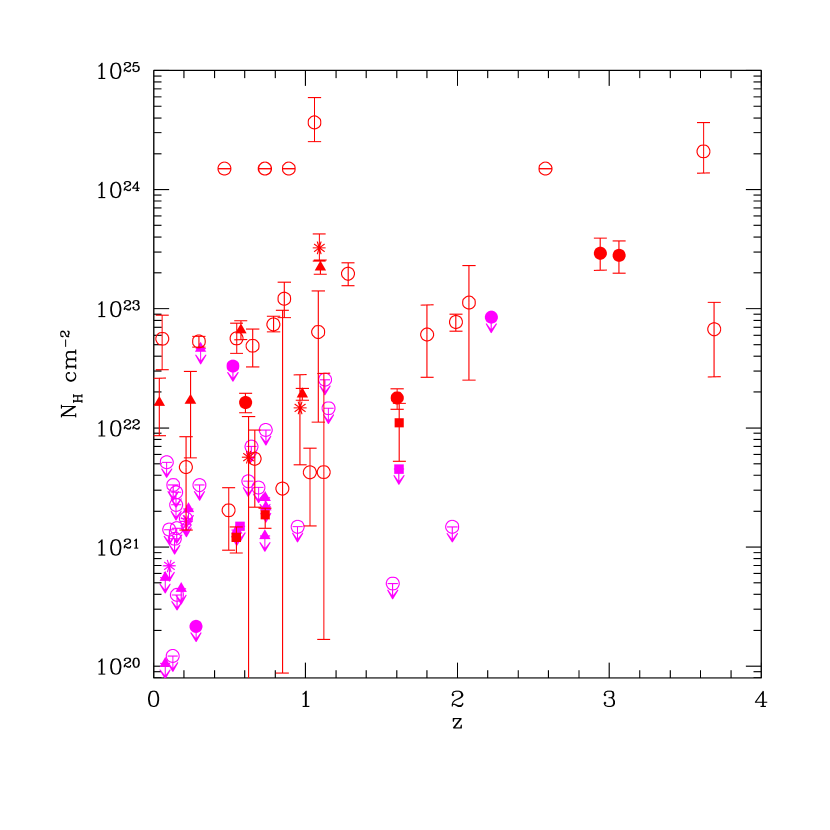
In Figure 7 we plot the intrinsic absorption versus redshift. The apparent increase of NHsubscript𝑁𝐻N_{H} with redshift is due to the difficulty of measuring NHsubscript𝑁𝐻N_{H} at high redshift as discussed in Tozzi et al. (2006). In this Figure we see clearly that the large number of NHsubscript𝑁𝐻N_{H} upper limits, causing the difference in figure 6 (left panel), are mostly at low redshifts. The two effects are clearly the same, and are due to the X–ray flux limit, which introduces a sharp cutoff around z1similar-to𝑧1z\sim 1 for sources with LX1042subscript𝐿𝑋superscript1042L_{X}\leq 10^{42} erg s-1, where all the star forming galaxies, showing no intrinsic absorption, are found.

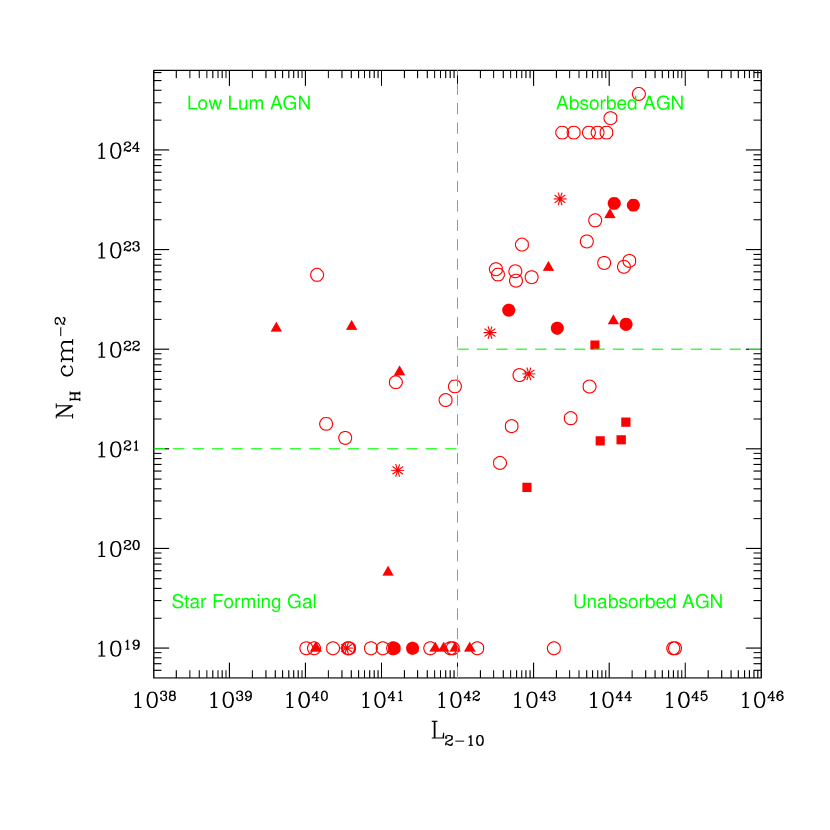
To summarize the properties of X–ray detected radio sources, we show in Figure 8 a simple but efficient classification based on X–ray properties only. We assume L210=1042subscript𝐿210superscript1042L_{2-10}=10^{42} erg s-1 as the threshold luminosity separating star forming galaxies and AGN, and NH=1022subscript𝑁𝐻superscript1022N_{H}=10^{22} cm-2 as the conventional threshold intrinsic absorption for unabsorbed and absorbed AGN. We find 23 star forming galaxies, 15 unabsorbed AGN and 29 absorbed AGN. In the star forming regime, the presence of absorption, not necessarily with high NHsubscript𝑁𝐻N_{H}, is the signature of nuclear emission. Therefore, if we adopt NH=1021subscript𝑁𝐻superscript1021N_{H}=10^{21} cm-2 as a conservative threshold, we can also tentatively identify 9 low luminosity AGN at L210<1042subscript𝐿210superscript1042L_{2-10}<10^{42} erg s-1. The optical classification for 40% of the sources show that several AGN are missed by optical spectroscopy, while only two HEX are included in the star forming galaxies sector.

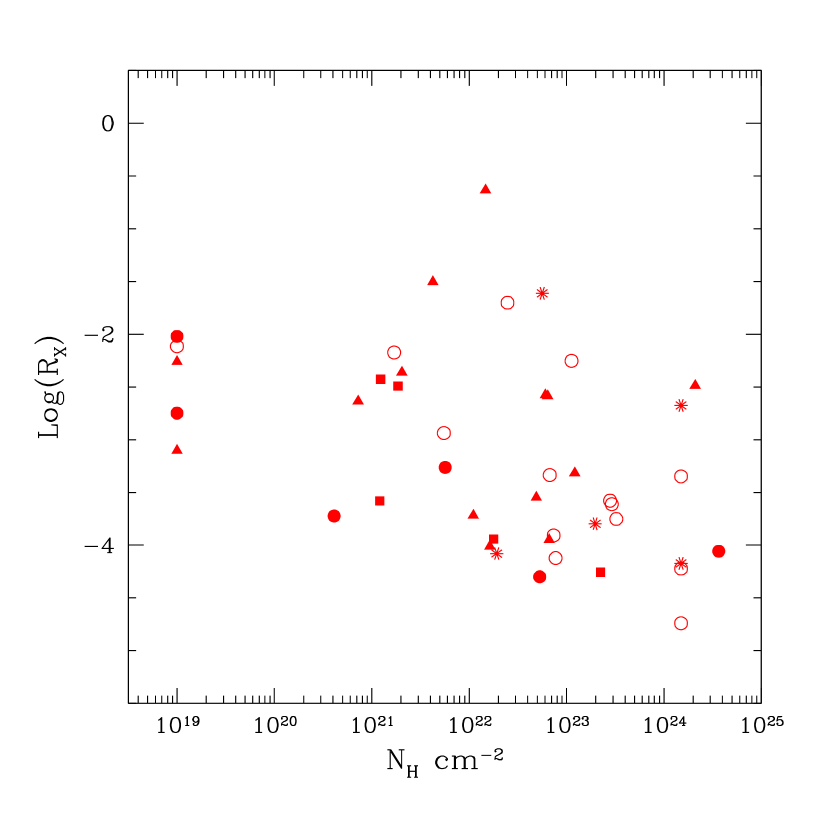
Broadly speaking, we find that X–ray emission of 1/3 of the X–ray detected radio sources is consistent with being associated to star formation in the host galaxy, while the remaining 2/3 are AGN. We also find a weak correlation between the radio loudness and the intrinsic absorption among the sources with L210>1042subscript𝐿210superscript1042L_{2-10}>10^{42} erg s-1. As shown in Figure 9, there is a large scatter, but the radio loudness is significantly higher at lower NHsubscript𝑁𝐻N_{H}. The Spearman rank correlation coefficient is -0.2, with a significance weaker than 2 σ𝜎\sigma. This is a hint that radio emission is decreasing with increasing absorption among X-ray detected AGN.

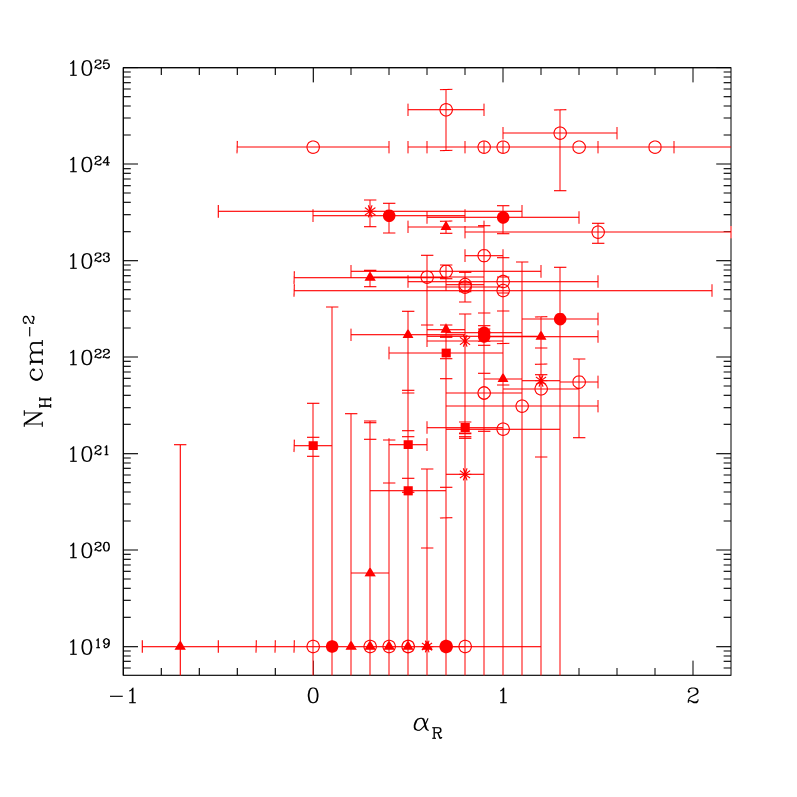
Finally we find a correlation between the radio spectral index αRsubscript𝛼𝑅\alpha_{R}, computed between 20 and 6 cm, and the intrinsic absorption measured in X–ray. The correlation is significant at the 3 σ𝜎\sigma level in a Spearman rank correlation test for the 59 sources which have both measured 6 cm flux densities and X–ray spectral analysis. The relation is shown in Figure 10 for only 59 sources which have both measured 6 cm fluxes and X–ray spectral analysis. On the other hand, we do not find a correlation between the radio spectral index and hard X–ray luminosity, nor between radio spectral index and radio-X–ray loudness. The apparent trend of having flatter radio spectra at lower intrinsic absorption may be due to a component of thermal radio emission dominating at low NHsubscript𝑁𝐻N_{H} due to star formation processes, while AGNs, with significant intrinsic absorption, show steeper radio spectra typical of non thermal transparent synchrotron emission (see Richards 2000). Indeed, the correlation we found in our sample is partially due to the presence of star forming galaxies, since it becomes significant only at the 90% level when only sources with L210>1042subscript𝐿210superscript1042L_{2-10}>10^{42} erg s-1 are included. Finally, we notice that the average X–ray spectral slope of the X–ray detected radio sources is Γ=1.8±0.1Γplus-or-minus1.80.1\Gamma=1.8\pm 0.1, in agreement with that of the X–ray sample.

5 Radio sources without X–ray counterparts

We have 174 radio sources in the FOV of the CDFS 1Ms exposure or in the complementary area of the E-CDFS without an X–ray counterpart (we note that the sources with RID = 1, 21 and 266 are outside the E-CDFS field). To retrieve X–ray information about these sources, we performed aperture photometry on the X–ray images at the radio positions. We use X–ray images obtained by masking the cataloged X–ray sources, replacing the removed regions with a Poissonian background based on the measured value of the local background. In this way we avoid including the emission from any detected X–ray source. We performed the photometry separately in the soft (0.5–2 keV) and hard (2–7 keV) X–ray bands. The results are given in Table 4. The net counts and the signal–to–noise are computed in the extraction radius which is dependent on the off–axis angle of the X–ray images, as described in Giacconi et al. (2001).

As we see from Table 4, there are 26 sources whose S/N ratio from aperture photometry in one of the two bands, is higher than the S/N limit for X–ray detect sources. However, these sources should not be considered X–ray detections since, on the basis of the X–ray detection algorithm, they have a very low probability of being real sources, and therefore were not included in the Giacconi et al. (2002) or the Lehmer et al. (2005) catalogs. Eventually, we have included their contribution in the stacking analysis of all the X–ray undetected radio sources. For all the other sources, we quote the 3 σ𝜎\sigma upper limits both in counts and fluxes.

In general, the histogram distributions of the net counts, shown separately in the 1Ms exposure (Figure 11) and in the complementary area of the E-CDFS (Figure 12), show a clear excess with respect to a distribution of photometry based on random positions (dashed line) in the soft band (left panel), and a marginal excess in the hard band (right panel). The probability that the measured and random net counts distributions are different is more than 5 sigma in the soft band, while it is marginal in the hard band for sources in the 1Ms CDFS (80%) and in the E-CDFS (60%). In any case, there are no sources which dominate the X–ray photometry of the radio sources with no cataloged X–ray sources, allowing us to perform a meaningful stacked analysis to obtain their average properties.

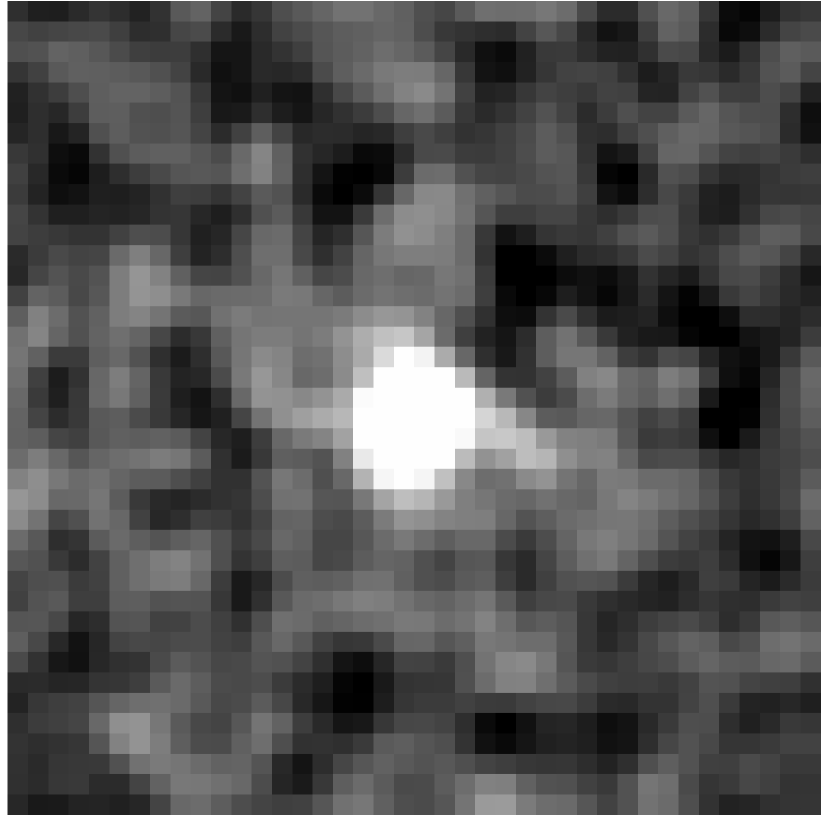
A visual impression of the total X–ray emission from the radio sources without counterparts in the X–ray catalog can be obtained simply by stacking the X–ray image at the position of the radio sources. The stacked images in the soft and hard bands are shown in Figure 13. Overall, the 74 radio sources in the 1Ms field are detected with 460±75plus-or-minus46075460\pm 75 and 300±90plus-or-minus30090300\pm 90 net counts in the soft and hard bands respectively. We performed a Monte Carlo simulation to assess the significance of the detection of the stacked image. The detection in the soft band is at more than 99.9% confidence level, while in the hard band it is at 99%. Energy fluxes are computed as in Rosati et al. (2002), using conversion factors from the measured net count rate to the energy flux, assuming an average spectral slope of Γ=1.4Γ1.4\Gamma=1.4, equal to 5.07×10125.07superscript10125.07\times 10^{-12} and 2.97×10112.97superscript10112.97\times 10^{-11} erg s-1 cm-2 (cnts s-1)-1 in the soft and hard bands respectively. After correcting for the effective average X–ray exposure time, the photometry of the stacked images corresponds to a flux of (4.4±0.7)×1017plus-or-minus4.40.7superscript1017(4.4\pm 0.7)\times 10^{-17} erg s-1 cm-2 and (1.7±0.3)×1016plus-or-minus1.70.3superscript1016(1.7\pm 0.3)\times 10^{-16} erg s-1 cm-2 per source in the soft and hard bands respectively.

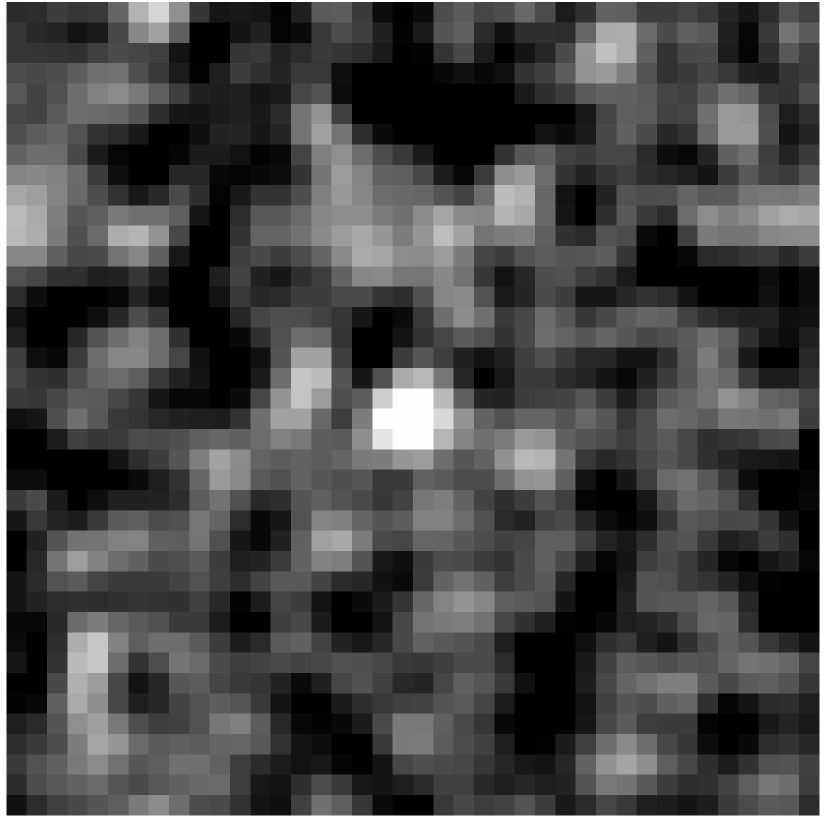
With the same analysis, the 100 radio sources in the E-CDFS field yield 260±30plus-or-minus26030260\pm 30 and 90±60plus-or-minus906090\pm 60 net counts in the soft and hard bands respectively. The stacked images in the soft and hard bands are shown in Figure 14. The detection in the soft band is highly significant, while in the hard band it is only marginal. After correcting for the effective average exposure, and adopting the appropriate conversion factors for the E-CDFS fields, the average flux per source is (5.4±0.6)×1017plus-or-minus5.40.6superscript1017(5.4\pm 0.6)\times 10^{-17} erg s-1 cm-2 and (1.7±1.1)×1016plus-or-minus1.71.1superscript1016(1.7\pm 1.1)\times 10^{-16} erg s-1 cm-2 in the soft and hard bands respectively. These values are consistent with those found in the CDFS, supporting the accuracy of the stacking procedure.

To investigate further the nature of the weak X–ray emission, we evaluate the average hardness ratio defined as HR=(HS)/(H+S)𝐻𝑅𝐻𝑆𝐻𝑆HR=(H-S)/(H+S), where H𝐻H and S𝑆S are the net counts in the hard (2–7 keV) and soft (0.5–2 keV) bands respectively, corrected for vignetting. If we stack the net counts of sources in four bins of radio flux density, we find a roughly constant value of HR0.5±0.1similar-to𝐻𝑅plus-or-minus0.50.1HR\sim-0.5\pm 0.1, indicating that the statistics are not able to indicate a significant change in the average X–ray spectral properties of the radio sources as a function of their radio flux density.

We have redshifts for 64% (110) of our radio sources with no X–ray detection. The redshift distributions of the sources with and without X–ray counterparts are consistent with each other, as shown in Figure 15. If we split the sample in four redshift bins with about 27 sources each, we can measure the average X–ray luminosities for radio sources, using the average fluxes, and assuming a power law spectrum with Γ=1.8Γ1.8\Gamma=1.8. The four redshift bins are: 0.0<z<0.40.0𝑧0.40.0<z<0.4, 0.4<z<0.70.4𝑧0.70.4<z<0.7, 0.7<z<10.7𝑧10.7<z<1, 1<z<2.31𝑧2.31<z<2.3. The results, listed in Table 5, show that the X–ray luminosity for these sources lie in the range of star forming galaxies. Only in the higher redshift bin (z1.4similar-todelimited-⟨⟩𝑧1.4\langle z\rangle\sim 1.4) is the average hard X–ray luminosity at the high end of the typical starburst galaxies. However, to evaluate the contribution from a population of low luminosity AGN, a multiwavelength approach, as discussed in Paper IV, is needed. If we plot these sources in the LRsubscript𝐿𝑅L_{R}LXsubscript𝐿𝑋L_{X} plane, we find that, on average, they are consistent with the relation expected for star forming galaxies (see Figure 16). This is consistent with the censored analysis presented in Paper IV, confirming the results by Lehmer et al. (2008) supporting the LXsubscript𝐿𝑋L_{X}LRsubscript𝐿𝑅L_{R} correlation holding at high redshift; this is at variance with the claim of Barger et al. (2007).

6 Conclusions

We present detailed X-ray spectral properties of 76 VLA sources with X-ray counterparts in the CDFS (Giacconi et al. 2002) and the E-CDFS (Lehmer et al. 2005). We also present the average X–ray properties of the radio sources without X–ray counterparts in the 1Ms CDFS exposure and in the E-CDFS field. Our main results are summarized as follows.

  • One third of the radio sources are detected in the X–ray bands. Among them, 1/3similar-toabsent13\sim 1/3 of the radio sources are consistent with being star forming galaxies, while the remaining 2/3 are AGN, by assuming LX=1042subscript𝐿𝑋superscript1042L_{X}=10^{42} erg s-1 as the threshold between star forming galaxies and AGN.

  • In the AGN luminosity range, L210>1042subscript𝐿210superscript1042L_{2-10}>10^{42} erg s-1, 1/3similar-toabsent13\sim 1/3 of the sources are radio loud and 2/3similar-toabsent23\sim 2/3 radio quiet, where radio loud is defined as log(RX)>2.9𝑙𝑜𝑔subscript𝑅𝑋2.9log(R_{X})>-2.9 (with RXνLR(5GHz)/L210subscript𝑅𝑋𝜈subscript𝐿𝑅5𝐺𝐻𝑧subscript𝐿210R_{X}\equiv\nu L_{R}(5GHz)/L_{2-10}).

  • The intrinsic absorption in the X–ray band of the radio sources is shifted to lower values with respect to the X–ray selected sample, showing that radio selection tends to find a larger number of star forming galaxies; when selecting source with L210>1042subscript𝐿210superscript1042L_{2-10}>10^{42} erg s-1 the distribution is similar to that of the X–ray sample.

  • We find a weak anticorrelation of radio loudness as a function of intrinsic absorption, adding support to the finding that radio emission is not efficient in selecting more absorbed AGN.

  • The stacked X–ray images of 174 radio sources without cataloged X–ray counterparts shows a clear detection in the soft band and a marginal detection in the hard band.

  • The average X–ray luminosities of radio sources without cataloged X–ray counterpart is consistent with being powered by star formation.

Deeper X–ray and radio data in the CDFS will allow us to extend this analysis toward lower levels, and to obtain additional contraints on the role of star forming galaxies as opposed to AGN in the sub mJy radio population.

P. Tozzi acknowledges support under the ESO visitor program in Garching during the completion of this work. We thank Massimo Persic and Piero Ranalli for discussion on the X–ray/Radio luminosity correlation, and Isabella Prandoni for valuable comments. We acknowledge financial contribution from contract ASI–INAF I/023/05/0 and from the PD51 INFN grant. The VLA is a facility of the National Science Foundation operated by NRAO under a cooperative agreement with Associated Universities Inc.

References

  • (1) Afonso, J., Mobasher, B., Koekemoer, A., Norris, R.P., Cram, L. 2006, AJ, 131, 1216
  • (2) Alexander, D.M., et al. 2003, AJ, 126, 539
  • (3) Antonucci, R.R.J. 1993, ARA&A, 31, 473
  • (4) Arnaud, K.A. 1996, “Astronomical Data Analysis Software and Systems V”, eds. Jacoby G. and Barnes J., ASP Conf. Series vol. 101, 17
  • (5) Barger, A.J., Cowie, L.L., & Wang, W.-H. 2007, ApJ, 654, 764
  • (6) Bauer, F.E., Alexander, D.M., Brandt, W.N., Hornschemeier, A.E., Vignali, C., Garmire, G.P., & Schneider, D.P. 2002, AJ, 124, 2351
  • (7) Bauer, F.E., Alexander, D.M., Brandt, W.N., Schneider, D.P., Treister, E., Hornschemeier, A.E., & Garmire, G.P. 2004, AJ, 128, 2048
  • (8) Bautz, M., et al. 1998, in Proc. SPIE Vol. 3444, X–ray Optics, Instruments and Missions, eds. R.B. Hoover & A.B. Walker, 210
  • (9) Dickey & Lockman, 1990, ARAA, 28, 215.
  • (10) Garmire, G.P., et al. 1992, ApJ, 399, 694
  • (11) Giacconi, R., Rosati, P., Tozzi, P., et al. 2001, ApJ, 551, 624
  • (12) Giacconi, R., Zirm, A., Wang, J., Rosati, P., Nonino, M., Tozzi, P., Gilli, R., Mainieri, V., Hasinger, G., Kewley, L., et al. 2002, ApJS, 139, 369
  • (13) Giavalisco et al. 2004, ApJL, 600, 93
  • (14) Gilli, R., Cimatti, A., Daddi, E., Hasinger, G., Rosati, P., Szokoly, G., Tozzi, P., Bergeron, J., Borgani, S., Giacconi, R., Kewley, L., Mainieri, V., Mignoli, M., Nonino, M., Norman, C., Wang, J., Zamorani, G., Zheng, W., & Zirm, A. 2003, ApJ, 592, 721
  • (15) Hildebrandt et al. 2006, A&A 452, 1121-1128
  • (16) Kellermann, K.I., Sramek, R., Schmidt, M., Shaffer, D.B., & R. Green 1989, AJ, 98, 1195
  • (17) Kellermann, K.I, et al. 2008, ApJS, 179, 71 (Paper I)
  • (18) Kormendy, J., Richstone, D. 1995, ARA&A, 33, 581
  • (19) Lehmer, B. D., Brandt, W. N., Alexander, D. M., Bauer, F. E., Schneider, D. P., Tozzi, P., Bergeron, J., Garmire, G. P., Giacconi, R., Gilli, R., Hasinger, G., Hornschemeier, A. E., Koekemoer, A. M., Mainieri, V., Miyaji, T., Nonino, M., Rosati, P., Silverman, J. D., Szokoly, G. & Vignali C. 2005, ApJS, 161, 21
  • (20) Lehmer, B. D., Brandt, W. N., Alexander, D. M., Bell, E. F., Hornschemeier, A. E., McIntosh, D. H., Bauer, F. E., Gilli, R., Mainieri, V., Schneider, D. P., Silverman, J. D., Steffen, A. T., Tozzi, P., & Wolf, C. 2008, ApJ, 681, 1163
  • (21) Magorrian, J., Tremaine, S., et al. 1998, AJ, 115, 2285
  • (22) Mainieri, V., Rosati, P., Tozzi, P., Bergeron, J., Gilli, R., Hasinger, G., Nonino, M., Idzi, R., Koekemoer, A.M., Lehmann, I., Szokoly, G., & Zheng, W. 2005, A&A, 437, 805
  • (23) Mainieri, V., et al. 2008, ApJS, 179, 95 (Paper II)
  • (24) Muxlow, T. W. B., Richards, A. M. S., Garrington, S. T., Wilkinson, P. N., Anderson, B., Richards, E. A., Axon, D. J., Fomalont, E. B., Kellermann, K. I., Partridge, R. B., Windhorst, R. A. 2005, MNRAS, 358, 1159
  • (25) Nandra, K., Pounds, K.A. 1994, MNRAS, 268, 405
  • (26) Panessa, F., Barcons, X., Bassani, L., Cappi, M., Carrera, F.J., Ho, L.C., & Pellegrini, S. 2007, A&A, 467, 519
  • (27) Padovani, P., et al. 2009, ApJ, in press, arXiv:0812.2997 (Paper IV)
  • (28) Paolillo, M., Schreier, E. J., Giacconi, R., Koekemoer, A.M., & Grogin, N. A. 2004, ApJ, 611, 93
  • (29) Persic, M., Rephaely, Y. 2007, A&A, 463, 481
  • (30) Ranalli, P., Comastri, A., & Setti, G. 2003, A&A, 399, 39
  • (31) Richards, E.A., Kellermann, K.I., Fomalont, E.B., Windhorst, R.A., & Partridge R.B. 1998, AJ, 116, 1039
  • (32) Richards, E.A. 2000, ApJ, 533, 611
  • (33) Rix H.–W. et al. 2004, ApJS, 152, 163
  • (34) Rovilos, E., Georgakakis, A., Georgantopoulos, I., Afonso, J., Koekemoer, A.M., Mobasher, B., & Goudis, C. 2007, A&A, 466, 119
  • (35) Rosati, P., Tozzi, P., Giacconi, R., Gilli, R., Hasinger, G., Kewley, L., Mainieri, V., Nonino, M., Norman, C., Szokoly, G., and 9 coauthors 2002, ApJ, 566, 667
  • (36) Schinnerer, E., Smolcic, V., Carilli C.L., et al. 2007, ApJS, 172, 46
  • (37) Silverman et al. 2008, in preparation
  • (38) Spergel, D.N., Bean, R., Dore’, O., Nolta, M.R., et al. 2007, ApJS, 170, 377
  • (39) Smolcic, V., Schinnerer, E., Scodeggio, M., Franzetti, P., et al. 2008a, ApJ in press, arXiv:0803.0997
  • (40) Smolcic, V., Schinnerer, E., Zamorani, G., et al. 2008b, ApJ in press, arXiv:0808.0493
  • (41) Szokoly, G. P., Bergeron, J., Hasinger, G., Lehmann, I., Kewley, L., Mainieri, V., Nonino, M., Rosati, P., Giacconi, R., Gilli, R., Gilmozzi, R., Norman, C., Romaniello, M., Schreier, E., Tozzi, P., Wang, J.X., Zheng, W., Zirm, A. 2004, ApJS, 155, 271
  • (42) Terashima, Y., & Wilson, A.S. 2003, ApJ, 583, 145
  • (43) Tozzi, P., Rosati, P., Nonino, M., Bergeron, J., Borgani, S., Gilli, R., Gilmozzi, R., Hasinger, G., Grogin, N., Kewley, L., et al. 2001, ApJ, 562, 42
  • (44) Tozzi, P., Gilli, R., Mainieri, V., Norman, C., Risaliti, G., Rosati, P., Bergeron, Giacconi, R., J., Hasinger, G., Nonino, M., Streblyanska, A., Szokloly, G., Wang, J.X., & Zheng, W. 2006, A&A, 451, 457
  • (45) Veilleux, S. ,& Osterbrock, D.E. 1987, ApJS, 63, 295
  • (46) Vikhlinin, A., Markevitch, M., Murray, S.S., Jones, C., Forman, W., & Van Speybroeck, L. 2005, ApJ, 628, 655
  • (47) Zheng, W., Mikles, V.J., Mainieri, V., Hasinger, G., Rosati, P., Wolf, C., Norman, C., Szokoly, G., Gilli, R., Tozzi, P., Wang, J.X., Zirm, A., & Giacconi, R. 2004, ApJS, 155, 73

Refer to captionRefer to caption

Figure 1: Left panel: normalized distribution of X–ray fluxes in the soft band for all the radio sources with X–ray counterparts in the 1 Ms CDFS field (solid line), compared with that of the whole X–ray sample (dashed line). Right panel: normalized distribution of X–ray fluxes in the hard band for all the radio sources with X–ray counterparts in the 1Ms field (solid line), compared with that of the whole 1 Ms CDFS X-ray sample (dashed line).
Refer to caption
Figure 2: Redshift distribution of the 49 radio sources with 1 Ms CDFS X–ray counterparts and redshift information compared with the redshift distribution of the X–ray sources in the Giacconi et al. (2002) catalog.
Refer to caption
Figure 3: Radio luminosities plotted for different optical classes: Broad Line AGN (circles) High Excitation Lines (Squares), Low Excitation Lines (triangles) and normal galaxies (asterisks). K–corrections are computed for the measured αRsubscript𝛼𝑅\alpha_{R} when possible, otherwise assuming αR=0.7subscript𝛼𝑅0.7\alpha_{R}=0.7.
Refer to caption
Figure 4: Radio luminosity plotted against the X–ray luminosity in the hard band (2–10 keV). Same symbols as in Figure 3 (empty circles for sources without optical spectral classification). The solid line is the correlation between radio and hard band X–ray luminosity determined empirically for star forming galaxies in Persic & Raphaeli (2007), while the short-dashed line is the same relation found by Ranalli et al. (2003), and the long-dashed line is by Bauer et al. (2002). K–corrections are computed for the measured αRsubscript𝛼𝑅\alpha_{R} when possible, otherwise assuming αR=0.7subscript𝛼𝑅0.7\alpha_{R}=0.7.
Refer to caption
Figure 5: Distribution of the radio loudness log(RX)subscript𝑅𝑋\log(R_{X}) for sources with L210>1042subscript𝐿210superscript1042L_{2-10}>10^{42} erg s-1. The vertical dashed line shows the boundary between radio loud and radio quiet AGN after Panessa et al. (2007).

Refer to captionRefer to caption

Figure 6: Left: Fractional distribution of measured intrinsic absorbing columns of equivalent NHsubscript𝑁𝐻N_{H} for the X–ray sources with redshifts, with radio matches (continuous histogram). The fractional distribution of absorbing columns of the entire X–ray sample is also shown (dashed histogram). The two distributions are inconsistent with each other. Right: same as in the left panel, but for sources with LX>1042subscript𝐿𝑋superscript1042L_{X}>10^{42} erg s-1. The two distributions are now consistent with each other.
Refer to caption
Figure 7: Intrinsic absorption versus redshift for the X–ray radio matches. Upper limits (1 σ𝜎\sigma) are used for measures consistent with NH=0subscript𝑁𝐻0N_{H}=0 within 1 σ𝜎\sigma. Compton thick candidates are plotted at NH=1.5×1024subscript𝑁𝐻1.5superscript1024N_{H}=1.5\times 10^{24} cm2 as lower limits to the actual value. Error bars correspond to 1 σ𝜎\sigma. Different symbols as in Figure 3 (empty circles for sources without optical spectral classification).
Refer to caption
Figure 8: Intrinsic absorbing columns of equivalent NHsubscript𝑁𝐻N_{H} versus intrinsic hard luminosities for the X–ray radio matches. Different symbols as in Figure 3 (empty circles for sources without optical spectral classification). Dashed lines provide a simple X–ray classification as described in the text.
Refer to caption
Figure 9: Radio loudness RXsubscript𝑅𝑋R_{X} versus the intrinsic absorption for sources with L210>1042subscript𝐿210superscript1042L_{2-10}>10^{42} erg s-1. Same symbols as in Figure 3 (empty circles for sources without optical spectral classification).
Refer to caption
Figure 10: Radio spectral slope αRsubscript𝛼𝑅\alpha_{R} versus the intrinsic absorption NHsubscript𝑁𝐻N_{H}. Same symbols as in Figure 3 (empty circles for sources without optical spectral classification).

Refer to captionRefer to caption

Figure 11: Left: Histogram distribution of the net counts in the 1Ms exposure for radio sources without X–ray counterparts in the soft band (solid line) compared with random photometry (dashed line). Right: the same in the hard band.

Refer to captionRefer to caption

Figure 12: Left: Histogram distribution of the net counts in the complementary E-CDFS exposure for radio sources without X–ray counterparts in the soft band (solid line) compared with random photometry (dashed line). Right: the same in the hard band.

Refer to captionRefer to caption

Figure 13: Stacked images of the 74 radio sources without X–ray counterparts in the 1Ms field in the soft (left) and hard (right) bands.

Refer to captionRefer to caption

Figure 14: Stacked images of the 103 radio sources without X–ray counterparts in the E-CDFS field in the soft (left) and hard (right) bands.
Refer to caption
Figure 15: Redshift distribution of the 76 radio sources with X–ray counterparts and redshift information (solid line) compared with the redshift distribution of the 110 radio sources without X–ray counterparts and measured redshift (dashed line).
Refer to caption
Figure 16: Radio luminosity plotted against the X–ray luminosity in the hard bands (blue triangles) as in Figure 4, with the radio luminosities and average X–ray luminosities of radio–only sources shown as empty square, computed for sources in four redshift bins: 0.0<z<0.40.0𝑧0.40.0<z<0.4, 0.4<z<0.70.4𝑧0.70.4<z<0.7, 0.7<z<10.7𝑧10.7<z<1, 1<z<2.31𝑧2.31<z<2.3. Lines as in Figure 4. Same symbols as in Figure 3 (empty circles for sources without optical spectral classification).
Table 1: Optical and X–ray properties of Radio sources with X–ray matches in the 1Ms exposure. Q𝑄Q refers to the optical spectrum quality (see Zheng et al. 2004). The optical type has the following meaning: 1 = Broad Line AGN (BLAGN); 2= High Excitation line (HEX); 3 = Low Excitation Lines (LEX); 4 = Absorption spectrum galaxy (ABS). Optype=0 is when only photometric redshifts are available or no optical classification is possible. Sources XID=29 and XID=51 are fitted with a soft component, and sources XID=502, 608, and 913 are fitted with a reflection model (pexrav) as in Tozzi et al. (2006).
R ID X ID z Q Optype ΓΓ\Gamma NHsubscript𝑁𝐻N_{H} 1022superscript102210^{22} cm-2 L0.52subscript𝐿0.52L_{0.5-2} erg s-1 L210subscript𝐿210L_{2-10} erg s-1
54 112 2.9400 2 2 1.81.81.8 29.28.2+9.9superscriptsubscript29.28.29.929.2_{-8.2}^{+9.9} 7.50×10437.50superscript10437.50\times 10^{43} 1.16×10441.16superscript10441.16\times 10^{44}
66 74 0.6650 2 0 1.81.81.8 0.550.33+0.40superscriptsubscript0.550.330.400.55_{-0.33}^{+0.40} 4.17×10424.17superscript10424.17\times 10^{42} 6.54×10426.54superscript10426.54\times 10^{42}
68 72 1.9900 0.23 0 1.90±0.15plus-or-minus1.900.151.90\pm 0.15 7.741.27+1.25superscriptsubscript7.741.271.257.74_{-1.27}^{+1.25} 1.37×10441.37superscript10441.37\times 10^{44} 1.83×10441.83superscript10441.83\times 10^{44}
76 66 0.5740 2 3 1.46±0.26plus-or-minus1.460.261.46\pm 0.26 6.651.15+1.29superscriptsubscript6.651.151.296.65_{-1.15}^{+1.29} 5.88×10425.88superscript10425.88\times 10^{42} 1.57×10431.57superscript10431.57\times 10^{43}
84 538 0.3100 2 3 1.81.81.8 0.590.60+4.04superscriptsubscript0.590.604.040.59_{-0.60}^{+4.04} 5.88×10405.88superscript10405.88\times 10^{40} 1.72×10411.72superscript10411.72\times 10^{41}
85 63 0.5440 2 1 1.920.03+0.02superscriptsubscript1.920.030.021.92_{-0.03}^{+0.02} 0.120.03+0.03superscriptsubscript0.120.030.030.12_{-0.03}^{+0.03} 5.71×10435.71superscript10435.71\times 10^{43} 7.59×10437.59superscript10437.59\times 10^{43}
86 594 0.7330 2 3 1.81.81.8 <0.12absent0.12<0.12 9.27×10419.27superscript10419.27\times 10^{41} 1.45×10421.45superscript10421.45\times 10^{42}
92 60 1.6150 2 1 1.830.08+0.09superscriptsubscript1.830.080.091.83_{-0.08}^{+0.09} 0.120.12+0.33superscriptsubscript0.120.120.330.12_{-0.12}^{+0.33} 9.58×10439.58superscript10439.58\times 10^{43} 1.43×10441.43superscript10441.43\times 10^{44}
93 97 0.1810 0 3 1.280.08+0.13superscriptsubscript1.280.080.131.28_{-0.08}^{+0.13} <0.04absent0.04<0.04 1.47×10411.47superscript10411.47\times 10^{41} 5.09×10415.09superscript10415.09\times 10^{41}
99 56 0.6050 2 2 1.260.12+0.13superscriptsubscript1.260.120.131.26_{-0.12}^{+0.13} 1.630.29+0.32superscriptsubscript1.630.290.321.63_{-0.29}^{+0.32} 5.58×10425.58superscript10425.58\times 10^{42} 2.06×10432.06superscript10432.06\times 10^{43}
102 908 2.0760 2 0 1.81.81.8 11.28.7+11.8superscriptsubscript11.28.711.811.2_{-8.7}^{+11.8} 4.55×10424.55superscript10424.55\times 10^{42} 7.09×10427.09superscript10427.09\times 10^{42}
105 587 1.8000 0.08 0 1.81.81.8 6.073.42+4.69superscriptsubscript6.073.424.696.07_{-3.42}^{+4.69} 3.70×10423.70superscript10423.70\times 10^{42} 5.77×10425.77superscript10425.77\times 10^{42}
108 52 0.5690 2 1 1.900.09+0.12superscriptsubscript1.900.090.121.90_{-0.09}^{+0.12} 0.040.04+0.11superscriptsubscript0.040.040.110.04_{-0.04}^{+0.11} 6.14×10426.14superscript10426.14\times 10^{42} 8.23×10428.23superscript10428.23\times 10^{42}
110 51 1.0970 2 3 1.710.22+0.23superscriptsubscript1.710.220.231.71_{-0.22}^{+0.23} 22.402.90+3.25superscriptsubscript22.402.903.2522.40_{-2.90}^{+3.25} 5.49×10435.49superscript10435.49\times 10^{43} 1.02×10441.02superscript10441.02\times 10^{44}
112 566 0.7340 2 3 1.81.81.8 <0.26absent0.26<0.26 4.19×10414.19superscript10414.19\times 10^{41} 6.57×10416.57superscript10416.57\times 10^{41}
113 249 0.9640 2 4 1.81.81.8 1.470.98+1.32superscriptsubscript1.470.981.321.47_{-0.98}^{+1.32} 1.69×10421.69superscript10421.69\times 10^{42} 2.68×10422.68superscript10422.68\times 10^{42}
115 525 0.2290 2 3 1.81.81.8 0.0050.005+0.20superscriptsubscript0.0050.0050.200.005_{-0.005}^{+0.20} 5.29×10405.29superscript10405.29\times 10^{40} 1.22×10411.22superscript10411.22\times 10^{41}
125 655 0.7380 2 0 1.81.81.8 <0.96absent0.96<0.96 1.16×10411.16superscript10411.16\times 10^{41} 4.39×10414.39superscript10414.39\times 10^{41}
132 150 1.0900 2 4 1.81.81.8 32.47.3+10.0superscriptsubscript32.47.310.032.4_{-7.3}^{+10.0} 1.32×10431.32superscript10431.32\times 10^{43} 2.24×10432.24superscript10432.24\times 10^{43}
133 46 1.6170 2 1 2.190.18+0.20superscriptsubscript2.190.180.202.19_{-0.18}^{+0.20} 1.100.58+0.50superscriptsubscript1.100.580.501.10_{-0.58}^{+0.50} 7.44×10437.44superscript10437.44\times 10^{43} 6.48×10436.48superscript10436.48\times 10^{43}
134 42 0.7340 2 1 1.960.03+0.01superscriptsubscript1.960.030.011.96_{-0.03}^{+0.01} 0.180.04+0.03superscriptsubscript0.180.040.030.18_{-0.04}^{+0.03} 1.33×10441.33superscript10441.33\times 10^{44} 1.65×10441.65superscript10441.65\times 10^{44}
138 651 0.2120 2 0 1.81.81.8 <0.17absent0.17<0.17 4.65×10404.65superscript10404.65\times 10^{40} 7.27×10407.27superscript10407.27\times 10^{40}
139 224 0.7380 2 3 1.81.81.8 <0.22absent0.22<0.22 5.93×10415.93superscript10415.93\times 10^{41} 9.31×10419.31superscript10419.31\times 10^{41}
140 103 0.2150 2 4 1.81.81.8 0.060.06+0.10superscriptsubscript0.060.060.100.06_{-0.06}^{+0.10} 1.04×10411.04superscript10411.04\times 10^{41} 1.63×10411.63superscript10411.63\times 10^{41}
141 95 0.0760 2 3 1.81.81.8 <0.010absent0.010<0.010 8.66×10398.66superscript10398.66\times 10^{39} 1.35×10401.35superscript10401.35\times 10^{40}
142 116 0.0760 2 3 1.81.81.8 <0.05absent0.05<0.05 8.85×10398.85superscript10398.85\times 10^{39} 1.38×10401.38superscript10401.38\times 10^{40}
145 563 2.2230 2 2 1.81.81.8 2.52.5+6.0superscriptsubscript2.52.56.02.5_{-2.5}^{+6.0} 3.05×10423.05superscript10423.05\times 10^{42} 4.74×10424.74superscript10424.74\times 10^{42}
151 632 3.6200 0.08 0 1.81.81.8 20971+156superscriptsubscript20971156209_{-71}^{+156} 6.72×10436.72superscript10436.72\times 10^{43} 1.04×10441.04superscript10441.04\times 10^{44}
154 247 0.0380 2 3 1.81.81.8 1.630.77+0.98superscriptsubscript1.630.770.981.63_{-0.77}^{+0.98} 2.49×10392.49superscript10392.49\times 10^{39} 4.11×10394.11superscript10394.11\times 10^{39}
156 913 2.5790 1 0 1.81.81.8 150150150 2.05×10432.05superscript10432.05\times 10^{43} 3.40×10433.40superscript10433.40\times 10^{43}
157 577 0.5470 2 3 1.81.81.8 <0.14absent0.14<0.14 1.68×10411.68superscript10411.68\times 10^{41} 2.62×10412.62superscript10412.62\times 10^{41}
162 31 1.6030 2 2 2.120.09+0.08superscriptsubscript2.120.090.082.12_{-0.09}^{+0.08} 1.790.35+0.33superscriptsubscript1.790.350.331.79_{-0.35}^{+0.33} 1.72×10441.72superscript10441.72\times 10^{44} 1.65×10441.65superscript10441.65\times 10^{44}
163 582 0.2420 2 3 1.81.81.8 1.701.14+1.28superscriptsubscript1.701.141.281.70_{-1.14}^{+1.28} 2.59×10402.59superscript10402.59\times 10^{40} 4.05×10404.05superscript10404.05\times 10^{40}
165 29 0.2980 2 0 2.030.20+0.10superscriptsubscript2.030.200.102.03_{-0.20}^{+0.10} 5.31±0.56plus-or-minus5.310.565.31\pm 0.56 8.11×10428.11superscript10428.11\times 10^{42} 9.48×10429.48superscript10429.48\times 10^{42}
166 641 0.6520 1 0 1.81.81.8 4.891.64+1.88superscriptsubscript4.891.641.884.89_{-1.64}^{+1.88} 3.67×10423.67superscript10423.67\times 10^{42} 5.91×10425.91superscript10425.91\times 10^{42}
170 27 3.0640 2 2 1.22±0.24plus-or-minus1.220.241.22\pm 0.24 28.08.2+9.0superscriptsubscript28.08.29.028.0_{-8.2}^{+9.0} 5.41×10435.41superscript10435.41\times 10^{43} 2.07×10442.07superscript10442.07\times 10^{44}
173 25 0.6250 0 4 0.320.21+0.22superscriptsubscript0.320.210.220.32_{-0.21}^{+0.22} 0.570.56+0.67superscriptsubscript0.570.560.670.57_{-0.56}^{+0.67} 5.56×10415.56superscript10415.56\times 10^{41} 8.71×10428.71superscript10428.71\times 10^{42}
178 98 0.2790 2 2 1.81.81.8 <0.02absent0.02<0.02 9.22×10409.22superscript10409.22\times 10^{40} 1.47×10411.47superscript10411.47\times 10^{41}
183 644 0.1030 2 0 1.81.81.8 <0.14absent0.14<0.14 8.26×10398.26superscript10398.26\times 10^{39} 1.29×10401.29superscript10401.29\times 10^{40}
186 84 0.1030 2 4 2.040.18+0.28superscriptsubscript2.040.180.282.04_{-0.18}^{+0.28} <0.07absent0.07<0.07 3.19×10403.19superscript10403.19\times 10^{40} 3.47×10403.47superscript10403.47\times 10^{40}
190 18 0.9790 2 3 1.75±0.08plus-or-minus1.750.081.75\pm 0.08 1.920.22+0.22superscriptsubscript1.920.220.221.92_{-0.22}^{+0.22} 6.59×10436.59superscript10436.59\times 10^{43} 1.13×10441.13superscript10441.13\times 10^{44}
192 578 1.1200 2 0 1.81.81.8 0.420.41+2.44superscriptsubscript0.420.412.440.42_{-0.41}^{+2.44} 5.92×10415.92superscript10415.92\times 10^{41} 9.27×10419.27superscript10419.27\times 10^{41}
200 175 0.5220 2 2 1.81.81.8 <3.30absent3.30<3.30 1.07×10411.07superscript10411.07\times 10^{41} 2.56×10412.56superscript10412.56\times 10^{41}
208 152 1.2800 0.98 0 1.840.36+0.39superscriptsubscript1.840.360.391.84_{-0.36}^{+0.39} 19.74.1+4.6superscriptsubscript19.74.14.619.7_{-4.1}^{+4.6} 4.40×10434.40superscript10434.40\times 10^{43} 6.51×10436.51superscript10436.51\times 10^{43}
214 506 3.6900 0.57 0 1.81.81.8 6.74.1+4.6superscriptsubscript6.74.14.66.7_{-4.1}^{+4.6} 1.00×10441.00superscript10441.00\times 10^{44} 1.55×10441.55superscript10441.55\times 10^{44}
218 608 0.8900 2 0 1.81.81.8 150150150 4.47×10434.47superscript10434.47\times 10^{43} 7.02×10437.02superscript10437.02\times 10^{43}
225 650 0.2130 0.02 0 1.81.81.8 0.470.33+0.38superscriptsubscript0.470.330.380.47_{-0.33}^{+0.38} 9.86×10409.86superscript10409.86\times 10^{40} 1.54×10411.54superscript10411.54\times 10^{41}
228 502 0.7320 2 0 1.81.81.8 150150150 5.83×10435.83superscript10435.83\times 10^{43} 9.16×10439.16superscript10439.16\times 10^{43}
230 501 1.0290 2 0 1.640.13+0.11superscriptsubscript1.640.130.111.64_{-0.13}^{+0.11} 0.420.27+0.25superscriptsubscript0.420.270.250.42_{-0.27}^{+0.25} 2.73×10432.73superscript10432.73\times 10^{43} 5.47×10435.47superscript10435.47\times 10^{43}
Table 2: X–ray properties of Radio sources with X–ray matches in the complementary area covered by the E-CDFS. X ID are from Lehmer et al. (2005)
R ID X ID z Q Optype ΓΓ\Gamma NHsubscript𝑁𝐻N_{H} 1022superscript102210^{22} cm-2 L0.52subscript𝐿0.52L_{0.5-2} erg s-1 L210subscript𝐿210L_{2-10} erg s-1
7 7 0.4940 0.03 0 1.970.10+0.11superscriptsubscript1.970.100.111.97_{-0.10}^{+0.11} 0.200.11+0.11superscriptsubscript0.200.110.110.20_{-0.11}^{+0.11} 2.53×10432.53superscript10432.53\times 10^{43} 3.10×10433.10superscript10433.10\times 10^{43}
15 47 0.7890 0.08 0 1.900.24+0.25superscriptsubscript1.900.240.251.90_{-0.24}^{+0.25} 7.41.0+1.3superscriptsubscript7.41.01.37.4_{-1.0}^{+1.3} 6.08×10436.08superscript10436.08\times 10^{43} 8.56×10438.56superscript10438.56\times 10^{43}
24 66 0.6900 0.01 0 1.81.81.8 <0.31absent0.31<0.31 5.48×10415.48superscript10415.48\times 10^{41} 8.66×10418.66superscript10418.66\times 10^{41}
26 82 0.1480 0.01 0 1.81.81.8 <0.22absent0.22<0.22 1.47×10401.47superscript10401.47\times 10^{40} 2.29×10402.29superscript10402.29\times 10^{40}
35 140 0.4660 2 0 1.81.81.8 150150150 1.41×10431.41superscript10431.41\times 10^{43} 2.24×10432.24superscript10432.24\times 10^{43}
37 146 0.0570 0.04 0 1.81.81.8 5.62.5+3.2superscriptsubscript5.62.53.25.6_{-2.5}^{+3.2} 9.05×10399.05superscript10399.05\times 10^{39} 1.41×10401.41superscript10401.41\times 10^{40}
52 194 0.8480 0.19 0 1.81.81.8 0.310.30+9.4superscriptsubscript0.310.309.40.31_{-0.30}^{+9.4} 4.18×10414.18superscript10414.18\times 10^{41} 7.00×10417.00superscript10417.00\times 10^{41}
71 254 0.9480 0.04 0 1.81.81.8 <0.15absent0.15<0.15 1.04×10431.04superscript10431.04\times 10^{43} 1.87×10431.87superscript10431.87\times 10^{43}
96 321 1.5740 0.09 0 1.580.05+0.02superscriptsubscript1.580.050.021.58_{-0.05}^{+0.02} <0.05absent0.05<0.05 2.36×10442.36superscript10442.36\times 10^{44} 6.92×10446.92superscript10446.92\times 10^{44}
148 398 1.9660 0.01 0 1.800.06+0.07superscriptsubscript1.800.060.071.80_{-0.06}^{+0.07} <0.15absent0.15<0.15 2.89×10442.89superscript10442.89\times 10^{44} 7.32×10447.32superscript10447.32\times 10^{44}
188 461 0.1520 2 0 1.81.81.8 <0.143absent0.143<0.143 1.38×10401.38superscript10401.38\times 10^{40} 3.66×10403.66superscript10403.66\times 10^{40}
193 469 0.5460 1 0 1.81.81.8 5.61.4+1.9superscriptsubscript5.61.41.95.6_{-1.4}^{+1.9} 2.19×10422.19superscript10422.19\times 10^{42} 3.42×10423.42superscript10423.42\times 10^{42}
206 504 0.1540 0.01 0 1.81.81.8 <0.04absent0.04<0.04 2.31×10402.31superscript10402.31\times 10^{40} 3.62×10403.62superscript10403.62\times 10^{40}
207 508 0.6440 0.01 0 1.81.81.8 <0.70absent0.70<0.70 5.13×10415.13superscript10415.13\times 10^{41} 8.07×10418.07superscript10418.07\times 10^{41}
215 546 0.7340 0.10 0 1.81.81.8 150150150 3.34×10433.34superscript10433.34\times 10^{43} 5.37×10435.37superscript10435.37\times 10^{43}
217 552 0.6230 2 0 1.81.81.8 0.070.07+0.28superscriptsubscript0.070.070.280.07_{-0.07}^{+0.28} 2.28×10422.28superscript10422.28\times 10^{42} 3.62×10423.62superscript10423.62\times 10^{42}
219 555 1.0840 1 0 1.81.81.8 6.45.3+7.7superscriptsubscript6.45.37.76.4_{-5.3}^{+7.7} 1.51×10421.51superscript10421.51\times 10^{42} 3.22×10423.22superscript10423.22\times 10^{42}
220 557 0.3020 0 0 1.81.81.8 <0.33absent0.33<0.33 3.15×10403.15superscript10403.15\times 10^{40} 1.04×10411.04superscript10411.04\times 10^{41}
232 609 1.0590 0.12 0 1.81.81.8 366113+228superscriptsubscript366113228366_{-113}^{+228} 1.35×10441.35superscript10441.35\times 10^{44} 2.44×10442.44superscript10442.44\times 10^{44}
240 634 0.0860 2 0 1.81.81.8 0.180.18+0.34superscriptsubscript0.180.180.340.18_{-0.18}^{+0.34} 1.20×10401.20superscript10401.20\times 10^{40} 1.87×10401.87superscript10401.87\times 10^{40}
243 639 0.1480 2 0 1.81.81.8 <0.29absent0.29<0.29 6.55×10396.55superscript10396.55\times 10^{39} 1.02×10401.02superscript10401.02\times 10^{40}
246 646 1.1280 0.03 0 1.81.81.8 <2.54absent2.54<2.54 9.82×10419.82superscript10419.82\times 10^{41} 1.82×10421.82superscript10421.82\times 10^{42}
249 657 0.1390 0.01 0 1.81.81.8 <0.12absent0.12<0.12 1.99×10401.99superscript10401.99\times 10^{40} 3.76×10403.76superscript10403.76\times 10^{40}
250 664 0.1260 2 0 1.81.81.8 <0.01absent0.01<0.01 9.08×10409.08superscript10409.08\times 10^{40} 1.42×10411.42superscript10411.42\times 10^{41}
251 669 0.1290 2 0 3.980.59+0.86superscriptsubscript3.980.590.863.98_{-0.59}^{+0.86} 0.130.13+0.20superscriptsubscript0.130.130.200.13_{-0.13}^{+0.20} 4.96×10414.96superscript10414.96\times 10^{41} 3.33×10403.33superscript10403.33\times 10^{40}
252 674 1.1510 0.15 0 1.81.81.8 0.170.17+1.29superscriptsubscript0.170.171.290.17_{-0.17}^{+1.29} 2.76×10422.76superscript10422.76\times 10^{42} 5.18×10425.18superscript10425.18\times 10^{42}
259 738 0.8600 2 0 1.940.56+0.58superscriptsubscript1.940.560.581.94_{-0.56}^{+0.58} 12.13.7+4.6superscriptsubscript12.13.74.612.1_{-3.7}^{+4.6} 3.69×10433.69superscript10433.69\times 10^{43} 5.06×10435.06superscript10435.06\times 10^{43}
Table 3: X–ray properties of Radio sources with X–ray matches and no redshift information in the 1Ms CDFS field or in the complementary area covered by the E-CDFS. X ID are from Giacconi et al. (2002) or Lehmer et al. (2005)
R ID X ID Soft Cts Hard Cts Soft flux erg s-1cm-2 Hard Flux erg s-1cm-2
14 E46 144.2 51.8 0.39×10140.39superscript10140.39\times 10^{-14} 0.51×10140.51superscript10140.51\times 10^{-14}
18 E51 24.4 16.9 0.63×10150.63superscript10150.63\times 10^{-15} 0.19×10140.19superscript10140.19\times 10^{-14}
33 E136 49.7 101.2 0.11×10140.11superscript10140.11\times 10^{-14} 0.13×10130.13superscript10130.13\times 10^{-13}
49 E188 9.2 47.0 0.35×10150.35superscript10150.35\times 10^{-15} 0.13×10130.13superscript10130.13\times 10^{-13}
56 E205 7.9 8.6 0.19×10150.19superscript10150.19\times 10^{-15} <0.86×10¹⁵absent0.86superscript1015<0.86\times 10^{-15}
73 70 115.6 344.6 0.71×10150.71superscript10150.71\times 10^{-15} 0.12×10130.12superscript10130.12\times 10^{-13}
80 E289 174.2 111.0 0.64×10140.64superscript10140.64\times 10^{-14} 0.17×10130.17superscript10130.17\times 10^{-13}
87 537 16.4 18.1 0.98×10160.98superscript10160.98\times 10^{-16} 0.62×10150.62superscript10150.62\times 10^{-15}
122 570 23.8 9.3 0.15×10150.15superscript10150.15\times 10^{-15} 0.35×10150.35superscript10150.35\times 10^{-15}
176 E437 78.4 157.7 0.20×10140.20superscript10140.20\times 10^{-14} 0.23×10130.23superscript10130.23\times 10^{-13}
211 E535 9.5 16.8 <0.22×10¹⁵absent0.22superscript1015<0.22\times 10^{-15} 0.22×10140.22superscript10140.22\times 10^{-14}
231 E599 9.5 15.7 <0.24×10¹⁵absent0.24superscript1015<0.24\times 10^{-15} 0.22×10140.22superscript10140.22\times 10^{-14}
262 E743 16.0 18.2 <0.42×10¹⁵absent0.42superscript1015<0.42\times 10^{-15} <0.20×10¹⁴absent0.20superscript1014<0.20\times 10^{-14}
Table 4: X–ray photometric properties of radio sources without X–ray matches. Upper limits are at 3σ𝜎\sigma.
R ID Soft Cts Hard Cts Soft S/N Hard S/N HR S0.52subscript𝑆0.52S_{0.5-2} erg cm-2 s-1 S210subscript𝑆210S_{2-10} erg cm-2 s-1 z
2 <21.60absent21.60<21.60 <9.30absent9.30<9.30 0.00.00.0 0.00.00.0 - <0.64×10¹⁵absent0.64superscript1015<0.64\times 10^{-15} <0.12×10¹⁴absent0.12superscript1014<0.12\times 10^{-14} -
3 <15.30absent15.30<15.30 <28.70absent28.70<28.70 0.00.00.0 0.00.00.0 - <0.51×10¹⁵absent0.51superscript1015<0.51\times 10^{-15} <0.43×10¹⁴absent0.43superscript1014<0.43\times 10^{-14} -
4 10.90±5.10plus-or-minus10.905.1010.90\pm 5.10 <10.00absent10.00<10.00 2.32.32.3 0.00.00.0 1.001.00-1.00 0.32×10150.32superscript10150.32\times 10^{-15} <0.13×10¹⁴absent0.13superscript1014<0.13\times 10^{-14} -
5 <17.20absent17.20<17.20 <23.50absent23.50<23.50 0.00.00.0 0.00.00.0 - <0.50×10¹⁵absent0.50superscript1015<0.50\times 10^{-15} <0.36×10¹⁴absent0.36superscript1014<0.36\times 10^{-14} -
6 <20.10absent20.10<20.10 <18.90absent18.90<18.90 0.00.00.0 0.00.00.0 - <0.59×10¹⁵absent0.59superscript1015<0.59\times 10^{-15} <0.29×10¹⁴absent0.29superscript1014<0.29\times 10^{-14} -
8 <12.20absent12.20<12.20 <16.80absent16.80<16.80 0.00.00.0 0.00.00.0 - <0.36×10¹⁵absent0.36superscript1015<0.36\times 10^{-15} <0.22×10¹⁴absent0.22superscript1014<0.22\times 10^{-14} 0.860.860.86
9 <11.70absent11.70<11.70 <14.10absent14.10<14.10 0.00.00.0 0.00.00.0 - <0.33×10¹⁵absent0.33superscript1015<0.33\times 10^{-15} <0.21×10¹⁴absent0.21superscript1014<0.21\times 10^{-14} 0.670.670.67
10 <20.40absent20.40<20.40 <21.00absent21.00<21.00 0.00.00.0 0.00.00.0 - <0.65×10¹⁵absent0.65superscript1015<0.65\times 10^{-15} <0.30×10¹⁴absent0.30superscript1014<0.30\times 10^{-14} -
11 <6.90absent6.90<6.90 <21.30absent21.30<21.30 0.00.00.0 0.00.00.0 - <0.20×10¹⁵absent0.20superscript1015<0.20\times 10^{-15} <0.26×10¹⁴absent0.26superscript1014<0.26\times 10^{-14} 0.900.900.90
12 <13.30absent13.30<13.30 <15.60absent15.60<15.60 0.00.00.0 0.00.00.0 - <0.39×10¹⁵absent0.39superscript1015<0.39\times 10^{-15} <0.20×10¹⁴absent0.20superscript1014<0.20\times 10^{-14} 0.550.550.55
13 <23.70absent23.70<23.70 <10.80absent10.80<10.80 0.00.00.0 0.00.00.0 - <0.73×10¹⁵absent0.73superscript1015<0.73\times 10^{-15} <0.15×10¹⁴absent0.15superscript1014<0.15\times 10^{-14} 1.001.001.00
16 <16.00absent16.00<16.00 <18.10absent18.10<18.10 0.00.00.0 0.00.00.0 - <0.45×10¹⁵absent0.45superscript1015<0.45\times 10^{-15} <0.26×10¹⁴absent0.26superscript1014<0.26\times 10^{-14} -
17 <11.50absent11.50<11.50 <11.20absent11.20<11.20 0.00.00.0 0.00.00.0 - <0.31×10¹⁵absent0.31superscript1015<0.31\times 10^{-15} <0.13×10¹⁴absent0.13superscript1014<0.13\times 10^{-14} 0.550.550.55
19 <6.60absent6.60<6.60 <6.00absent6.00<6.00 0.00.00.0 0.00.00.0 - <0.19×10¹⁵absent0.19superscript1015<0.19\times 10^{-15} <0.73×10¹⁵absent0.73superscript1015<0.73\times 10^{-15} -
20 <13.60absent13.60<13.60 <24.40absent24.40<24.40 0.00.00.0 0.00.00.0 - <0.43×10¹⁵absent0.43superscript1015<0.43\times 10^{-15} <0.41×10¹⁴absent0.41superscript1014<0.41\times 10^{-14} 0.850.850.85
22 <11.30absent11.30<11.30 <12.70absent12.70<12.70 0.00.00.0 0.00.00.0 - <0.30×10¹⁵absent0.30superscript1015<0.30\times 10^{-15} <0.17×10¹⁴absent0.17superscript1014<0.17\times 10^{-14} -
23 <6.90absent6.90<6.90 <9.40absent9.40<9.40 0.00.00.0 0.00.00.0 - <0.19×10¹⁵absent0.19superscript1015<0.19\times 10^{-15} <0.11×10¹⁴absent0.11superscript1014<0.11\times 10^{-14} -
25 <7.40absent7.40<7.40 <3.20absent3.20<3.20 0.00.00.0 0.00.00.0 - <0.21×10¹⁵absent0.21superscript1015<0.21\times 10^{-15} <0.46×10¹⁵absent0.46superscript1015<0.46\times 10^{-15} 1.061.061.06
27 <8.10absent8.10<8.10 <6.70absent6.70<6.70 0.00.00.0 0.00.00.0 - <0.21×10¹⁵absent0.21superscript1015<0.21\times 10^{-15} <0.75×10¹⁵absent0.75superscript1015<0.75\times 10^{-15} 1.081.081.08
28 <7.30absent7.30<7.30 <14.40absent14.40<14.40 0.00.00.0 0.00.00.0 - <0.20×10¹⁵absent0.20superscript1015<0.20\times 10^{-15} <0.21×10¹⁴absent0.21superscript1014<0.21\times 10^{-14} 0.360.360.36
29 <7.60absent7.60<7.60 <11.80absent11.80<11.80 0.00.00.0 0.00.00.0 - <0.20×10¹⁵absent0.20superscript1015<0.20\times 10^{-15} <0.15×10¹⁴absent0.15superscript1014<0.15\times 10^{-14} -
30 <9.80absent9.80<9.80 <3.80absent3.80<3.80 0.00.00.0 0.00.00.0 - <0.26×10¹⁵absent0.26superscript1015<0.26\times 10^{-15} <0.42×10¹⁵absent0.42superscript1015<0.42\times 10^{-15} -
31 <6.80absent6.80<6.80 <4.30absent4.30<4.30 0.00.00.0 0.00.00.0 - <0.23×10¹⁵absent0.23superscript1015<0.23\times 10^{-15} <0.62×10¹⁵absent0.62superscript1015<0.62\times 10^{-15} -
32 <6.20absent6.20<6.20 <6.30absent6.30<6.30 0.00.00.0 0.00.00.0 - <0.17×10¹⁵absent0.17superscript1015<0.17\times 10^{-15} <0.74×10¹⁵absent0.74superscript1015<0.74\times 10^{-15} 0.690.690.69
34 <50.10absent50.10<50.10 <69.50absent69.50<69.50 0.00.00.0 0.00.00.0 - <0.39×10¹⁵absent0.39superscript1015<0.39\times 10^{-15} <0.32×10¹⁴absent0.32superscript1014<0.32\times 10^{-14} 0.260.260.26
36 <10.20absent10.20<10.20 <16.30absent16.30<16.30 0.00.00.0 0.00.00.0 - <0.27×10¹⁵absent0.27superscript1015<0.27\times 10^{-15} <0.22×10¹⁴absent0.22superscript1014<0.22\times 10^{-14} 0.110.110.11
38 <1.20absent1.20<1.20 <8.40absent8.40<8.40 0.00.00.0 0.00.00.0 - <0.36×10¹⁶absent0.36superscript1016<0.36\times 10^{-16} <0.10×10¹⁴absent0.10superscript1014<0.10\times 10^{-14} 0.830.830.83
39 <38.80absent38.80<38.80 <59.00absent59.00<59.00 0.00.00.0 0.00.00.0 - <0.29×10¹⁵absent0.29superscript1015<0.29\times 10^{-15} <0.26×10¹⁴absent0.26superscript1014<0.26\times 10^{-14} 0.680.680.68
40 <12.20absent12.20<12.20 <14.30absent14.30<14.30 0.00.00.0 0.00.00.0 - <0.32×10¹⁵absent0.32superscript1015<0.32\times 10^{-15} <0.19×10¹⁴absent0.19superscript1014<0.19\times 10^{-14} -
41 <8.80absent8.80<8.80 <4.00absent4.00<4.00 0.00.00.0 0.00.00.0 - <0.24×10¹⁵absent0.24superscript1015<0.24\times 10^{-15} <0.55×10¹⁵absent0.55superscript1015<0.55\times 10^{-15} 0.360.360.36
42 <1.90absent1.90<1.90 <4.80absent4.80<4.80 0.00.00.0 0.00.00.0 - <0.68×10¹⁶absent0.68superscript1016<0.68\times 10^{-16} <0.73×10¹⁵absent0.73superscript1015<0.73\times 10^{-15} -
43 21.90±10.50plus-or-minus21.9010.5021.90\pm 10.50 <47.00absent47.00<47.00 2.32.32.3 0.00.00.0 1.001.00-1.00 0.16×10150.16superscript10150.16\times 10^{-15} <0.21×10¹⁴absent0.21superscript1014<0.21\times 10^{-14} 0.540.540.54
44 <10.20absent10.20<10.20 <6.60absent6.60<6.60 0.00.00.0 0.00.00.0 - <0.27×10¹⁵absent0.27superscript1015<0.27\times 10^{-15} <0.88×10¹⁵absent0.88superscript1015<0.88\times 10^{-15} -
45 6.30±2.90plus-or-minus6.302.906.30\pm 2.90 <8.70absent8.70<8.70 2.22.22.2 0.00.00.0 1.001.00-1.00 0.20×10150.20superscript10150.20\times 10^{-15} <0.12×10¹⁴absent0.12superscript1014<0.12\times 10^{-14} 0.620.620.62
46 <51.80absent51.80<51.80 <44.00absent44.00<44.00 0.00.00.0 0.00.00.0 - <0.37×10¹⁵absent0.37superscript1015<0.37\times 10^{-15} <0.19×10¹⁴absent0.19superscript1014<0.19\times 10^{-14} -
47 <6.20absent6.20<6.20 <9.50absent9.50<9.50 0.00.00.0 0.00.00.0 - <0.20×10¹⁵absent0.20superscript1015<0.20\times 10^{-15} <0.16×10¹⁴absent0.16superscript1014<0.16\times 10^{-14} -
48 <12.00absent12.00<12.00 <8.90absent8.90<8.90 0.00.00.0 0.00.00.0 - <0.74×10¹⁵absent0.74superscript1015<0.74\times 10^{-15} <0.23×10¹⁴absent0.23superscript1014<0.23\times 10^{-14} 1.131.131.13
50 <4.80absent4.80<4.80 <3.80absent3.80<3.80 0.00.00.0 0.00.00.0 - <0.33×10¹⁵absent0.33superscript1015<0.33\times 10^{-15} <0.11×10¹⁴absent0.11superscript1014<0.11\times 10^{-14} 1.791.791.79
51 <32.40absent32.40<32.40 31.70±11.30plus-or-minus31.7011.3031.70\pm 11.30 0.00.00.0 3.13.13.1 1.001.001.00 <0.25×10¹⁵absent0.25superscript1015<0.25\times 10^{-15} 0.15×10140.15superscript10140.15\times 10^{-14} -
53 <16.70absent16.70<16.70 <40.70absent40.70<40.70 0.00.00.0 0.00.00.0 - <0.11×10¹⁵absent0.11superscript1015<0.11\times 10^{-15} <0.16×10¹⁴absent0.16superscript1014<0.16\times 10^{-14} -
55 <7.60absent7.60<7.60 <8.60absent8.60<8.60 0.00.00.0 0.00.00.0 - <0.20×10¹⁵absent0.20superscript1015<0.20\times 10^{-15} <0.96×10¹⁵absent0.96superscript1015<0.96\times 10^{-15} 1.501.501.50
57 <5.40absent5.40<5.40 <3.90absent3.90<3.90 0.00.00.0 0.00.00.0 - <0.14×10¹⁵absent0.14superscript1015<0.14\times 10^{-15} <0.43×10¹⁵absent0.43superscript1015<0.43\times 10^{-15} -
58 <12.10absent12.10<12.10 <10.20absent10.20<10.20 0.00.00.0 0.00.00.0 - <0.33×10¹⁵absent0.33superscript1015<0.33\times 10^{-15} <0.14×10¹⁴absent0.14superscript1014<0.14\times 10^{-14} 0.960.960.96
59 <24.00absent24.00<24.00 20.50±10.60plus-or-minus20.5010.6020.50\pm 10.60 0.00.00.0 2.12.12.1 1.001.001.00 <0.16×10¹⁵absent0.16superscript1015<0.16\times 10^{-15} 0.78×10150.78superscript10150.78\times 10^{-15} 0.710.710.71
60 <47.00absent47.00<47.00 <55.00absent55.00<55.00 0.00.00.0 0.00.00.0 - <0.31×10¹⁵absent0.31superscript1015<0.31\times 10^{-15} <0.21×10¹⁴absent0.21superscript1014<0.21\times 10^{-14} -
61 <13.80absent13.80<13.80 <15.90absent15.90<15.90 0.00.00.0 0.00.00.0 - <0.30×10¹⁵absent0.30superscript1015<0.30\times 10^{-15} <0.20×10¹⁴absent0.20superscript1014<0.20\times 10^{-14} 0.760.760.76
62 <1.30absent1.30<1.30 <8.40absent8.40<8.40 0.00.00.0 0.00.00.0 - <0.35×10¹⁶absent0.35superscript1016<0.35\times 10^{-16} <0.94×10¹⁵absent0.94superscript1015<0.94\times 10^{-15} -
63 <19.50absent19.50<19.50 <40.10absent40.10<40.10 0.00.00.0 0.00.00.0 - <0.12×10¹⁵absent0.12superscript1015<0.12\times 10^{-15} <0.15×10¹⁴absent0.15superscript1014<0.15\times 10^{-14} 0.770.770.77
64 <26.70absent26.70<26.70 <13.30absent13.30<13.30 0.00.00.0 0.00.00.0 - <0.17×10¹⁵absent0.17superscript1015<0.17\times 10^{-15} <0.49×10¹⁵absent0.49superscript1015<0.49\times 10^{-15} -
65 <1.40absent1.40<1.40 <0.10absent0.10<-0.10 0.00.00.0 0.00.00.0 - <0.36×10¹⁶absent0.36superscript1016<0.36\times 10^{-16} <0.13×10¹⁶absent0.13superscript1016<-0.13\times 10^{-16} -
67 <6.20absent6.20<6.20 <8.80absent8.80<8.80 0.00.00.0 0.00.00.0 - <0.16×10¹⁵absent0.16superscript1015<0.16\times 10^{-15} <0.98×10¹⁵absent0.98superscript1015<0.98\times 10^{-15} -
69 <13.70absent13.70<13.70 <10.10absent10.10<10.10 0.00.00.0 0.00.00.0 - <0.27×10¹⁵absent0.27superscript1015<0.27\times 10^{-15} <0.12×10¹⁴absent0.12superscript1014<0.12\times 10^{-14} 0.810.810.81
70 <16.10absent16.10<16.10 <10.50absent10.50<10.50 0.00.00.0 0.00.00.0 - <0.11×10¹⁵absent0.11superscript1015<0.11\times 10^{-15} <0.43×10¹⁵absent0.43superscript1015<0.43\times 10^{-15} -
72 <34.30absent34.30<34.30 <39.40absent39.40<39.40 0.00.00.0 0.00.00.0 - <0.21×10¹⁵absent0.21superscript1015<0.21\times 10^{-15} <0.14×10¹⁴absent0.14superscript1014<0.14\times 10^{-14} -
74 <1.50absent1.50<1.50 <10.50absent10.50<10.50 0.00.00.0 0.00.00.0 - <0.39×10¹⁶absent0.39superscript1016<0.39\times 10^{-16} <0.14×10¹⁴absent0.14superscript1014<0.14\times 10^{-14} -
75 <20.20absent20.20<20.20 <23.20absent23.20<23.20 0.00.00.0 0.00.00.0 - <0.13×10¹⁵absent0.13superscript1015<0.13\times 10^{-15} <0.86×10¹⁵absent0.86superscript1015<0.86\times 10^{-15} -
77 <4.10absent4.10<4.10 <7.00absent7.00<7.00 0.00.00.0 0.00.00.0 - <0.12×10¹⁵absent0.12superscript1015<0.12\times 10^{-15} <0.10×10¹⁴absent0.10superscript1014<0.10\times 10^{-14} -
78 <8.30absent8.30<8.30 <9.00absent9.00<9.00 0.00.00.0 0.00.00.0 - <0.22×10¹⁵absent0.22superscript1015<0.22\times 10^{-15} <0.12×10¹⁴absent0.12superscript1014<0.12\times 10^{-14} -
79 <19.20absent19.20<19.20 <8.80absent8.80<8.80 0.00.00.0 0.00.00.0 - <0.12×10¹⁵absent0.12superscript1015<0.12\times 10^{-15} <0.31×10¹⁵absent0.31superscript1015<0.31\times 10^{-15} -
81 <11.50absent11.50<11.50 <5.40absent5.40<5.40 0.00.00.0 0.00.00.0 - <0.30×10¹⁵absent0.30superscript1015<0.30\times 10^{-15} <0.73×10¹⁵absent0.73superscript1015<0.73\times 10^{-15} 0.500.500.50
82 <16.00absent16.00<16.00 <19.90absent19.90<19.90 0.00.00.0 0.00.00.0 - <0.97×10¹⁶absent0.97superscript1016<0.97\times 10^{-16} <0.70×10¹⁵absent0.70superscript1015<0.70\times 10^{-15} 1.021.021.02
83 <18.80absent18.80<18.80 <17.40absent17.40<17.40 0.00.00.0 0.00.00.0 - <0.12×10¹⁵absent0.12superscript1015<0.12\times 10^{-15} <0.66×10¹⁵absent0.66superscript1015<0.66\times 10^{-15} 0.030.030.03
88 <4.40absent4.40<4.40 <8.00absent8.00<8.00 0.00.00.0 0.00.00.0 - <0.12×10¹⁵absent0.12superscript1015<0.12\times 10^{-15} <0.11×10¹⁴absent0.11superscript1014<0.11\times 10^{-14} 0.650.650.65
89 <11.10absent11.10<11.10 <24.30absent24.30<24.30 0.00.00.0 0.00.00.0 - <0.66×10¹⁶absent0.66superscript1016<0.66\times 10^{-16} <0.83×10¹⁵absent0.83superscript1015<0.83\times 10^{-15} 0.650.650.65
90 <12.10absent12.10<12.10 <17.60absent17.60<17.60 0.00.00.0 0.00.00.0 - <0.33×10¹⁵absent0.33superscript1015<0.33\times 10^{-15} <0.24×10¹⁴absent0.24superscript1014<0.24\times 10^{-14} 0.650.650.65
91 <10.30absent10.30<10.30 <14.80absent14.80<14.80 0.00.00.0 0.00.00.0 - <0.64×10¹⁶absent0.64superscript1016<0.64\times 10^{-16} <0.53×10¹⁵absent0.53superscript1015<0.53\times 10^{-15} 1.611.611.61
94 <25.50absent25.50<25.50 <12.60absent12.60<12.60 0.00.00.0 0.00.00.0 - <0.15×10¹⁵absent0.15superscript1015<0.15\times 10^{-15} <0.43×10¹⁵absent0.43superscript1015<0.43\times 10^{-15} 0.550.550.55
95 <15.00absent15.00<15.00 <23.40absent23.40<23.40 0.00.00.0 0.00.00.0 - <0.10×10¹⁵absent0.10superscript1015<0.10\times 10^{-15} <0.92×10¹⁵absent0.92superscript1015<0.92\times 10^{-15} 0.580.580.58
97 <29.40absent29.40<29.40 <13.60absent13.60<13.60 0.00.00.0 0.00.00.0 - <0.18×10¹⁵absent0.18superscript1015<0.18\times 10^{-15} <0.48×10¹⁵absent0.48superscript1015<0.48\times 10^{-15} -
98 <8.90absent8.90<8.90 <5.20absent5.20<5.20 0.00.00.0 0.00.00.0 - <0.54×10¹⁵absent0.54superscript1015<0.54\times 10^{-15} <0.16×10¹⁴absent0.16superscript1014<0.16\times 10^{-14} 1.051.051.05
100 <18.80absent18.80<18.80 <30.10absent30.10<30.10 0.00.00.0 0.00.00.0 - <0.22×10¹⁵absent0.22superscript1015<0.22\times 10^{-15} <0.21×10¹⁴absent0.21superscript1014<0.21\times 10^{-14} -
101 <19.10absent19.10<19.10 <16.00absent16.00<16.00 0.00.00.0 0.00.00.0 - <0.11×10¹⁵absent0.11superscript1015<0.11\times 10^{-15} <0.55×10¹⁵absent0.55superscript1015<0.55\times 10^{-15} 0.050.050.05
103 <35.80absent35.80<35.80 <32.00absent32.00<32.00 0.00.00.0 0.00.00.0 - <0.33×10¹⁵absent0.33superscript1015<0.33\times 10^{-15} <0.18×10¹⁴absent0.18superscript1014<0.18\times 10^{-14} 0.730.730.73
104 <12.40absent12.40<12.40 <3.20absent3.20<3.20 0.00.00.0 0.00.00.0 - <0.33×10¹⁵absent0.33superscript1015<0.33\times 10^{-15} <0.37×10¹⁵absent0.37superscript1015<0.37\times 10^{-15} -
106 <23.40absent23.40<23.40 17.10±7.20plus-or-minus17.107.2017.10\pm 7.20 0.00.00.0 2.62.62.6 1.001.001.00 <0.67×10¹⁵absent0.67superscript1015<0.67\times 10^{-15} 0.21×10140.21superscript10140.21\times 10^{-14} 0.760.760.76
107 <4.90absent4.90<4.90 <10.00absent10.00<10.00 0.00.00.0 0.00.00.0 - <0.14×10¹⁵absent0.14superscript1015<0.14\times 10^{-15} <0.14×10¹⁴absent0.14superscript1014<0.14\times 10^{-14} -
109 8.70±4.00plus-or-minus8.704.008.70\pm 4.00 <0.40absent0.40<0.40 2.22.22.2 0.00.00.0 1.001.00-1.00 0.24×10150.24superscript10150.24\times 10^{-15} <0.57×10¹⁶absent0.57superscript1016<0.57\times 10^{-16} 0.140.140.14
111 <20.40absent20.40<20.40 <21.70absent21.70<21.70 0.00.00.0 0.00.00.0 - <0.12×10¹⁵absent0.12superscript1015<0.12\times 10^{-15} <0.76×10¹⁵absent0.76superscript1015<0.76\times 10^{-15} 0.120.120.12
114 <17.30absent17.30<17.30 <20.60absent20.60<20.60 0.00.00.0 0.00.00.0 - <0.13×10¹⁵absent0.13superscript1015<0.13\times 10^{-15} <0.88×10¹⁵absent0.88superscript1015<0.88\times 10^{-15} 1.001.001.00
116 <13.90absent13.90<13.90 <27.10absent27.10<27.10 0.00.00.0 0.00.00.0 - <0.13×10¹⁵absent0.13superscript1015<0.13\times 10^{-15} <0.15×10¹⁴absent0.15superscript1014<0.15\times 10^{-14} 0.700.700.70
117 <18.70absent18.70<18.70 <21.10absent21.10<21.10 0.00.00.0 0.00.00.0 - <0.15×10¹⁵absent0.15superscript1015<0.15\times 10^{-15} <0.96×10¹⁵absent0.96superscript1015<0.96\times 10^{-15} 0.340.340.34
118 <18.90absent18.90<18.90 <16.60absent16.60<16.60 0.00.00.0 0.00.00.0 - <0.11×10¹⁵absent0.11superscript1015<0.11\times 10^{-15} <0.57×10¹⁵absent0.57superscript1015<0.57\times 10^{-15} 0.670.670.67
119 <18.60absent18.60<18.60 <8.00absent8.00<8.00 0.00.00.0 0.00.00.0 - <0.52×10¹⁵absent0.52superscript1015<0.52\times 10^{-15} <0.97×10¹⁵absent0.97superscript1015<0.97\times 10^{-15} 0.710.710.71
120 13.00±5.70plus-or-minus13.005.7013.00\pm 5.70 <21.60absent21.60<21.60 2.32.32.3 0.00.00.0 1.001.00-1.00 0.77×10160.77superscript10160.77\times 10^{-16} <0.74×10¹⁵absent0.74superscript1015<0.74\times 10^{-15} 0.520.520.52
121 <20.90absent20.90<20.90 <18.90absent18.90<18.90 0.00.00.0 0.00.00.0 - <0.13×10¹⁵absent0.13superscript1015<0.13\times 10^{-15} <0.69×10¹⁵absent0.69superscript1015<0.69\times 10^{-15} 2.122.122.12
123 <23.50absent23.50<23.50 <24.10absent24.10<24.10 0.00.00.0 0.00.00.0 - <0.14×10¹⁵absent0.14superscript1015<0.14\times 10^{-15} <0.82×10¹⁵absent0.82superscript1015<0.82\times 10^{-15} 0.730.730.73
124 <15.80absent15.80<15.80 <19.90absent19.90<19.90 0.00.00.0 0.00.00.0 - <0.45×10¹⁵absent0.45superscript1015<0.45\times 10^{-15} <0.30×10¹⁴absent0.30superscript1014<0.30\times 10^{-14} 0.130.130.13
126 <21.80absent21.80<21.80 <18.90absent18.90<18.90 0.00.00.0 0.00.00.0 - <0.14×10¹⁵absent0.14superscript1015<0.14\times 10^{-15} <0.70×10¹⁵absent0.70superscript1015<0.70\times 10^{-15} 1.711.711.71
127 <11.60absent11.60<11.60 <22.60absent22.60<22.60 0.00.00.0 0.00.00.0 - <0.32×10¹⁵absent0.32superscript1015<0.32\times 10^{-15} <0.27×10¹⁴absent0.27superscript1014<0.27\times 10^{-14} 0.120.120.12
128 <16.10absent16.10<16.10 <24.00absent24.00<24.00 0.00.00.0 0.00.00.0 - <0.46×10¹⁵absent0.46superscript1015<0.46\times 10^{-15} <0.36×10¹⁴absent0.36superscript1014<0.36\times 10^{-14} 0.120.120.12
129 <12.00absent12.00<12.00 <21.30absent21.30<21.30 0.00.00.0 0.00.00.0 - <0.35×10¹⁵absent0.35superscript1015<0.35\times 10^{-15} <0.33×10¹⁴absent0.33superscript1014<0.33\times 10^{-14} 0.540.540.54
130 16.90±6.20plus-or-minus16.906.2016.90\pm 6.20 <29.60absent29.60<29.60 2.82.82.8 0.00.00.0 1.001.00-1.00 0.11×10150.11superscript10150.11\times 10^{-15} <0.11×10¹⁴absent0.11superscript1014<0.11\times 10^{-14} 0.130.130.13
131 <34.80absent34.80<34.80 <16.90absent16.90<16.90 0.00.00.0 0.00.00.0 - <0.68×10¹⁵absent0.68superscript1015<0.68\times 10^{-15} <0.20×10¹⁴absent0.20superscript1014<0.20\times 10^{-14} 0.610.610.61
135 12.90±5.40plus-or-minus12.905.4012.90\pm 5.40 <23.40absent23.40<23.40 2.62.62.6 0.00.00.0 1.001.00-1.00 0.36×10150.36superscript10150.36\times 10^{-15} <0.28×10¹⁴absent0.28superscript1014<0.28\times 10^{-14} 1.121.121.12
136 <22.90absent22.90<22.90 <11.40absent11.40<11.40 0.00.00.0 0.00.00.0 - <0.15×10¹⁵absent0.15superscript1015<0.15\times 10^{-15} <0.43×10¹⁵absent0.43superscript1015<0.43\times 10^{-15} 0.250.250.25
137 <29.80absent29.80<29.80 <43.50absent43.50<43.50 0.00.00.0 0.00.00.0 - <0.58×10¹⁵absent0.58superscript1015<0.58\times 10^{-15} <0.50×10¹⁴absent0.50superscript1014<0.50\times 10^{-14} 0.390.390.39
143 32.20±13.00plus-or-minus32.2013.0032.20\pm 13.00 <57.40absent57.40<57.40 3.03.03.0 0.00.00.0 1.001.00-1.00 0.40×10150.40superscript10150.40\times 10^{-15} <0.43×10¹⁴absent0.43superscript1014<0.43\times 10^{-14} 0.130.130.13
144 <23.10absent23.10<23.10 <26.90absent26.90<26.90 0.00.00.0 0.00.00.0 - <0.24×10¹⁵absent0.24superscript1015<0.24\times 10^{-15} <0.17×10¹⁴absent0.17superscript1014<0.17\times 10^{-14} -
146 15.70±5.40plus-or-minus15.705.4015.70\pm 5.40 <18.90absent18.90<18.90 3.03.03.0 0.00.00.0 1.001.00-1.00 0.91×10160.91superscript10160.91\times 10^{-16} <0.63×10¹⁵absent0.63superscript1015<0.63\times 10^{-15} 1.561.561.56
147 <19.30absent19.30<19.30 <39.40absent39.40<39.40 0.00.00.0 0.00.00.0 - <0.54×10¹⁵absent0.54superscript1015<0.54\times 10^{-15} <0.61×10¹⁴absent0.61superscript1014<0.61\times 10^{-14} -
149 <16.20absent16.20<16.20 <22.90absent22.90<22.90 0.00.00.0 0.00.00.0 - <0.95×10¹⁶absent0.95superscript1016<0.95\times 10^{-16} <0.79×10¹⁵absent0.79superscript1015<0.79\times 10^{-15} 0.360.360.36
150 <20.80absent20.80<20.80 <19.80absent19.80<19.80 0.00.00.0 0.00.00.0 - <0.14×10¹⁵absent0.14superscript1015<0.14\times 10^{-15} <0.75×10¹⁵absent0.75superscript1015<0.75\times 10^{-15} 0.670.670.67
152 <28.70absent28.70<28.70 <32.70absent32.70<32.70 0.00.00.0 0.00.00.0 - <0.35×10¹⁵absent0.35superscript1015<0.35\times 10^{-15} <0.24×10¹⁴absent0.24superscript1014<0.24\times 10^{-14} 0.210.210.21
153 <12.10absent12.10<12.10 <20.00absent20.00<20.00 0.00.00.0 0.00.00.0 - <0.32×10¹⁵absent0.32superscript1015<0.32\times 10^{-15} <0.28×10¹⁴absent0.28superscript1014<0.28\times 10^{-14} 0.680.680.68
155 <15.40absent15.40<15.40 <33.30absent33.30<33.30 0.00.00.0 0.00.00.0 - <0.97×10¹⁶absent0.97superscript1016<0.97\times 10^{-16} <0.12×10¹⁴absent0.12superscript1014<0.12\times 10^{-14} -
158 <18.30absent18.30<18.30 <30.90absent30.90<30.90 0.00.00.0 0.00.00.0 - <0.58×10¹⁵absent0.58superscript1015<0.58\times 10^{-15} <0.43×10¹⁴absent0.43superscript1014<0.43\times 10^{-14} -
159 <42.50absent42.50<42.50 <58.70absent58.70<58.70 0.00.00.0 0.00.00.0 - <0.38×10¹⁵absent0.38superscript1015<0.38\times 10^{-15} <0.31×10¹⁴absent0.31superscript1014<0.31\times 10^{-14} 0.130.130.13
160 <19.80absent19.80<19.80 18.80±6.70plus-or-minus18.806.7018.80\pm 6.70 0.00.00.0 2.92.92.9 1.001.001.00 <0.12×10¹⁵absent0.12superscript1015<0.12\times 10^{-15} 0.67×10150.67superscript10150.67\times 10^{-15} 0.520.520.52
161 <10.80absent10.80<10.80 <9.30absent9.30<9.30 0.00.00.0 0.00.00.0 - <0.63×10¹⁶absent0.63superscript1016<0.63\times 10^{-16} <0.31×10¹⁵absent0.31superscript1015<0.31\times 10^{-15} 1.621.621.62
164 11.20±5.40plus-or-minus11.205.4011.20\pm 5.40 <19.10absent19.10<19.10 2.22.22.2 0.00.00.0 1.001.00-1.00 0.72×10160.72superscript10160.72\times 10^{-16} <0.72×10¹⁵absent0.72superscript1015<0.72\times 10^{-15} 0.590.590.59
167 <7.20absent7.20<7.20 <11.90absent11.90<11.90 0.00.00.0 0.00.00.0 - <0.44×10¹⁶absent0.44superscript1016<0.44\times 10^{-16} <0.42×10¹⁵absent0.42superscript1015<0.42\times 10^{-15} 0.610.610.61
168 <15.80absent15.80<15.80 <18.00absent18.00<18.00 0.00.00.0 0.00.00.0 - <0.98×10¹⁶absent0.98superscript1016<0.98\times 10^{-16} <0.65×10¹⁵absent0.65superscript1015<0.65\times 10^{-15} 1.291.291.29
169 10.40±4.80plus-or-minus10.404.8010.40\pm 4.80 <14.30absent14.30<14.30 2.22.22.2 0.00.00.0 1.001.00-1.00 0.64×10160.64superscript10160.64\times 10^{-16} <0.51×10¹⁵absent0.51superscript1015<0.51\times 10^{-15} 0.690.690.69
171 <21.80absent21.80<21.80 <14.80absent14.80<14.80 0.00.00.0 0.00.00.0 - <0.59×10¹⁵absent0.59superscript1015<0.59\times 10^{-15} <0.21×10¹⁴absent0.21superscript1014<0.21\times 10^{-14} -
172 <16.70absent16.70<16.70 <32.80absent32.80<32.80 0.00.00.0 0.00.00.0 - <0.11×10¹⁵absent0.11superscript1015<0.11\times 10^{-15} <0.12×10¹⁴absent0.12superscript1014<0.12\times 10^{-14} 0.980.980.98
174 <5.90absent5.90<5.90 <10.10absent10.10<10.10 0.00.00.0 0.00.00.0 - <0.16×10¹⁵absent0.16superscript1015<0.16\times 10^{-15} <0.14×10¹⁴absent0.14superscript1014<0.14\times 10^{-14} 0.610.610.61
175 <14.10absent14.10<14.10 <5.90absent5.90<5.90 0.00.00.0 0.00.00.0 - <0.40×10¹⁵absent0.40superscript1015<0.40\times 10^{-15} <0.70×10¹⁵absent0.70superscript1015<0.70\times 10^{-15} 0.150.150.15
177 <30.90absent30.90<30.90 <31.30absent31.30<31.30 0.00.00.0 0.00.00.0 - <0.20×10¹⁵absent0.20superscript1015<0.20\times 10^{-15} <0.12×10¹⁴absent0.12superscript1014<0.12\times 10^{-14} 0.950.950.95
179 <35.30absent35.30<35.30 <34.30absent34.30<34.30 0.00.00.0 0.00.00.0 - <0.30×10¹⁵absent0.30superscript1015<0.30\times 10^{-15} <0.17×10¹⁴absent0.17superscript1014<0.17\times 10^{-14} 1.091.091.09
180 <24.80absent24.80<24.80 <14.90absent14.90<14.90 0.00.00.0 0.00.00.0 - <0.15×10¹⁵absent0.15superscript1015<0.15\times 10^{-15} <0.51×10¹⁵absent0.51superscript1015<0.51\times 10^{-15} 0.190.190.19
181 24.60±7.90plus-or-minus24.607.9024.60\pm 7.90 <27.70absent27.70<27.70 3.33.33.3 0.00.00.0 1.001.00-1.00 0.15×10150.15superscript10150.15\times 10^{-15} <0.10×10¹⁴absent0.10superscript1014<0.10\times 10^{-14} 0.460.460.46
182 <15.10absent15.10<15.10 <23.70absent23.70<23.70 0.00.00.0 0.00.00.0 - <0.41×10¹⁵absent0.41superscript1015<0.41\times 10^{-15} <0.35×10¹⁴absent0.35superscript1014<0.35\times 10^{-14} -
184 <15.80absent15.80<15.80 <17.10absent17.10<17.10 0.00.00.0 0.00.00.0 - <0.98×10¹⁶absent0.98superscript1016<0.98\times 10^{-16} <0.61×10¹⁵absent0.61superscript1015<0.61\times 10^{-15} 2.312.312.31
185 18.60±6.70plus-or-minus18.606.7018.60\pm 6.70 <21.20absent21.20<21.20 2.92.92.9 0.00.00.0 1.001.00-1.00 0.12×10150.12superscript10150.12\times 10^{-15} <0.77×10¹⁵absent0.77superscript1015<0.77\times 10^{-15} 1.991.991.99
187 11.70±4.80plus-or-minus11.704.8011.70\pm 4.80 <20.20absent20.20<20.20 2.52.52.5 0.00.00.0 1.001.00-1.00 0.83×10160.83superscript10160.83\times 10^{-16} <0.83×10¹⁵absent0.83superscript1015<0.83\times 10^{-15} 2.292.292.29
189 18.00±8.40plus-or-minus18.008.4018.00\pm 8.40 <35.70absent35.70<35.70 2.32.32.3 0.00.00.0 1.001.00-1.00 0.12×10150.12superscript10150.12\times 10^{-15} <0.14×10¹⁴absent0.14superscript1014<0.14\times 10^{-14} 1.301.301.30
191 <42.50absent42.50<42.50 36.50±13.30plus-or-minus36.5013.3036.50\pm 13.30 0.00.00.0 3.13.13.1 1.001.001.00 <0.28×10¹⁵absent0.28superscript1015<0.28\times 10^{-15} 0.14×10140.14superscript10140.14\times 10^{-14} 0.350.350.35
194 <5.30absent5.30<5.30 <4.50absent4.50<4.50 0.00.00.0 0.00.00.0 - <0.14×10¹⁵absent0.14superscript1015<0.14\times 10^{-15} <0.60×10¹⁵absent0.60superscript1015<0.60\times 10^{-15} -
195 <34.50absent34.50<34.50 <28.80absent28.80<28.80 0.00.00.0 0.00.00.0 - <0.22×10¹⁵absent0.22superscript1015<0.22\times 10^{-15} <0.11×10¹⁴absent0.11superscript1014<0.11\times 10^{-14} 0.980.980.98
196 <11.50absent11.50<11.50 <11.40absent11.40<11.40 0.00.00.0 0.00.00.0 - <0.31×10¹⁵absent0.31superscript1015<0.31\times 10^{-15} <0.13×10¹⁴absent0.13superscript1014<0.13\times 10^{-14} 0.250.250.25
197 14.30±4.80plus-or-minus14.304.8014.30\pm 4.80 <10.00absent10.00<10.00 3.13.13.1 0.00.00.0 1.001.00-1.00 0.39×10150.39superscript10150.39\times 10^{-15} <0.12×10¹⁴absent0.12superscript1014<0.12\times 10^{-14} 0.250.250.25
198 <6.00absent6.00<6.00 <6.60absent6.60<6.60 0.00.00.0 0.00.00.0 - <0.16×10¹⁵absent0.16superscript1015<0.16\times 10^{-15} <0.75×10¹⁵absent0.75superscript1015<0.75\times 10^{-15} 0.780.780.78
199 <12.10absent12.10<12.10 <12.80absent12.80<12.80 0.00.00.0 0.00.00.0 - <0.32×10¹⁵absent0.32superscript1015<0.32\times 10^{-15} <0.18×10¹⁴absent0.18superscript1014<0.18\times 10^{-14} 0.550.550.55
201 <26.70absent26.70<26.70 <25.40absent25.40<25.40 0.00.00.0 0.00.00.0 - <0.17×10¹⁵absent0.17superscript1015<0.17\times 10^{-15} <0.96×10¹⁵absent0.96superscript1015<0.96\times 10^{-15} 0.530.530.53
202 <5.40absent5.40<5.40 <11.70absent11.70<11.70 0.00.00.0 0.00.00.0 - <0.14×10¹⁵absent0.14superscript1015<0.14\times 10^{-15} <0.15×10¹⁴absent0.15superscript1014<0.15\times 10^{-14} -
203 <6.70absent6.70<6.70 <4.00absent4.00<4.00 0.00.00.0 0.00.00.0 - <0.18×10¹⁵absent0.18superscript1015<0.18\times 10^{-15} <0.45×10¹⁵absent0.45superscript1015<0.45\times 10^{-15} 1.231.231.23
204 <11.30absent11.30<11.30 <9.80absent9.80<9.80 0.00.00.0 0.00.00.0 - <0.30×10¹⁵absent0.30superscript1015<0.30\times 10^{-15} <0.14×10¹⁴absent0.14superscript1014<0.14\times 10^{-14} 1.131.131.13
205 <18.70absent18.70<18.70 <11.20absent11.20<11.20 0.00.00.0 0.00.00.0 - <0.51×10¹⁵absent0.51superscript1015<0.51\times 10^{-15} <0.13×10¹⁴absent0.13superscript1014<0.13\times 10^{-14} 0.150.150.15
209 29.10±8.60plus-or-minus29.108.6029.10\pm 8.60 <44.20absent44.20<44.20 3.73.73.7 0.00.00.0 1.001.00-1.00 0.40×10150.40superscript10150.40\times 10^{-15} <0.36×10¹⁴absent0.36superscript1014<0.36\times 10^{-14} -
210 <5.30absent5.30<5.30 <8.90absent8.90<8.90 0.00.00.0 0.00.00.0 - <0.15×10¹⁵absent0.15superscript1015<0.15\times 10^{-15} <0.11×10¹⁴absent0.11superscript1014<0.11\times 10^{-14} 1.131.131.13
212 <23.30absent23.30<23.30 <19.90absent19.90<19.90 0.00.00.0 0.00.00.0 - <0.17×10¹⁵absent0.17superscript1015<0.17\times 10^{-15} <0.85×10¹⁵absent0.85superscript1015<0.85\times 10^{-15} 0.580.580.58
213 <9.50absent9.50<9.50 <10.90absent10.90<10.90 0.00.00.0 0.00.00.0 - <0.24×10¹⁵absent0.24superscript1015<0.24\times 10^{-15} <0.14×10¹⁴absent0.14superscript1014<0.14\times 10^{-14} -
216 <2.90absent2.90<2.90 <7.10absent7.10<7.10 0.00.00.0 0.00.00.0 - <0.14×10¹⁵absent0.14superscript1015<0.14\times 10^{-15} <0.18×10¹⁴absent0.18superscript1014<0.18\times 10^{-14} -
221 <9.60absent9.60<9.60 <11.70absent11.70<11.70 0.00.00.0 0.00.00.0 - <0.25×10¹⁵absent0.25superscript1015<0.25\times 10^{-15} <0.16×10¹⁴absent0.16superscript1014<0.16\times 10^{-14} 0.690.690.69
222 <16.70absent16.70<16.70 <12.30absent12.30<12.30 0.00.00.0 0.00.00.0 - <0.46×10¹⁵absent0.46superscript1015<0.46\times 10^{-15} <0.15×10¹⁴absent0.15superscript1014<0.15\times 10^{-14} -
223 <33.80absent33.80<33.80 <33.80absent33.80<33.80 0.00.00.0 0.00.00.0 - <0.29×10¹⁵absent0.29superscript1015<0.29\times 10^{-15} <0.17×10¹⁴absent0.17superscript1014<0.17\times 10^{-14} -
224 <38.90absent38.90<38.90 <35.70absent35.70<35.70 0.00.00.0 0.00.00.0 - <0.81×10¹⁵absent0.81superscript1015<0.81\times 10^{-15} <0.45×10¹⁴absent0.45superscript1014<0.45\times 10^{-14} 0.560.560.56
226 <29.30absent29.30<29.30 <11.20absent11.20<11.20 0.00.00.0 0.00.00.0 - <0.34×10¹⁵absent0.34superscript1015<0.34\times 10^{-15} <0.79×10¹⁵absent0.79superscript1015<0.79\times 10^{-15} -
227 <5.60absent5.60<5.60 <19.70absent19.70<19.70 0.00.00.0 0.00.00.0 - <0.15×10¹⁵absent0.15superscript1015<0.15\times 10^{-15} <0.27×10¹⁴absent0.27superscript1014<0.27\times 10^{-14} -
229 27.70±10.80plus-or-minus27.7010.8027.70\pm 10.80 <56.10absent56.10<56.10 2.92.92.9 0.00.00.0 1.001.00-1.00 0.26×10150.26superscript10150.26\times 10^{-15} <0.32×10¹⁴absent0.32superscript1014<0.32\times 10^{-14} 0.180.180.18
233 <12.10absent12.10<12.10 <7.50absent7.50<7.50 0.00.00.0 0.00.00.0 - <0.32×10¹⁵absent0.32superscript1015<0.32\times 10^{-15} <0.10×10¹⁴absent0.10superscript1014<0.10\times 10^{-14} 0.530.530.53
234 <9.10absent9.10<9.10 <5.60absent5.60<5.60 0.00.00.0 0.00.00.0 - <0.25×10¹⁵absent0.25superscript1015<0.25\times 10^{-15} <0.82×10¹⁵absent0.82superscript1015<0.82\times 10^{-15} -
235 <16.30absent16.30<16.30 <22.50absent22.50<22.50 0.00.00.0 0.00.00.0 - <0.27×10¹⁵absent0.27superscript1015<0.27\times 10^{-15} <0.22×10¹⁴absent0.22superscript1014<0.22\times 10^{-14} -
236 <26.80absent26.80<26.80 30.00±13.90plus-or-minus30.0013.9030.00\pm 13.90 0.00.00.0 2.62.62.6 1.001.001.00 <0.28×10¹⁵absent0.28superscript1015<0.28\times 10^{-15} 0.19×10140.19superscript10140.19\times 10^{-14} -
237 <17.00absent17.00<17.00 <18.60absent18.60<18.60 0.00.00.0 0.00.00.0 - <0.47×10¹⁵absent0.47superscript1015<0.47\times 10^{-15} <0.28×10¹⁴absent0.28superscript1014<0.28\times 10^{-14} -
238 <16.60absent16.60<16.60 <13.90absent13.90<13.90 0.00.00.0 0.00.00.0 - <0.45×10¹⁵absent0.45superscript1015<0.45\times 10^{-15} <0.20×10¹⁴absent0.20superscript1014<0.20\times 10^{-14} 1.101.101.10
239 <28.60absent28.60<28.60 <37.50absent37.50<37.50 0.00.00.0 0.00.00.0 - <0.41×10¹⁵absent0.41superscript1015<0.41\times 10^{-15} <0.33×10¹⁴absent0.33superscript1014<0.33\times 10^{-14} 1.031.031.03
241 <3.00absent3.00<3.00 <7.60absent7.60<7.60 0.00.00.0 0.00.00.0 - <0.77×10¹⁶absent0.77superscript1016<0.77\times 10^{-16} <0.10×10¹⁴absent0.10superscript1014<0.10\times 10^{-14} 0.570.570.57
242 <11.00absent11.00<11.00 <6.00absent6.00<6.00 0.00.00.0 0.00.00.0 - <0.28×10¹⁵absent0.28superscript1015<0.28\times 10^{-15} <0.80×10¹⁵absent0.80superscript1015<0.80\times 10^{-15} -
244 <11.10absent11.10<11.10 <9.90absent9.90<9.90 0.00.00.0 0.00.00.0 - <0.32×10¹⁵absent0.32superscript1015<0.32\times 10^{-15} <0.15×10¹⁴absent0.15superscript1014<0.15\times 10^{-14} -
245 <12.60absent12.60<12.60 <13.90absent13.90<13.90 0.00.00.0 0.00.00.0 - <0.36×10¹⁵absent0.36superscript1015<0.36\times 10^{-15} <0.22×10¹⁴absent0.22superscript1014<0.22\times 10^{-14} -
247 <13.70absent13.70<13.70 <17.90absent17.90<17.90 0.00.00.0 0.00.00.0 - <0.38×10¹⁵absent0.38superscript1015<0.38\times 10^{-15} <0.21×10¹⁴absent0.21superscript1014<0.21\times 10^{-14} -
248 <15.20absent15.20<15.20 <22.90absent22.90<22.90 0.00.00.0 0.00.00.0 - <0.44×10¹⁵absent0.44superscript1015<0.44\times 10^{-15} <0.36×10¹⁴absent0.36superscript1014<0.36\times 10^{-14} -
253 <7.70absent7.70<7.70 <10.80absent10.80<10.80 0.00.00.0 0.00.00.0 - <0.21×10¹⁵absent0.21superscript1015<0.21\times 10^{-15} <0.13×10¹⁴absent0.13superscript1014<0.13\times 10^{-14} 0.540.540.54
254 <13.70absent13.70<13.70 <10.00absent10.00<10.00 0.00.00.0 0.00.00.0 - <0.38×10¹⁵absent0.38superscript1015<0.38\times 10^{-15} <0.12×10¹⁴absent0.12superscript1014<0.12\times 10^{-14} 0.450.450.45
255 <10.80absent10.80<10.80 <4.20absent4.20<4.20 0.00.00.0 0.00.00.0 - <0.29×10¹⁵absent0.29superscript1015<0.29\times 10^{-15} <0.59×10¹⁵absent0.59superscript1015<0.59\times 10^{-15} -
256 <10.70absent10.70<10.70 <19.20absent19.20<19.20 0.00.00.0 0.00.00.0 - <0.30×10¹⁵absent0.30superscript1015<0.30\times 10^{-15} <0.23×10¹⁴absent0.23superscript1014<0.23\times 10^{-14} 0.860.860.86
257 11.40±4.70plus-or-minus11.404.7011.40\pm 4.70 <28.00absent28.00<28.00 2.52.52.5 0.00.00.0 1.001.00-1.00 0.33×10150.33superscript10150.33\times 10^{-15} <0.35×10¹⁴absent0.35superscript1014<0.35\times 10^{-14} 0.560.560.56
258 <13.20absent13.20<13.20 <16.50absent16.50<16.50 0.00.00.0 0.00.00.0 - <0.39×10¹⁵absent0.39superscript1015<0.39\times 10^{-15} <0.26×10¹⁴absent0.26superscript1014<0.26\times 10^{-14} -
260 11.90±4.70plus-or-minus11.904.7011.90\pm 4.70 <9.10absent9.10<9.10 2.72.72.7 0.00.00.0 1.001.00-1.00 0.34×10150.34superscript10150.34\times 10^{-15} <0.11×10¹⁴absent0.11superscript1014<0.11\times 10^{-14} 0.200.200.20
261 <16.60absent16.60<16.60 <12.40absent12.40<12.40 0.00.00.0 0.00.00.0 - <0.47×10¹⁵absent0.47superscript1015<0.47\times 10^{-15} <0.15×10¹⁴absent0.15superscript1014<0.15\times 10^{-14} -
263 <17.60absent17.60<17.60 <18.70absent18.70<18.70 0.00.00.0 0.00.00.0 - <0.50×10¹⁵absent0.50superscript1015<0.50\times 10^{-15} <0.23×10¹⁴absent0.23superscript1014<0.23\times 10^{-14} 3.683.683.68
264 <16.60absent16.60<16.60 <19.00absent19.00<19.00 0.00.00.0 0.00.00.0 - <0.47×10¹⁵absent0.47superscript1015<0.47\times 10^{-15} <0.29×10¹⁴absent0.29superscript1014<0.29\times 10^{-14} -
265 <5.20absent5.20<5.20 <11.70absent11.70<11.70 0.00.00.0 0.00.00.0 - <0.52×10¹⁵absent0.52superscript1015<0.52\times 10^{-15} <0.51×10¹⁴absent0.51superscript1014<0.51\times 10^{-14} 0.100.100.10
Table 5: X–ray average luminosity of radio sources with no X–ray counterparts in four redshift bins
zdelimited-⟨⟩𝑧\langle z\rangle L0.52subscript𝐿0.52L_{0.5-2} erg s-1 L210subscript𝐿210L_{2-10} erg s-1
0.20 1.3×10401.3superscript10401.3\times 10^{40} 2.1×10402.1superscript10402.1\times 10^{40}
0.56 9.4×10409.4superscript10409.4\times 10^{40} 1.5×10411.5superscript10411.5\times 10^{41}
0.78 5.9×10405.9superscript10405.9\times 10^{40} 9.7×10409.7superscript10409.7\times 10^{40}
1.40 5.8×10415.8superscript10415.8\times 10^{41} 1.2×10421.2superscript10421.2\times 10^{42}