Determination of Black Hole Masses in Galactic Black Hole Binaries using Scaling of Spectral and Variability Characteristics
Abstract
We present a study of correlations between X-ray spectral and timing properties observed from a number of Galactic Black Hole (BH) binaries during hard-soft state spectral evolution. We analyze 17 transition episodes from 8 BH sources observed with Rossi X-ray Timing Explorer (RXTE). Our scaling technique for BH mass determination uses a correlation between spectral index and quasi-periodic oscillation (QPO) frequency. In addition, we use a correlation between index and the normalization of the disk “seed” component to cross-check the BH mass determination and estimate the distance to the source. While the index-QPO correlations for two given sources contain information on the ratio of the BH masses in those sources, the index-normalization correlations depend on the ratio of the BH masses and the distance square ratio. In fact, the index-normalization correlation also discloses the index-mass accretion rate saturation effect given that the normalization of disk “seed” photon supply is proportional to the disk mass accretion rate. We present arguments that this observationally established index saturation effect is a signature of the bulk motion (converging) flow onto black hole which was early predicted by the dynamical Comptonization theory. We use GRO J1655-40 as a primary reference source for which the BH mass, distance and inclination angle are evaluated by dynamical measurements with unprecedented precision among other Galactic BH sources. We apply our scaling technique to determine BH masses and distances for Cygnus X-1, GX 339-4, 4U 1543-47, XTE J1550-564, XTE J1650-500, H 1743-322 and XTE J1859-226. Good agreement of our results for sources with known values of BH masses and distance provides an independent verification for our scaling technique.
1 Introduction
Determination of masses of Galactic black holes (BHs) is one of the most important tasks in modern astronomy. In general, the knowledge of the BH mass distribution of the Galaxy can provide important clues on stellar evolution. It also can constrain the maximum mass of a neutron star and the minimum mass of a BH. For example, Rhoades & Ruffini (1974) predicted that the maximum mass of neutron star, formed as a result of a supernova explosion, is probably about 3.2 solar masses. Study of the characteristic changes in spectral and variability properties of X-ray binaries proved to be a valuable source of information on the physics governing the accretion processes and on the fundamental parameters of BHs.
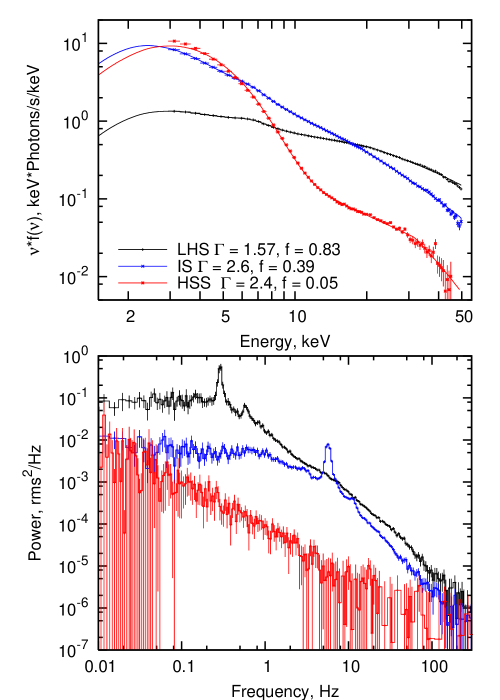
BH observational appearance is conventionally described in terms of BH state classification (see Remillard & McClintock, 2006; Belloni, 2005; Klein-Wolt & van der Klis, 2008, for different flavors of BH states definitions). We adopt the following general BH state classification for five major BH states:quiescent, low-hard (LHS), intermediate (IS), high-soft (HSS) and very high states (VHS). When a BH transient goes into outburst it leaves a quiescent state and enters LHS, a low luminosity state with the energy spectrum dominated by a Comptonization component combined (convolved) with a weak thermal component. The photon spectrum in LHS is presumably a result of Comptonization (upscattering) of soft photons, originated in a relatively weak accretion disk, off electrons of the hot ambient plasma [see e.g. Sunyaev & Titarchuk (1980))]. Variability in LHS is high (fractional root-mean-square variability is up to 40%) and presented by a flat-top broken power law (white-red noise) shape, accompanied by quasi-periodic oscillations (QPOs) in the range of 0.01-30 Hz, observed as narrow peaks in the power density spectrum (PDS). The HSS photon spectrum is characterized by a prominent thermal component which is probably a signature of a strong emission coming from a geometrically thin accretion disk. A weak power-law component is also present at the level of not more than 20% of the total source flux. In the HSS the flat-top variability ceases, QPOs disappear and PDS acquires a pure power-law shape. The total variability in HSS is usually about 5% fractional rms. The IS is a transitional stage between LHS and HSS.
Timing and spectral properties of an accreting BH are tightly correlated (see a comprehensive set of references in Table Determination of Black Hole Masses in Galactic Black Hole Binaries using Scaling of Spectral and Variability Characteristics). Correlations between the spectral hardness (photon index) and the characteristic frequencies of the quasi-periodic variability observed in the lightcurves of BH sources has been proposed for use as a tool to determine a BH mass (Titarchuk, & Fiorito, 2004, hereafter TF04). Shaposhnikov & Titarchuk (2007), hereafter ST07, employed this idea to measure the mass of a prominent BH source Cygnus X-1 and obtained a BH mass of , which has a better precision than conventional dynamical methods. Scaling arguments were also used to estimate masses in a number of ultra-luminous X-ray sources Fiorito & Titarchuk (2004); Dewangan, Titarchuk & Griffiths (2006); Strohmayer et al. (2007). In this Paper we further explore this technique by analyzing more representative data sets from Galactic BH sources. We concentrate our efforts on the study of correlations between spectral index and characteristic sub-second variability frequencies and the total accretion disk luminosity. These two correlation patterns carry the most direct information on the BH mass and source distance. We also investigate the possibility that the shape of the correlation pattern can provide a direct signature of the bulk motion (converging) flow onto a black hole, or, in other words, the signature of a black hole [see Titarchuk & Zannias (1998) and Laurent & Titarchuk (1999) for more details on this subject]. We present observational and theoretical arguments that the index-mass accretion rate saturation effect is a signature of a converging flow, when the mass accretion rate exceeds the Eddigton limit, which can only exist in BH sources.
In the presented study we enhance the scaling method by considering joint scaling of spectral index both in QPO frequency and disk component normalization (disk flux) domains. In the LHS and IS only a small part of the disk emission component is seen directly. The energy spectrum is dominated by a Comptonized component seen as a power law. To calculate the total normalization of the “seed” disk black body component we model the spectrum with a Generic Comptonization model which consistently convolves a disk black body with the Green’s (response) function of the Compton Corona to produce the Comptonized component (see details in §2). Calculated in this way the spectrum normalization is directly related to the BH mass, emission efficiency, source distance and geometry. This allows us to apply the total disk normalization as an additional scaling variable and to impose an additional constraint on the BH mass and distance ratios. Thus, we use the index-QPO and index-disk normalization correlations to constrain the BH masses and distances for Galactic BH sources H 1743-322, GX 339-4, XTE J1550-564, XTE J1650-500, 4U 1543-47, XTE J1859+226 and Cygnus X-1 based on their expected dependences on the mass of the central BH, the source distance and geometry. As our reference values for the scaling measurements, we use the previously measured BH mass, system distance and inclination for Galactic micro-quasar GRO J1655-40.
The description of RXTE data for each source is given in §2. We provide the details of state transitions analysis in §3 and we present the results of the scaling method applied to the data in §4. We present a physical picture of the accretion process which is consistent with the observed phenomenology of state transitions in §5. Specifically, it provides a theoretical basis and an explanation for the observed scaling index-QPO and index-normalization patterns. in Appenix A we provide the mathematical details of the transition layer (TL) model (Titarchuk, Lapidus & Muslimov, 1998, hereafter TLM98) which is the basis for the proposed scenario. We present theoretical arguments for the inverse proportionality of QPO frequency on BH mass in §5.1. We discuss the signature of bulk motion Comptonization (BMC) and its relation with the index evolution during state transition in §5.2. Specifically, we show that the index saturation effect is a direct consequence of the existence of the innermost bulk motion region and, therefore, can be considered as an observational signature of a BH. In §6 we summarize our results and compare BH masses and distances with those obtained by other methods. We also discuss briefly the alternative methods for BH mass determination from X-ray data. Conclusions follow in §7.
2 Observations and data reduction
For the study presented in this Paper we have analyzed data for seventeen spectral transitions in seven BH transient sources observed with RXTE. We also analyzed a subset of Cygnus X-1 data taken during 2001-2002 years when the source showed a transition from LHS to HSS. In Table Determination of Black Hole Masses in Galactic Black Hole Binaries using Scaling of Spectral and Variability Characteristics we summarize data for each transition and also provide references to previous analyses.
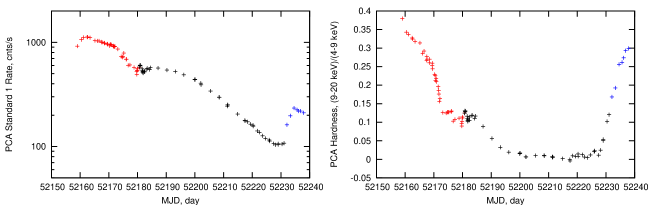
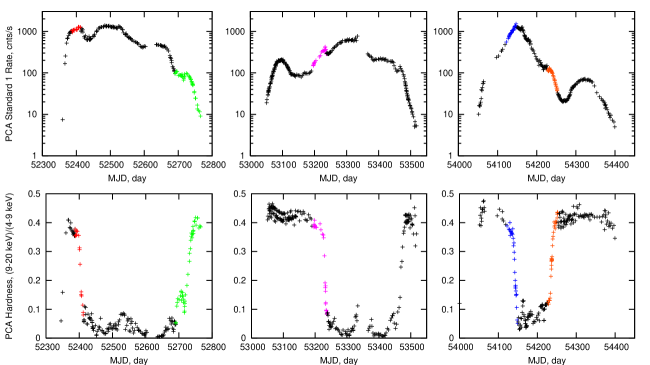
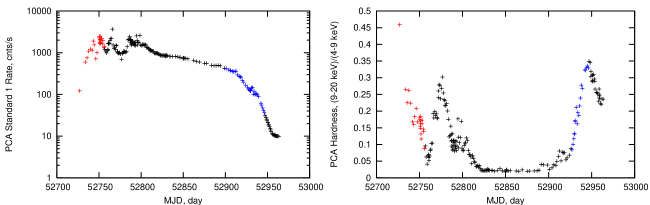
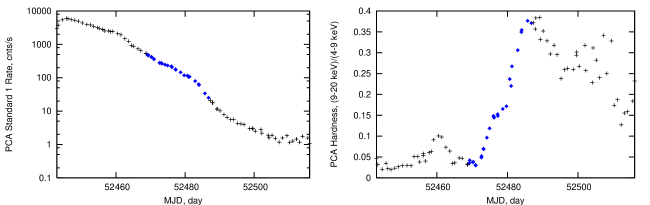
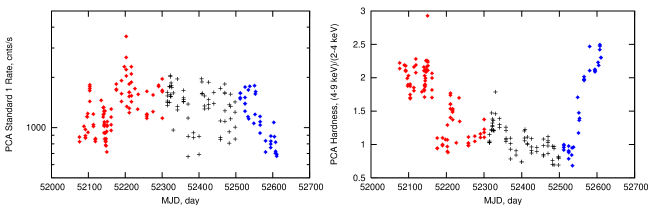
We use the archival RXTE data from the HEASARC111http://heasarc.gsfc.nasa.gov/. We present RXTE/PCA lightcurves and hardness ratios for all analyzed outbursts in the top panels of Figures 2-6. These diagrams are created using RXTE mission long data products provided by RXTE team. Each data point is based on a separate pointed PCA observation. Each transition data set is indicated by a separate color. Black color indicates observations during HSS or extreme LHS which are not used in our analysis.
RXTE/PCA spectra have been extracted and analyzed in the 3.0-50 keV energy range using the most recent release of PCA response calibration (ftool pcarmf v11.1). We calculated the root-mean-square normalized Fourier Power Density Spectra (PDS) from high time-resolution PCA mode data in the frequency range 0.01-1024 Hz. The relevant deadtime corrections to energy spectra and timing spectra have been applied following “The RXTE Cook Book” recipes and Revnivtsev, Gilfanov & Churazov (2000) correspondingly. The PCA energy spectra were modeled using XSPEC astrophysical fitting software. Spectral analysis was done using approach similar to that adopted in ST07 for Cygnus X-1 and GRO J1655-40 data. To fit PCA spectra we used the sum of the bmc component (Generic Comptonization model, see Titarchuk, Mastichiadis & Kylafis, 1997) and a Gaussian with the energy keV, which is presumably due to iron emission line. This model was also modified by the interstellar absorption, using the wabs model in XSPEC, with a hydrogen column value fixed at the Galactic value given by nH HEASARC tool (Dickey & Lockman, 1990) for a particular source and a high energy cut-off (highecut). The width of the Gaussian was constrained in the range 0.8-1.2 keV. The high energy cutoff component accounts for exponential overturn of the spectrum due to electron recoil effect. Systematic error of 1.0% have been applied to the analyzed spectra.
The bmc model describes the outgoing spectrum as a convolution of input “seed” black body spectrum having normalization and color temperature with a Green function for Comptonization process. Similarly to the ordinary bbody XSPEC model, the normalization is a ratio of source luminosity to square of the distance
| (1) |
The resulting model spectrum is also characterized by a parameter related to a Comptonized fraction where and the Green’s function spectral index , where is photon index.
There are two reasons for using the model. First, by the nature of the model is applicable to the general case when photons gain energy not only due to thermal Comptonization but also via dynamic or bulk motion Comptonization (see Titarchuk, Mastichiadis & Kylafis, 1997; Laurent & Titarchuk, 1999; Shaposhnikov & Titarchuk, 2006, for details). The second reason is that calculates consistently the normalization of the “seed” photons , presumably originated in the disk. The relation of and its proportionality to the mass accretion rate in the disk is a direct consequence of the accretion disk theory (see e.g. Shakura & Sunyaev, 1973). The adopted spectral model decribes well the most data sets used in our analysis. The value of reduced -statistic , where is the number of degrees of freedom for a fit, is less or around 1.0 for most of the observations. For a small fraction (less than 3%) of spectra with high counting statistic the value of reaches 1.5. However, it never exceeds a rejection limit of 2.0.
The PDS continuum shape in LHS and IS has usually a band-limited noise shape, which is well presented by an empirical model . The parameter is related to the break frequency and is the slope of the PDS continuum after the break. We use Lorentzian shape to fit QPO features. We quote the Lorentzian centroid as a QPO frequency.
Our approach to the analysis of a BH state transition is following. We identify a complete spectral transition as a period when the source state changes from LHS to HSS (or vice versa) showing gradual transition through IS. In this Paper we analyze the transitions for which the frequency of RXTE/PCA pointing observations allows to infer the index-OPQ correlation patterns and to perform a comparative study. In Table Determination of Black Hole Masses in Galactic Black Hole Binaries using Scaling of Spectral and Variability Characteristics we provide the list of the transitions (outbursts) which we utilized in our study. In this Table we also introduce an ID name of each transition which consists of abbreviated source name, dash, a transition direction identifier (“R” for the rise and “D” for the decay), and the two last digits of the year during which the event occured. In Table Determination of Black Hole Masses in Galactic Black Hole Binaries using Scaling of Spectral and Variability Characteristics we present the details of the model fits to the spectral and timing data for each RXTE observation in the spectral transition.
3 Correlations between spectral and timing properties during state transitions
3.1 Phenomenology of the correlation behavior
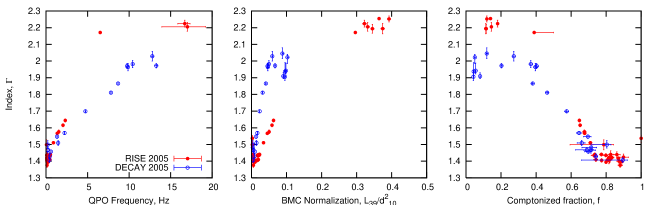
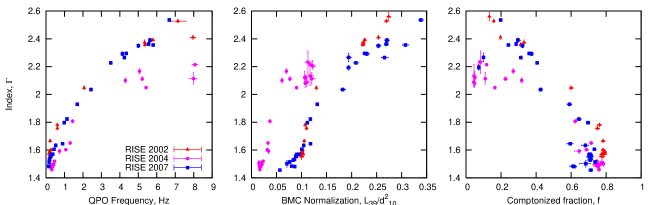
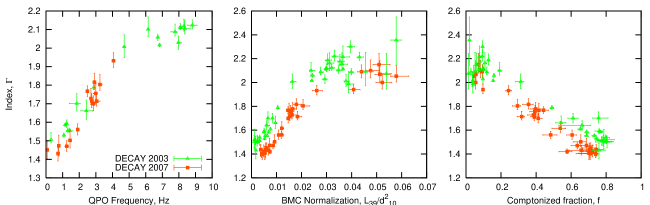
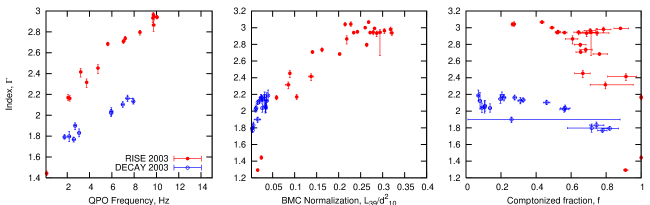
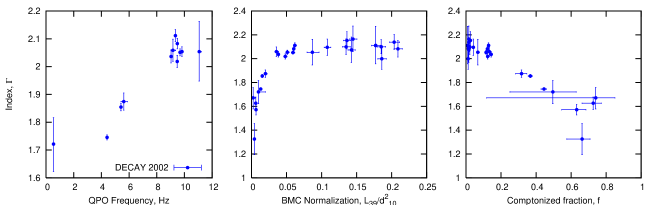
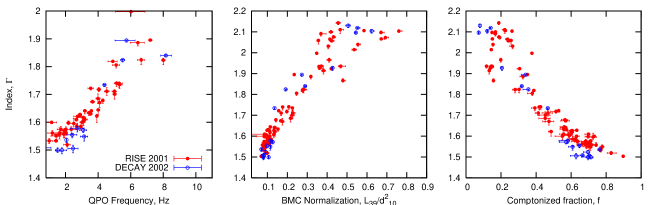
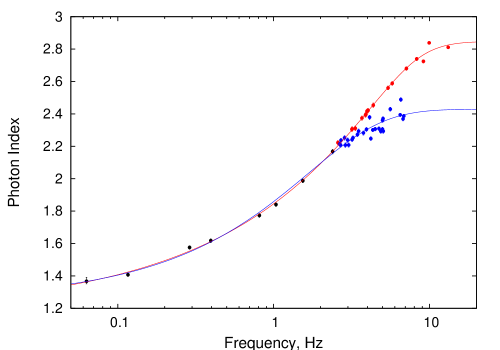
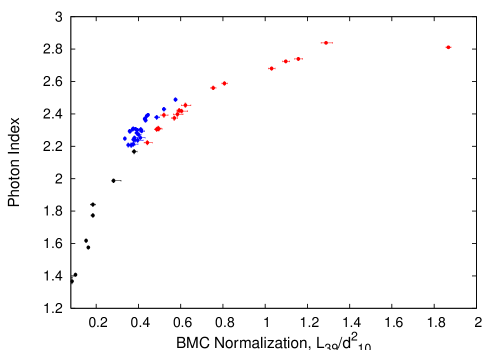
In Figures 2-6 (top panels) we show the spectral evolution of a given source throughout each analyzed outburst by presenting the PCA lightcurve and PCA hardness ratio. In the bottom panels from left to right we plot the correlations of photon index versus QPO frequency, bmc model normalization and Comptonized fraction . Data for a particular transition are distinguished using the same color legend for the correlation plots and the lightcurve diagrams.
The general behavior of the correlations is following. The QPO frequency and normalization are positively correlated with index. Comptonization fraction and index are usually anti-correlated (see right bottom panels in Figs. 2-6). In the upper part of the correlation patterns we observe a saturation of index which is more apparent in the index-normalization domain than in the index-QPO pattern. The reason for this is that the index and normalization values, as the best-fit parameters of the energy spectrum, are always available independently of the source state, while QPOs tend to faint as a source enters HSS.
In ST07 we claimed the presence of index saturation in Cygnus X-1, GRO J1655-40 and GRS 1915+105 using correlations with QPO frequency. Here we confirm the index saturation effect for GRO J1655-40 and Cygnus X-1 (see Fig. 2 and 6). Moreover, we establish the index saturation effect in GX 339-4, H 1743-322, 4U 1543-47 and XTE J1650-500 (see Figs. 3-5 and 8 respectively). It is important to mention that the saturation of index with respect to the photon spectrum normalization (mass accretion rate) in XTE J1650-500 was also recently established by Montanari et al. (2008) in their analysis of BeppoSAX data from 2001 outburst.
Three rise transitions, J1550-R98, H1743-R03 and J1859-R99, exhibit similar behavior. For all these transitions, when the index reaches its high values (2.5), the Comptonization fraction shows non-monotonic behavior. Namely, for J1550-R98 and H1743-R03, as the source leaves LHS starts to decrease as expected. However, when the source enters the IS the index- track reverses and returns back to its maximum value of 1.0. In Figure 4 we illustrate this evolution of the Comptonization fraction as a function of photon index for the rise transition H1743-R03 (see red data points on the right bottom panel).
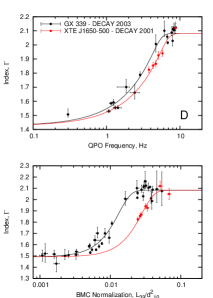
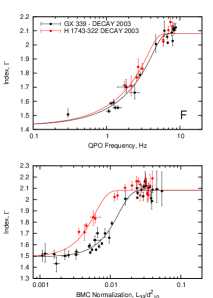
During the decay transitions the source luminosity is lower than that for the rise episodes and the corresponding variability is suppressed, which is probably due to lower excitation power in the accretion flow (see Titarchuk & Shaposhnikov, 2008, for details). As a result the spectral and timing data related to the decay transitions have lower signal-to-noise ratio than those for the rise transitions. The index saturation levels for the decay stages have values close to 2.1. Most probably, this is due to the fact that at low accretion rates during an outburst decay the cooling of X-ray emission area [Comptonization cloud (CC)] by the disk photons is less efficient than that at high . As a result, the CC plasma temperature is higher, leading to more efficient Comptonization and harder spectrum. This direct connection between the temperature of the CC and the hardness of the emergent spectrum was shown by Monte-Carlo simulations in Laurent & Titarchuk (1999). In other words, the decay transitions appear to be different from the rise transitions: correlation patterns are not scalable in the normalization domain and they are usually not self-similar given that the index saturations take place at different levels. Our experience shows that while decay-to-decay and rise-to-rise scaling produces consistent results, decay-to-rise pattern scaling is not a reliable mass-distance indicator.
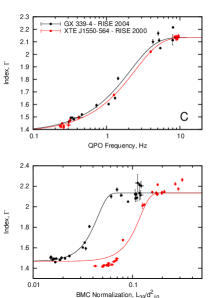
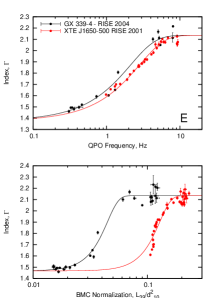
To illustrate the above points, let us consider properties of state transitions in GX 339-4. In this source five different (rise and decay) transitions exhibited five different tracks (see Figure 3, third and fourth row panels from the top). Two rise transitions, GX339-R02 and GX339-R07, occurred at higher fluxes than that for two decay transitions, GX339-D03 and GX339-D07. These rise transitions also showed steeper index-QPO (index-normalization) correlations with higher saturation levels. The difference between these transitions is clearly seen. On the other hand, the GX339-R04 hard-to-soft transition resembles a decay track with the index saturated at the value of 2.15 and a lower luminosity. But even for this rise episode the index-normalization track is much steeper than those for the decay episodes. The decay transition during 2004 outburst was quick and did not show sufficient QPO activity. We, therefore, discarded this transition episode from our analysis.
It is also worthwhile to discuss the behavior of XTE J1550-564 during the 1998 rise outburst in detail. The outburst started on MJD 51063 and went through the initial LHS phase, which ended on MJD 51069. During this period spectral index increased from 1.35 to 2.2 and QPO frequency changed from 0.3 to 3.3 Hz. In Fig. 7 this stage is marked by filled black circles. For the following 10 days the source exhibited IS with a strong flare on MJD 51076, when the index and QPO frequency peaked at 2.8 and 14 Hz correspondingly (IS-VHS track). We mark these data points by filled red circles. After the flare the source returned to the IS with index and QPO at Hz. For the next 20 days we observed smooth evolution toward the HSS with index slightly increasing to 2.5 and QPO frequency rising to 5 Hz. On about MJD 51105 the source entered the HSS (IS-HSS track). The index-QPO correlation consists of two different tracks which are shown on Fig. 7. The correlation curve related to the IS-HSS stage is lays lower than that related to the IS-VHS transition. Clearly, the conditions in the accretion flow changed between these episodes. During the IS-VHS stage the source presumably went through the strongest surge of accretion. This cold accretion flow provided strong cooling, which is manifested by higher spectral index. These changes in the physical conditions in the accretion flow led to a double-track pattern of the correlation. Therefore, for the scaling purposes we treat a combination of the initial LHS with IS-VHS and IS-HSS data as two separate correlation patterns. We further refer to them as J1550-98Ra and J1550-98b respectively.
We revisited the data for GRO J1655-40 and Cygnus X-1, which were used for BH mass measurement in Cygnus X-1 (ST07). We present the data for these sources in Figs. 2 and 6. In fact, Cygnus X-1 is a persistent source, with somewhat different phenomenology from the other sources analyzed in this study. The Cyg X-1 data obtained during 2001 and 2002 were chosen for the analysis (see Fig. 6). In the 2001-2002 period the source exhibited two transition, from LHS to HSS (red data points) and a reverse transition marked by blue color. Black points indicate the observation when the source was in the HSS. As seen from the lower panels, the rise and the decay data from Cygnus X-1 are very similar in terms of the index-QPO and index-normalization correlations. In particular, the same index-normalization tracks indicate that there is no hysteresis effect in this source. This may be related to the persistent nature of the accretion or the O-star wind. We, thus, use both the rise and the decay data for Cyg X-1 data as one data set to construct the correlation pattern. This approach is consistent with that adopted in the ST07 analysis.
3.2 The scaling technique and parametrization of the correlation patterns
One of the goals of the presented study is to apply X-ray observational data from BH sources to infer their fundamental characteristics. To do this we use the BH state paradigm combined with the scaling laws expected to be observed in spectral and timing data during state transitions.
First, using available X-ray observations we verify a theoretical conjecture that the QPO low frequency is inversely proportional to a BH mass (see TLM98 and TF04). This QPO frequency dependence on is a simple consequence of the fact that all characteristic dynamical timescales in an accreting flow onto a compact object are set by the mass of the object (see e.g. Shakura & Sunyaev, 1973, and §5.1). Thus, QPO frequencies, being in the inverse proportion to these timescales, have to be inversely proportional to . This intuitive law of nature now finds its observational confirmation. In §5.1 we present theoretical arguments for the inverse dependence of QPO frequencies on in terms of transition layer model (see details in TLM98, TF04 and Appendix A).
Thus, we write the first scaling law (that we implement in our scaling technique for the BH mass determination) in terms of a scaling factor
| (2) |
where subscripts and of frequency denote reference and target sources respectively.
The second scaling law, which we use as a basis for our mass and distance determination analysis, relates a source flux detected by an observer on the Earth, a disk flux and distance , namely:
| (3) |
The disk flux can be represented as
| (4) |
Here is an effective radius where the main energy release takes place in the disk, is the Schwarzschild radius, , is dimensionless mass accretion rate in units of the critical mass accretion rate and is the Eddington luminosity.
Note that both and are assumed to be the same for two different sources in the same spectral state, which leads to . In our spectral analysis we determine the normalization of “seed” radiation, which is supplied by an accretion flow (disk) prior to Comptonization. The ratio of these normalizations for target and reference sources in the same spectral state can be written as
| (7) |
Here is a geometrical factor which takes into account the difference in viewing angles of the seed photon emission area (the inner disk) by the Earth observer for two given analyzed sources. Therefore, in the case of radiation coming directly from the disk it would have the value , where is the inclination angle of the inner disk. Note that this form of , however, may not be very accurate because the geometry of both the inner disk and the corona can be different from the plane (disk) geometry. In fact, in BH states of interest (LHS ans IS) they can be described, for instance, by quasi-spherical configuration. Despite of this uncertainty in the determination of , we adopt the above form in which if the information on the system inclination angle is available. In doing this we introduce an additional assumption that the inner accretion disk and the system inclination angles are the same. This assumption, however, proved to be in good agreement with our analysis.
Now we write the final equations of our scaling analysis. Namely, when and are measured, the mass and the distance of the target source can be calculated as
| (8) |
and
| (9) |
The part of the scaling method presented by equation (9) is new. In the previous analysis (see ST07) we only use the scaling factor of the index-QPO correlation and apply it for determination of the BH mass distribution. The new modified technique uses timing information and the normalization of photon spectrum to constrain both BH mass and the distance for a target source, provided that these quantities are known for a reference source.
With equations (8) and (9) in hand, the task of BH mass and distance measurements for a target source is reduced to the determination of scaling coefficients and with respect to the data for a reference source. The appropriate technique has already been implementaed in ST07. Specifically, after scalable state transition episodes are identified for two sources, the correlation pattern for a reference transition is parameterized in terms of the analytical function
| (10) |
where argument is either QPO frequency or normalization . By fitting this functional form to the correlation pattern, we find a set of parameters , , , and which represent a best fit form of the function for a particular correlation curve.
For the correlation function converges to constant value . Thus, is a value of the index saturation level, is the power-law index of the part of the curve for lower argument values and is the frequency/normalization at which index levels off. Parameter controls how fast the transition occurs. We scale it to a target pattern by a transform when the best fit is found for a reference pattern.
The use of analytical function to parametrize the correlations allows us to avoid theoretical modeling of the index-QPO relation based on any particular physical model, which would require some internal parametrization in any case (see discussion in ST07). It makes the scaling procedure model independent, and it is justified because it satisfactory represents both the index-QPO and the index-normalization patterns.
4 BH mass and distance measurement in XRBs
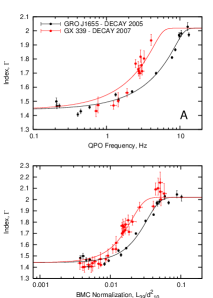
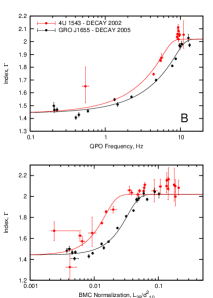
The Galactic microquasar GRO J1655-40 is well studied BH X-ray binary with the best measured mass and distance among known stellar mass BH sources. We therefore use this system as a primary reference source for our scaling. In addition, the ancillary information on the system inclination is available which makes distance determination more reliable. However, not all sources we analyse here have transitions directly scalable to GRO J1655-40 data. Therefore, we have to utilize intermediate reference source to provide measurements for all sources. Specifically, only GX 339-4 and 4U 1543-47 have transitions which are scalable to the our primary reference source. After measuring BH mass and distance for GX 339-4 we use this source as a reference for XTE J1550-564 and XTE J1650-500. Note, this scaling between GX 339-4 and XTE J1650-500 was allowed both with rise and decay data. We then use XTE J1550-564 as a reference source for scaling to H 1743-322 and XTE J1859-226 data. Finally, we measure BH mass and distance for Cygnus X-1 by scaling to GRO J1655-40 and 4U 1543-47. All measurements are summarized in Table 3 and illustrated in Figures 8 and 9. Below we provide some details on how we combine our scalings in chains to provide measurements for all sources of interest.
We first determine parameters for sources which have correlation patterns self-similar to GRO J1655 data. Namely, data sets GX399-D07 and U1543-D02 are scalable to that of J1655-D05. These scalings provide BH mass measurements for GX 339-4 and 4U 1543-47 (Fig. 8 panel A and B). Other decay transitions (i.e. GX339-D03, J1650-D01 and J1743-D03) have slightly higher saturation levels of 2.1 and present a different cluster of scalable patterns (datasets). Thus we use GX339-4 as a reference source to provide the mass-distance determinations for XTE J1650-500 (Fig. 8 panel D) and H 1743-322 (Fig. 8 panel F). We use GX339-R04 data to scale to XTE J1550-564 (J1550-R00) data and to measure BH mass and distance in XTE J1550-564 (Fig. 8 panel C). The resulting value of BH mass is in an excellent agreement with the dynamical determination of BH mass in XTE J1550-564. We also scale the rise transition datasets GX339-R04 and J1650-R01 (Fig. 8 panel E) to provide a double check with the decay data scaling (see Fig. 8 panel D) for the same sources. The results obtained with these parallel scalings are in a striking agreement.
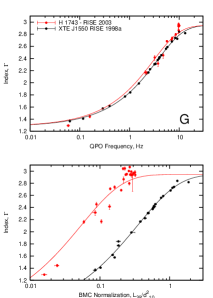
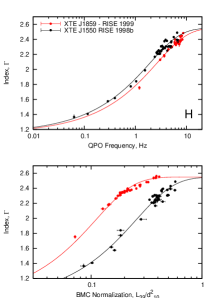
Finally, we use XTE J1550-564 (J1550-R98) data for scaling with H 1743-322 (1743-R03) and XTE J1859-226 (J1859-R99) (Fig. 9 panels G and H correspondingly). As we mentioned in the previous section, during the 1998 outburst rise from XTE J1550-564 the index exhibited two correlation tracks with different saturation levels. The initial LHS combined with subsequent IS-VHS phase is similar to H 1743-322 transition observed during the 2003 rise episode (1743-R03). We therefore use this subset of XTE J1550 (J1550-R98a) to scale to the 1743-R03 data. The IS-HSS phase of J1550-R98 data is scalable with J1859-R99 transition (Fig. 9 panel H). We also note that these outbursts (J1550-R98, J1859-R99 and H1743-R03) are similar not only in terms of the index-QPO and index-normalization behavior but also in terms of the index- patterns and the overall appearance of outburst lightcurves (we illustrate these observational appearances in Fig. 4 which presents data for H 1743-322).
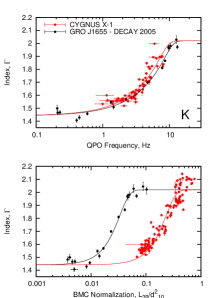
Finally, in Fig. 9 panel K, we show the scaling between J1655-D05 and CYGX1 datasets (see Table Determination of Black Hole Masses in Galactic Black Hole Binaries using Scaling of Spectral and Variability Characteristics for these dataset descriptions). In Table 3 we present the scaling coefficients and obtained using our scalings procedure. We also provide BH masses and distances obtained using the calculated scaling coefficients and Eqs. (8-9). The parameterizations of reference patterns in terms of the empirical functional form (Eq. 10) are presented in Table 4.
Thus, we construct the sequence of scalings which allows us to obtain the BH mass and the source distance for a number of BH XRBs (and in some cases to provide a double check for these measurements). Table Determination of Black Hole Masses in Galactic Black Hole Binaries using Scaling of Spectral and Variability Characteristics presents the final results of BH mass and distance determinations using our scaling method along with independently reported masses, distances and inclination angle values found in literature. For the sources for which we were able to make parallel scaling measurements with two different dataset pairs, the final best-fit values are the averages between individual measurements and the error ranges are calculated using the sum of error intervals given by individual scalings.
5 Physical scenario for the evolution of spectral and timing properties during BH state transitions
The accretion process onto a BH is far from being completely understood. Theoretical models which are available for astronomers to explain observational phenomena usually deal with only narrow aspects of a broad observational picture. For example, while there are several proposed QPO models in the literature (see Remillard & McClintock, 2006, for references), most of them concern only QPO phenomenology and lack the connection with spectral properties and state transition aspects. However, in the recent years a concept of “transitional layer” (TL) in the accretion flow has emerged. In the framework of this model several major observational aspects of accreting BHs find natural explanation. We argue that this concept is a strong candidate to provide a basis for a theory of accretion process onto compact objects which would accont for the current observational picture of BH sources. Moreover, this paradigm may provide us with a first direct BH signature observationally confirmed from multiple sources.
The starting point in the development of the TL paradigm is the notion of the necessary deviation of the rotational profile in the innermost part of the disk set by the conditions at (or near) a compact object for which rotation is presumed to be much slower than the Keplerian frequency near the object. This problem was, the first time, considered by TLM98 where the authors showed that the adjustment of the Keplerian rotation in the accretion disk to the sub-Keplerian rotation of the central object leads to the formation of the inner hot Compton corona (CC).
5.1 The inverse dependence of the QPO frequency on the BH mass
TLM98 define the transition layer as a region confined between the the inner sub-Keplerian disk boundary (where the inner TL radius , is the Schwarzchild radius and is a numerical factor ) and the first Keplerian orbit (see Figs. 1 in TLM98 and TF04). Numerical calculations (see also Eq. A4 and Fig. 2 in TLM98) showed that the value of dimensionless outer radius strongly depends on parameter (Reynolds-number) when the rotational velocity of central of object is less then the Keplerian frequency at the TL outer boundary.
The fact that is a function of parameter implies that the CC dimensionless size is a function of too. Specifically, given that parameter defines the spectral state (see TLM98 and TL04) the CC dimensionless size is the same for any given spectral state of BH even if BH masses differ by orders of magnitude. Thus the CC dimensional size km is proportional to BH mass for a given spectral state (or ). Moreover TLM98 demonstrated that the dimensionless CC size anti-correlates with the X-ray spectral hardness (spectral index). TF04 identified the QPO frequency as a normal mode oscillation frequency of the CC near the BH. Thus one should expect that the QPO frequency is inversely proportional to the BH mass given that the QPO frequency is proportional to a ratio of the characteristic velocity with which the perturbation propagates in the CC, note it is a function of spectral index only, and the CC size . The CC plasma (sonic or magneto-acoustic) velocity decreases with , related to an increase of , because in the case of the high mass accretion rate the disk provides strong soft photon illumination of the CC area. In other words, is a strong function of the spectral state (or ). Given that the QPO frequency should be expressed as a ratio of and the CC size , namely
| (11) |
one can conclude that (i) there should be a correlation of with spectral state (or ) and (ii) for a given spectral state should be inversely proportional to BH mass . Thus, if this index-QPO correlation occurring during a spectral transition has a form which is similar to that for another BH source then there is a possibility to determine a ratio of BH masses for these two BH sources by sliding their correlations along axis with respect to each other (see §4 for details of an implementation of this scaling technique).
Recent detailed analysis of the spectral and timing properties of X-ray emission in Cyg X-1 by Titarchuk & Shaposhnikov (2008) confirms that QPO frequency indeed correlates with the Reynolds number and photon index . The Comptonization parameter (or the photon index ) which characterizes the efficiency of the Comptonization (see more details in Appendix B) is determined by the product of the average fractional energy change per scattering and mean number of scattering in the CC. TF04 used the results of the Monte Carlo simulations of Comptonization processes in the CC and the bulk motion flow to demonstrate that increases and then saturates when increases. Thus given that and correlate with the QPO frequency should correlate with the photon index as well.
5.2 The index saturation vs disk flux as an observational evidence of the converging flow (bulk motion onto BH)
As we have already pointed out, positive correlations between photon index and QPO frequency should be observed during the state transition, when the corona is cooled down by the disk photons (TLM98, TF04). As the temperature of the CC drops during the transition towards softer states, the bulk motion Comptonization (BMC) effect becomes dominant in the formation of the hard tail of X-ray spectra in BHs in the final spectral stage, i.e in HSS (see Titarchuk & Zannias, 1998, hereafter TZ98, and LT99).
As seen from Fig. 26 the index saturation is detected in index- normalization correlations for most analyzed sources (sometimes the index saturation is seen in the index-QPO correlations too). Namely, the index saturation effect is found in GRO J1655, GX 339, XTE J1550, XTE J1650, H 1743, 4U 1543, Cyg X-1 (see Figs 2-7 and 8 respectively). The saturation level of index can vary from source to source. Even for the same source the index saturation can be variable for different transition episodes. For example GRO J1655-40 exhibits the different index saturation levels , and during 2005 outburst rise and decay stages respectively (ST07).
This effect of index saturation vs optical depth of the bulk flow (BM) was first predicted by TZ98 and subsequently reproduced in Monte-Carlo simulations by LT99. It is worth noting that the index saturation effect is an intrinsic property of the bulk motion onto BH given that spectral index is a reciprocal of the Comptonization parameter (see Eq. B7) which saturates when the BM optical depth , or dimensionless mass accretion rate , increases. In fact, Y-parameter is a product of the average fractional photon energy change per scattering and the mean number of photon scatterings , i.e. .
The thermal Comptonization parameter given that in this case and for (see e.g. Rybicki & Lightman, 1979) and, thus, the thermal Comptonization spectral index
| (12) |
In the case of converging flow the preferable direction for upscatterred photons is the direction of bulk motion onto the BH, i.e along its radius. Note the fractional photon energy change is
where and are cosines of angles between the direction of electron velocity and direction of incoming and outcoming (scattered) photons respectively.
The number of scattering of up-Comptonized photons can be estimated as a ratio of the radial characteristic size of the converging flow and the free path in the direction of motion, namely given that has a maximum at for given and . On the other hand the efficiency per scattering for bulk motion flow when (Laurent & Titarchuk, 2007).
Thus one can conclude that the Comptonization parameter and energy index (see Eq. B7) saturate to a constant values when optical depth (or mass accretion rate) of the BM flow increases.
The index saturation value is determined by the plasma temperature during a transition [see LT99]. On the other hand, (see e.g. TLM98) the plasma temperature strongly depends on the mass accretion rate in the bulk motion region and its illumination by the disk photons . For higher and the plasma temperature is lower. The level of the index saturation decreases when the plasma temperature in the bulk motion increases (TF04). Thus the index saturation levels can be different from source to source depending on the strength of the disk in a particular case.
6 Discussion
Currently a BH identification in X-ray observational astronomy is based solely on a mass of compact object. Namely, a compact X-ray source is classified as a BH if it is well established that its mass exceeds the upper mass limit of a stable rotating neutron star, namely 3.2 M⊙ (see e.g. Rhoades & Ruffini, 1974). To the date there is only one widely accepted method for the mass determination related to the measurement of the mass function based on optical spectroscopy. While the theoretical mass function is a function of the two masses and the inclination angle, the value of the observationally inferred mass function (which is the minimum possible mass of the compact object) depends only on the velocity half-amplitude K and the orbital period and independent of the inclination angle : .
Orosz (2003), has summarized the measurements of the rotational velocities and inclinations for 17 black hole binaries. He comments that the difficult part of this procedure has been related to the inverse problem of parameter optimization since the parameter space to search is usually vast and often parameters can be tightly correlated. In many cases, the observed light curve is not entirely due to the companion star owing to the presence of extra sources of light (usually from an accretion disk). Another difficult aspect is the uncertainty in radial velocity amplitude, which appears as third power in solution. Therefore, while the dynamical mass measurements in a number of BH sources were successful, one should always be cautious about potential systematic errors.
The dynamical measurement of the mass of a compact object of more than the theoretical limit for a stable NS configuration is currently considered a sufficient evidence that the object is a BH. We note, however, that by itself such a mass measurement is not a direct proof of the nature of an object as a BH. Such a proof, for example, would come from the confirmation of the presence of a BH horizon. Direct observations of a BH horizon, by theory are not possible. Therefore, one has to look for signatures which would require the BH horizon and therefore would serve as a proof of its presence. In this work we present theoretical arguments and observational evidence in support that the index saturation effect observed during BH spectral transitions is due to the dynamical Comptonization in the converging bulk motion in the innermost part of a compact object. Formation of this bulk motion region is not possible in the presence of any solid surface, which would otherwise be manifested by observations of a “feed-back” in the form of a strong spectral component due to the energy release on the surface and/or coherent pulsations as in case of neutron stars. In fact, none of this “feed-back” features were ever observed from these sources. Therefore, we argue, that the photon index saturation with the mass accretion rate is the signature of the bulk motion (converging) flow onto BH. In this Paper we present the observational evidence of the index saturation detected in several X-ray outbursts from BH sources.
We measure the BH mass and distance using scaling relationships in the correlations between spectral and timing properties observed during the state transitions in Galactic accreting BHs. We complement previously proposed technique for BH mass determination using index-QPO shift (ST07) with scaling the indexX-ray spectrum normalization which contains information on a source distance. Using our modified scaling approach we calculated BH mass and distances for seven sources. Results of these measurements are given in Table Determination of Black Hole Masses in Galactic Black Hole Binaries using Scaling of Spectral and Variability Characteristics. We also present constraints on BH masses and distances which are available using other methods.
First, we compare the BH masses found using dynamical methods with masses derived by the scaling technique. BH masses provided by scaling are in good agreement with those given by the dynamical method for 4U 1543-47 and XTE J1550-564. For XTE J1859-226 and Cygnus X-1, BH mass constraints based on optical measurements are consistent with BH mass values obtained using the scaling technique. The BH mass of obtained for GX 339-agreement with the lower limit of provided by Muñoz-Darias et al. (2008). For H 1743-322 mass measurement by the dynamical method is not available. Based on the values of high frequency QPOs McClintock et al. (2007) concluded that the H 1743-322 has a high inclination () and the BH mass about 11 solar masses. Our BH mass values of agrees with this estimate.
For XTE J1650-500 we obtain a new value for BH mass of , which is considerably higher than the the upper limit of 7.3 inferred by Orosz et al. (2004). In this paper we also retract our previous claim of the measurement of BH mass of in XTE J1650-500 (Shaposhnikov & Titarchuk, 2008). This preliminary claim for XTE J1650-500 was based on self-similarity of XTE J1650-500 and XTE J1550-564 index-QPO data only. In our study of index correlations with spectrum normalization and other parameters it has become clear that the data sets used to obtain low mass value for XTE J1650-500 (J1650-R01 and J1550-98a) are not scalable. The new value of BH mass for XTE J1650-500 is obtained by scaling with GX339-4 using more careful consideration of scalability criteria. It is also worth noting that Orosz et al. (2004) remarked that their analysis were affected by poor statistic and limited number of templates. Moreover, their conclusion on the BH mass upper limit was based on the number of assumptions about the spectral class of the optical companion, accretion disk contribution and inclination angle.
We hope that future observations will clarify the discrepancy in XTE J1650-500 mass determinations by different methods. We, however, note an interesting fact that most our inferred BH masses, as well as majority of BH masses measured by dynamical methods fall in a narrow range around 10 . This may be due to some observational selection effect or some currently unknown factors in stellar evolution. In our opinion, this matter deserves a separate investigation.
In most cases our distance estimates are also in agreement with distances given by independent methods. Especially encouraging is a good agreement for 4U 1543-47 and Cygnus X-1. For this sources the inclinations are much smaller than that for the reference source GRO J1655-40. This means that an approximation of geometrical factor as a ratio of cosines of inclination angles works well. For H 1743-47 McClintock et al. (2007) inferred the inclination angle of and the distance of 10 kpc. Using this inferred value of we obtained that , and the distance of kpc for H 1743-322.
An X-ray spectroscopic method of the BH mass determination was implemented by Borozdin et al. (1999) and further developed in Shrader & Titarchuk (1999). The method is applicable to the HSS data when the thermal blackbody-like (BB) component, which is presumably related to the accretion disk emission, dominates in the emergent X-ray spectrum. The main idea of this X-ray spectroscopic method is to use the color temperature and normalization of the BB component to infer the BH mass. One needs to employ a correct color factor which is a ratio of the color and effective BB temperatures of the disk. For the color factor calibration Borozdin et al. (1999) chose GRO J1655-40 for which , and are well determined. Analyzing the RXTE spectra of this source and using the Shakura-Sunyaev (SS) disk model (Shakura & Sunyaev, 1973) they obtained . This is drastically different from the commonly used value of 1.7, obtained by Shimura & Takahara (1995) also in the framework SS model but with certain assumptions regarding the disk viscosity parameter. Thus Borozdin et al. (1999) and later Shrader & Titarchuk (1999) used GRO J1655-40 calibrated value of the color ratio of for the BH mass determination. The latest results of the BH mass determination for a number of the BHC sources using the X-ray spectroscopy method are summarized in Shrader & Titarchuk (2003), hereafter ST03. We also present these values in Table Determination of Black Hole Masses in Galactic Black Hole Binaries using Scaling of Spectral and Variability Characteristics for comparison. From this comparison one may see that the main uncertainties of the ST03 BH mass estimates, which relied on the spectroscopic method, are mostly driven by uncertainties of the inclination , the distance and by the value of the color factor .
7 Conclusions
We perform a comprehensive study of a highly representative set of well observed spectral transitions in Galactic BH sources. The goal of the study is to further explore the possibility of measuring the BH fundamental properties from X-ray data and search for BH signatures. We use correlations between spectral and timing properties during the state transitions as a main tool to investigate the BH spectral transition phenomenology.
We compiled the state transition data from eight galactic BH sources collected with the RXTE mission. We examine the correlation between photon index of the Comptonized spectral component, its normalization and the QPO frequency. Analyzing the behavior of the correlation patterns we utilize four basic scaling laws: the inverse proportionality of frequencies of oscillatory processes to the mass of central BH and the disk flux proportionality to the BH mass, mass accretion rate and its inverse proportionality to a square of distance. We establish that scalable correlation patterns indeed contain information on BH mass and system distance.
We then combine the scaling of the correlation patterns in the frequency and normalization domains for a set of Galactic X-ray BH binaries from which we determine BH masses and distances. Our results confirm that the correlation scaling method is a powerful technique for a BH mass determination. The application of the scaling technique for the high precision measurements of BH masses requires very well sampled observations of the source evolution through the outbursts and careful consideration of scalability of correlation patterns.
We have tested the scaling method using the known (from optical, IR observations and X-ray spectroscopic measurement) BH masses in 4U 1543-47, XTE J1859+226, XTE J1550-564 and Cygnus X-1. Using the inverse proportionality of QPO frequency to a BH mass for a given spectral state we arrive to a set of BH mass determinations, which are in good agreement with available dynamical data for several systems.
We also show observationally that the transition layer theory (TLM98, TF04) correctly predicts the QPO frequency dependence on the BH mass and overall shape of the correlations between spectral and timing properties observed during spectral transitions. The success of the scaling method for the BH mass determination strongly supports the Compton Cloud (CC) origin of the observable index-QPO correlation.
We present the observational evidence supporting the theory of the bulk motion (converging) flow, i.e. the index saturation with the mass accretion rate. Specifically, analyzing RXTE observations for a set of BH outbursts we find that the index saturation is seen in the index-QPO and index-normalization correlations. We argue that the index saturation with mass accretion rate as a signature of the bulk (converging) flow should only exist in the BH sources. Only in these sources there is no radiation pressure feedback effect at high mass accretion rate, as that takes place in NS binaries. In other words, this index saturation effect provides a robust observational evidence for the presence of black holes in these BHCs.
The authors acknowledge the referee for many constructive suggestions to improve the paper quality and its presentation.
Appendix A The transition layer paradigm
The radial motion in the disk is controlled by friction and the angular momentum exchange between adjacent layers, resulting in the loss of the initial angular momentum by accreting matter. The corresponding radial transport of the angular momentum in a disk is described by the following equation [see e.g. Shakura & Sunyaev (1973)]:
| (A1) |
where is the accretion rate in the disk and is the component of a viscous stress tensor that is related to the gradient of the rotational frequency , namely,
| (A2) |
where is a half-thickness of a disk and is turbulent viscosity. The non-dimensional parameter that is essential for equation (A1) is the Reynolds number for the accretion flow,
| (A3) |
where is a characteristic velocity, and is the diffusion coefficient. can be defined as using the turbulent velocity and the related turbulent scale, respectively or as for the magnetic case where is the conductivity [e.g. see details of the D-definition in Lang (1998)].
Equations at (at the inner TL radius), at [the radius where the transition layer adjusts to the Keplerian motion for which ], and at were assumed by TLM98 to be the boundary conditions. Note that here we set the inner boundary at with of 3. This value of is valid for a BH whose spin is less than 0.8.
Thus, the profile and the outer radius of the transition layer are uniquely determined by the boundary conditions and the angular momentum equation (A1-A2) for a given value of the Reynolds number (see Eq. A3).
The solution of angular momentum equation (A1-A2) satisfying the above boundary conditions is equation (10) in TLM98 while the following equation (see also Eq. 11 in TLM98)
| (A4) |
determines as a function of parameter. Here and .
The adjustment of the Keplerian disk to the sub-Keplerian inner boundary creates conditions favorable for the formation of a hot plasma outflow at the outer boundary of the transition layer (TLM98), because the Keplerian motion (if it is followed by sub-Keplerian motion) must pass through a super-Keplerian centrifugal barrier region.
Note one can see that the right hand side of Eq. (A4) is linearly proportional to if because and for and . As a result can be canceled from left and right hand sides of Eq. (A4) when . Namely the value of dimensionless outer radius strongly depends on parameter (number) and independent of for .
It implies that the CC dimensionless size is a function parameter (number) only if . It is worth noting that in the general case the size is a function of and (or BH spin ) too. The direct scaling of with BH mass is not possible anymore. There is a systematic shift of the values of for a given because of BH spin .
Appendix B Spectral index as a reciprocal of the Comptonization parameter
The intensity of the injected soft photons undergoing scatterings in the Compton cloud is
| (B1) |
where is a mean probability of photon scattering in the CC. The probability of photon scattering is directly related to the mean number of scatterings
| (B2) |
where is a probability of the photon escape from the CC. Thus, using Eq. (B2), we obtain
| (B3) |
Because the average photon energy change per scattering (where for upscattering case), the injected photon energy after scatterings is
| (B4) |
The combination of Eqs. (B1), (B4) yields that the emergent upscattering spectrum of the soft photon of energy in the bounded Compton cloud is a power law
| (B5) |
which energy index is
| (B6) |
Using Eq. (B3) we can reduce Eq. (B6) to
| (B7) |
for and .
References
- Belloni et al. (2005) Belloni, T., Homan, J., Casella, P., van der Klis, M., Nespoli, E., Lewin, W. H. G., Miller, J. M., & Méndez, M. 2005, A&A, 440, 207
- Belloni (2005) Belloni, T. 2005, Interacting Binaries: Accretion, Evolution, and Outcomes, 797, 197
- Belloni et al. (2006) Belloni, T., et al. 2006, MNRAS, 367, 1113
- Borozdin et al. (1999) Borozdin, K., Revnivtsev, M., Trudolyubov, S., Shrader, C. & Titarchuk, L. 1999, ApJ, 517, 367
- Casella et al. (2004) Casella, P., Belloni, T., Homan, J., & Stella, L. 2004, A&A, 426, 587
- Dickey & Lockman (1990) Dickey,J.M., & Lockman, F.J. 1990, ARAA, 28, 215
- Dewangan, Titarchuk & Griffiths (2006) Dewangan, G. C., Titarchuk, L., Griffiths, R. E. 2006, ApJ, 637, 1, L21
- Filippenko & Chornock (2001) Filippenko, A. V., & Chornock, R. 2001, IAU Circ., 7644, 2
- Fiorito & Titarchuk (2004) Fiorito, R., Titarchuk, L. 2004, ApJ, 614, L113
- Green, Bailyn & Orosz (2001) Greene, J., Bailyn, C. D., & Orosz, J. A. 2001, ApJ, 554, 1290
- Herrero et al. (1995) Herrero, J., et al. 1995, A&A, 297, 556
- Hjellming & Rupen (1995) Hjellming, R.M.,& Rupen, M.P. 1995, Nature, 375,464
- Homan et al. (2006) Homan, J., Wijnands, R., Kong, A., Miller, J. M., Rossi, S., Belloni, T., & Lewin, W. H. G. 2006, MNRAS, 366, 235
- Hynes et al. (2004) Hynes, R. I., Steeghs, D., Casares, J., Charles, P. A., & O’Brien, K. 2004, ApJ, 609, 317
- Kalemci et al. (2005) Kalemci, E., Tomsick, J. A., Buxton, M. M., Rothschild, R. E., Pottschmidt, K., Corbel, S., Brocksopp, C., & Kaaret, P. 2005, ApJ, 622, 508
- Klein-Wolt & van der Klis (2008) Klein-Wolt, M., & van der Klis, M. 2008, ApJ, 675, 1407
- Lang (1998) Lang, K. R., 1998, Astrophysical Formulae, (Berlin: Springer)
- Laurent & Titarchuk (1999) Laurent, P. & Titarchuk, L. 1999, ApJ, 511, 289 (LT99)
- Laurent & Titarchuk (2007) Laurent, P. & Titarchuk, L. 2007, ApJ, 656, 1056
- McClintock et al. (2007) McClintock, J. E., Remillard, R. A., Rupen, M. P., Torres, M. A. P., Steeghs, D., Levine, A. M., & Orosz, J. A. 2007, ArXiv e-prints, 705, arXiv:0705.1034
- Montanari et al. (2008) Montanari, E., Titarchuk, L. & Frontera, F. 2008, ApJ, accepted, (arXiv:0810.5720)
- Muñoz-Darias et al. (2008) Muñoz-Darias, T., Casares, J., & Martínez-Pais, I. G. 2008, MNRAS, 385, 2205
- Ninkov et al. (1987) Ninkov, Z., Walker, G. A. H., & Yang, S. 1987, ApJ, 321, 425
- Orosz (2003) Orosz, J. A. 2003, A Massive Star Odyssey: From Main Sequence to Supernova, 212, 365 (astro-ph/0209041)
- Orosz et al. (2002) Orosz, J. A., et al. 2002, ApJ, 568, 845
- Orosz et al. (2004) Orosz, J. A., McClintock, J. E., Remillard, R. A., & Corbel, S. 2004, ApJ, 616, 376
- Park et al. (2004) Park, S. Q., et al. 2004, ApJ, 610, 378
- Remillard & McClintock (2006) Remillard, R. A., & McClintock, J. E. 2006, ARA&A, 44, 49
- Revnivtsev, Gilfanov & Churazov (2000) Revnivtsev, M., Gilfanov, M.,& Churazov, E. 2000, A&A, 363, 1013
- Rhoades & Ruffini (1974) C. E. Rhoades, C.E. Jr. & Ruffini, R., 1974, Phys. Review Letters, 32, 324
- Rodriguez, Corbel & Tomsick (2003) Rodriguez, J., Corbel, S., & Tomsick, J. A. 2003, ApJ, 595, 1032
- Rodriguez et al. (2004) Rodriguez, J., Corbel, S., Kalemci, E., Tomsick, J. A., & Tagger, M. 2004, ApJ, 612, 1018
- Rossi et al. (2004) Rossi, S., Homan, J., Miller, J. M., & Belloni, T. 2004, Nuclear Physics B Proceedings Supplements, 132, 416
- Rybicki & Lightman (1979) Rybicki, G. B., & Lightman, A. P. 1979, Radiative processes in astrophysics, New York, Wiley-Interscience
- Sánchez-Fernández et al. (1999) Sánchez-Fernández, C., et al. 1999, A&A, 348, L9
- Shakura & Sunyaev (1973) Shakura, N.I., & Sunyaev, R.A. 1973, A&A, 24, 337
- Shaposhnikov & Titarchuk (2006) Shaposhnikov, N., & Titarchuk, L. 2006, ApJ, 643, 1098 (ST06)
- Shaposhnikov & Titarchuk (2007) Shaposhnikov, N., & Titarchuk, L. 2007, ApJ, 663, 445 (ST07)
- Shaposhnikov & Titarchuk (2008) Shaposhnikov, N., & Titarchuk, L. 2008, AAS/High Energy Astrophysics Division, 10, #01.08
- Shimura & Takahara (1995) Shimura, T., & Takahara, F. 1995, ApJ, 445, 780
- Shrader & Titarchuk (2003) Shrader, C., & Titarchuk, L.G. 2003, ApJ, 598, 168
- Shrader & Titarchuk (1999) Shrader, C., & Titarchuk, L.G. 1999, ApJ, 521, L121
- Sunyaev & Titarchuk (1980) Sunyaev, R.A. & Titarchuk, L.G. 1980, A&A, 86, 121
- Sobczak et al. (1999) Sobczak, G. J., McClintock, J. E., Remillard, R. A., Levine, A. M., Morgan, E. H., Bailyn, C. D., & Orosz, J. A. 1999, ApJ, 517, L121
- Strohmayer et al. (2007) Strohmayer, T. E., Mushotzky, R, Winter, L., Soria, R., Uttley, P., Cropper, accepted for publication in ApJ, astro-ph/0701390
- Titarchuk, & Fiorito (2004) Titarchuk, L.G. & Fiorito, R. 2004, ApJ, 612, 988 (TF04)
- Titarchuk, Lapidus & Muslimov (1998) Titarchuk, L., Lapidus, I.I. & Muslimov, A. 1998, ApJ, 499, 315 (TLM98)
- Titarchuk, Mastichiadis & Kylafis (1997) Titarchuk, L., Mastichiadis, A., & Kylafis, N. D., 1997, ApJ, 487, 834
- Titarchuk & Shaposhnikov (2008) Titarchuk, L. & Shaposhnikov, N. 2008, ApJ, 678, 1230
- Titarchuk & Zannias (1998) Titarchuk, L. & Zannias, T. 1998, ApJ, 493, 863
- Trudolyubov (2001) Trudolyubov, S. P. 2001, ApJ, 558, 276
- Trudolyubov, Borozdin & Priedhorsky (2001) Trudolyubov, S. P., Borozdin, K. N., & Priedhorsky, W. C. 2001, MNRAS, 322, 309
- Vignarca et al. (2003) Vignarca, F., Migliari, S., Belloni, T., Psaltis, D., & van der Klis, M. 2003, A&A, 397, 729
- Zurita et al. (2002) Zurita, C., et al. 2002, MNRAS, 334, 999
| Source | Transition ID | Start | End | Type | Refs. |
|---|---|---|---|---|---|
| GRO J1655-40 | J1655-R05 | 22/02/05 | 13/03/05 | RISE | 11 |
| J1655-D05 | 11/09/05 | 27/09/05 | DECAY | 11 | |
| GX 339-4 | GX339-R02 | 23/04/02 | 18/05/02 | RISE | 4,5 |
| GX339-D03 | 20/02/03 | 05/06/03 | DECAY | ||
| GX339-R04 | 10/07/04 | 20/08/04 | RISE | ||
| GX339-R07 | 22/01/07 | 18/02/07 | RISE | ||
| GX339-D07 | 07/05/07 | 01/06/07 | DECAY | ||
| 4U 1543-47 | U1543-D02 | 14/07/02 | 31/07/02 | DECAY | 9,10 |
| XTE J1550-564 | J1550-R98 | 08/09/98 | 16/10/98 | RISE | 1,2,3 |
| J1550-R00 | 10/04/00 | 05/06/00 | RISE | 1,2,3 | |
| J1550-D00 | 05/06/00 | 16/07/00 | DECAY | 1,2,3 | |
| XTE J1650-500 | J1650-R01 | 06/09/01 | 28/09/01 | RISE | 7 |
| J1650-D01 | 19/11/01 | 25/11/01 | DECAY | 7 | |
| H 1743-322 | H1743-R03 | 28/03/03 | 27/04/03 | RISE | 3 |
| H1743-D03 | 15/10/03 | 03/11/03 | DECAY | ||
| XTE J1859+226 | J1859-R99 | 09/10/99 | 27/10/99 | RISE | 6 |
| Cygnus X-1 | CYGX1 | 15/06/01 | 01/12/02 | MIXED |
References. — 1Rodriguez, Corbel & Tomsick (2003),2Rodriguez et al. (2004),3McClintock et al. (2007),4Belloni et al. (2006),5Belloni et al. (2005), 6Casella et al. (2004),7Rossi et al. (2004),8Trudolyubov, Borozdin & Priedhorsky (2001),9Kalemci et al. (2005),10Park et al. (2004),11ST07,12Trudolyubov (2001),13Vignarca et al. (2003)
| Transition ID | Observation ID | MJDbbDate at the start of the RXTE observation | BH State | |||||||||
|---|---|---|---|---|---|---|---|---|---|---|---|---|
| day | Hz | keV | keV | keV | erg/s/cm2 | |||||||
| GX339-R07 | 92428-01-02-00 | 54122.27 | LHS | - | 0.455(9) | 0.61(3) | 0.39(3) | 0.0566(8) | 26(3) | 76(14) | 0.872(2) | 0.82 |
| 92428-01-03-00 | 54127.11 | LHS | - | 0.50(2) | 0.55(5) | 0.33(6) | 0.070(2) | 28(6) | 50(29) | 1.089(9) | 0.93 | |
| 92035-01-01-00 | 54129.47 | LHS | 0.164(6) | 0.51(1) | 0.65(3) | 0.44(2) | 0.076(1) | 21(2) | 95(9) | 1.160(2) | 0.73 | |
| 92035-01-01-01 | 54128.94 | LHS | 0.142(3) | 0.484(8) | 0.53(2) | 0.19(3) | 0.080(1) | 26(1) | 66(6) | 1.137(3) | 0.87 | |
| 92035-01-01-02 | 54131.10 | LHS | 0.180(4) | 0.527(9) | 0.59(3) | 0.38(3) | 0.0834(9) | 26(1) | 67(6) | 1.276(3) | 1.03 | |
| 92035-01-01-03 | 54130.13 | LHS | 0.167(4) | 0.48(1) | 0.55(2) | 0.20(3) | 0.086(1) | 22(1) | 73(6) | 1.214(3) | 0.86 | |
| 92035-01-01-04 | 54132.08 | LHS | 0.200(3) | 0.53(1) | 0.59(3) | 0.39(3) | 0.085(1) | 24(1) | 71(6) | 1.314(2) | 1.03 | |
| 92035-01-02-00 | 54133.00 | LHS | 0.237(8) | 0.55(1) | 0.58(3) | 0.39(3) | 0.088(1) | 25(4) | 72(19) | 1.354(3) | 0.90 | |
| 92035-01-02-01 | 54133.92 | LHS | 0.264(6) | 0.554(9) | 0.59(3) | 0.37(3) | 0.0899(9) | 25.2(9) | 68(6) | 1.362(3) | 0.98 | |
| 92035-01-02-02 | 54135.03 | LHS | 0.296(4) | 0.569(9) | 0.57(3) | 0.38(3) | 0.090(1) | 24.5(8) | 60(4) | 1.380(3) | 0.83 | |
| 92035-01-02-03 | 54136.02 | LHS | 0.361(6) | 0.56(1) | 0.60(3) | 0.37(3) | 0.094(1) | 22.7(9) | 72(5) | 1.414(3) | 1.16 | |
| 92035-01-02-04 | 54137.00 | LHS | 0.432(5) | 0.60(1) | 0.62(3) | 0.43(2) | 0.100(1) | 22.8(8) | 70(4) | 1.510(3) | 0.76 | |
| 92035-01-02-08 | 54137.85 | LHS | 0.53(2) | 0.63(1) | 0.54(3) | 0.33(4) | 0.104(2) | 21(1) | 78(8) | 1.522(3) | 0.98 | |
| 92035-01-02-07 | 54138.83 | LHS | 0.900(5) | 0.64(1) | 0.52(2) | 0.16(3) | 0.117(2) | 21.6(7) | 68(3) | 1.521(3) | 0.78 | |
| 92035-01-02-06 | 54139.94 | IS | 0.987(5) | 0.79(1) | 0.61(2) | 0.36(2) | 0.111(1) | 21.9(7) | 65(3) | 1.466(2) | 0.73 | |
| 92035-01-03-00 | 54140.20 | IS | 1.136(2) | 0.82(1) | 0.56(2) | 0.25(3) | 0.117(2) | 21.0(8) | 75(5) | 1.438(2) | 0.72 | |
| 92035-01-03-01 | 54141.05 | IS | 1.691(3) | 0.92(1) | 0.55(2) | 0.15(2) | 0.131(2) | 20.6(9) | 79(6) | 1.384(3) | 0.74 | |
| 92035-01-03-02 | 54142.04 | IS | 2.434(9) | 1.03(1) | 0.51(1) | -0.14(2) | 0.182(5) | 20.6(8) | 72(5) | 1.343(2) | 0.85 | |
| 92035-01-03-03 | 54143.02 | IS | 3.508(9) | 1.22(1) | 0.55(1) | -0.17(1) | 0.208(4) | 24(1) | 67(10) | 1.338(2) | 0.91 | |
| 92428-01-04-00 | 54143.87 | IS | 4.34(1) | 1.29(1) | 0.597(9) | -0.25(1) | 0.226(3) | 22(1) | 80(11) | 1.337(3) | 1.00 | |
| 92428-01-04-01 | 54143.95 | IS | 4.24(1) | 1.26(1) | 0.52(1) | -0.35(1) | 0.265(7) | 22(1) | 87(14) | 1.336(3) | 1.08 | |
| 92428-01-04-02 | 54144.09 | IS | 4.13(2) | 1.29(1) | 0.57(1) | -0.23(1) | 0.230(5) | 22(3) | 125(46) | 1.361(3) | 0.97 | |
| 92428-01-04-03 | 54144.87 | IS | 5.00(2) | 1.35(1) | 0.59(1) | -0.33(1) | 0.253(5) | 25(3) | 81(33) | 1.346(4) | 1.31 | |
| 92428-01-04-04 | 54145.96 | IS | 5.63(2) | 1.39(1) | 0.597(9) | -0.38(1) | 0.270(5) | 22(2) | 89(33) | 1.346(3) | 1.17 | |
| 92035-01-03-05 | 54145.11 | IS | 5.80(2) | 1.35(1) | 0.554(8) | -0.50(1) | 0.307(6) | 25(2) | 81(17) | 1.303(3) | 1.37 | |
| 92035-01-03-06 | 54146.03 | IS | 5.55(2) | 1.36(1) | 0.601(8) | -0.40(1) | 0.269(4) | 21(2) | 111(24) | 1.343(2) | 1.29 | |
| 92035-01-04-00 | 54147.01 | IS | 6.67(2) | 1.53(1) | 0.626(7) | -0.608(9) | 0.338(5) | - | - | 1.371(3) | 1.59 | |
| 92035-01-04-01 | 54148.14 | IS | - | 1.26(3) | 0.796(7) | -0.96(1) | 0.194(5) | - | - | 1.024(6) | 1.07 | |
| 92035-01-04-02 | 54149.69 | HSS | - | 1.19(2) | 0.782(4) | -1.104(8) | 0.193(4) | - | - | 0.963(6) | 1.27 |
| Target Tr. ID | Reference Tr. ID | Fig. 8 | |||||
|---|---|---|---|---|---|---|---|
| Panel | |||||||
| GX339-D07 | J1655-D05 | A | 1.960.12 | 1.650.06 | 12.31.4 | 5.750.64 | 1 |
| GX339-R04 | J1655-R05 | 1.950.19 | 1.90.1 | 12.31.8 | 6.150.83 | 1 | |
| U1543-D03 | J1655-D05 | B | 1.490.15 | 2.230.22 | 9.41.4 | 3.50.5 | 0.37 |
| J1550-R00 | GX339-R04 | C | 0.870.02 | 0.370.02 | 10.71.5 | 3.30.5 | 1 |
| J1650-D01 | GX339-D03 | D | 0.800.02 | 0.470.01 | 9.91.4 | 3.50.5 | 1 |
| J1650-R01 | GX339-R04 | E | 0.760.02 | 0.3580.004 | 9.31.2 | 2.950.4 | 1 |
| H1743-D03 | GX339-D03 | F | 1.150.07 | 2.160.13 | 12.72.6 | 9.12.0 | 1 |
| H1743-R03 | J1550-R98a | G | 1.190.08 | 6.440.52 | 14.22.4 | 9.11.6 | 1 |
| J1859-R99 | J1550-R98b | H | 0.6960.015 | 0.4290.005 | 7.71.2 | 4.20.5 | 1 |
| CYGX1 | J1655-D05 | K | 1.170.03 | 0.1440.003 | 7.40.6 | 2.040.18 | 0.42 |
| CYGX1 | U1543-D03 | 0.850.02 | 0.0640.001 | 8.00.9 | 2.10.4 | 0.42 |
| Transition | Index-QPO | Index-Normalization | |||||||
|---|---|---|---|---|---|---|---|---|---|
| B | D | A | B | D | |||||
| J1655-R05 | 0.590.04 | 3.00.1 | 1.0 | 1.6 0.2 | 2.2 | 0.4000.003 | 0.0610.003 | 1.0 | 2.30.6 |
| J1655-D05 | 0.580.01 | 10.90.4 | 0.1 | 1.0 | 2.02 0.02 | 0.440.02 | 0.0260.002 | 1.0 | 1.880.25 |
| GX339-D03 | 0.660.02 | 5.40.4 | 0.1 | 1.0 | 2.080.01 | 0.450.02 | 0.0100.001 | 1.0 | 2.00.3 |
| GX339-R04 | 0.580.02 | 1.40.2 | 1.0 | 1.0 | 2.140.01 | 0.510.02 | 0.0390.002 | 1.0 | 3.5 |
| J1550-R98a | 1.270.02 | 1.840.07 | 1.0 | 0.650.02 | 2.940.08 | 1.80.3 | 0.1620.05 | 1.0 | 0.60.1 |
| J1550-R98b | 1.320.03 | 1.970.07 | 1.0 | 0.5 | 2.55 | 1.250.04 | 0.1640.004 | 1.0 | 1.0 |
| Source | aaDynamically determined BH mass and system inclination | ,bbSource distances found in literature | , | Refs. | ||||
|---|---|---|---|---|---|---|---|---|
| deg | kpc | kpc | ||||||
| GRO J1655-40ddGRO J1655-40 is a primary reference source. All masses and distances given in columns 9 and 10 are determined with respect to the best measured parameters for this source. | 6.30.3 | 701 | 3.20.2 | 1,2 | ||||
| GX 339-4 | - | 7.51.6 | 9.03.8(4) | 12.31.4 | 5.750.8 | 5,6 | ||
| 4U 1543-47 | 9.41.0 | 20.7 1.5 | 7.51.0 | 14.81.6 (6.4) | 9.41.4 | 9.41.8 | 7,8 | |
| XTE J1550-564 | 9.51.1 | 725 | 2.5,6 | 9.42.1 (5) | 10.71.5 | 3.30.5 | 9,10,11 | |
| XTE J1650-500 | 2.60.7 | 10.64.0 (5) | 9.71.6 | 3.30.7 | 12,13 | |||
| H 1743-322 | 11 | 10 | - | 13.33.2 | 9.11.5 | 14 | ||
| XTE J1859-226 | 7.6 - 12.0 | - | 11 | 12.31.7 (11) | 7.71.3 | 4.20.5 | 15,16 | |
| Cygnus X-1 | 6.8 - 13.3 | 35 5 | 2.50.3 | - | 7.91.0 | 2.20.3 | 3,4 |
References. — 1Green, Bailyn & Orosz (2001),2Hjellming & Rupen (1995),3Herrero et al. (1995),4Ninkov et al. (1987),5Muñoz-Darias et al. (2008),6Hynes et al. (2004),7Orosz (2003),8Park et al. (2004),9Orosz et al. (2002),10Sánchez-Fernández et al. (1999),11Sobczak et al. (1999),12Orosz et al. (2004),13Homan et al. (2006),14McClintock et al. (2007),15Filippenko & Chornock (2001),16Zurita et al. (2002)