Spitzer Spectroscopy of the Galactic Supernova Remnant G292.0+1.8: Structure and Composition of the Oxygen-Rich Ejecta
Abstract
We present mid-infrared (540 ) spectra of shocked ejecta in the Galactic oxygen-rich supernova remnant G292.0+1.8 , acquired with the IRS spectrograph on board the Spitzer Space Telescope. The observations targeted two positions within the brightest oxygen-rich feature in G292.0+1.8 . Emission lines of [Ne II] 12.8, [Ne III] 15.5,36.0, [Ne V] 24.3 and [O IV] 25.9 are detected from the shocked ejecta. In marked contrast to what is observed in Cassiopeia A, no discernible mid-IR emission from heavier species such as Mg, Si, S, Ar or Fe is detected in G292.0+1.8 . We also detect a broad emission bump between 15 and 28 in spectra of the radiatively shocked O-rich ejecta in G292.0+1.8 . We suggest that this feature arises from either shock-heated Mg2SiO4 (forsterite) dust in the radiatively shocked O-rich ejecta, or collisional excitation of PAHs in the blast wave of the SNR. If the former interpretation is correct, this would be the first mid-IR detection of ejecta dust in G292.0+1.8 . A featureless dust continuum is also detected from non-radiative shocks in the circumstellar medium around G292.0+1.8 . The mid-IR continuum from these structures, which lack mid-IR line emission, is seen in Chandra images as bright X-ray filaments, is well described by a two-component silicate dust model. The temperature of the hot dust component (M210-3 M⊙) is 115 K, while that of the cold component (roughly constrained to be 3 M⊙) is 35 K. We attribute the hot component to collisionally heated dust in the circumstellar shocks in G292.0+1.8 , and attribute the cold component to dust heated by the hard FUV radiation from the circumstellar shocks. Using average O/Ne and O/Si mass ratios measured for a sample of ejecta knots in the X-rays, our models yield line strengths consistent with mass ratios 3, 61 and 50. These ratios (especially the large O/Ne mass ratio) are difficult to reproduce with standard nucleosynthesis models of well-mixed supernova ejecta. This reinforces the conclusions of existing X-ray studies that the reverse shock in G292.0+1.8 is currently propagating into the hydrostatic nucleosynthetic layers of the progenitor star, and has not yet penetrated the layers dominated by explosive nucleosynthetic products.
Subject headings:
ISM: individual (G292.0+1.8), ISM: kinematics and dynamics, shock waves, plasmas, ISM: cosmic rays, supernova remnants1. INTRODUCTION
The Galactic supernova remnant (SNR) G292.0+1.8 is one of seven known SNRs whose optical spectrum is dominated by emission from metal-rich ejecta produced during a core collapse SN. The optical emission arises in dense knots of ejecta where the shocks have become radiative. The prominent [O I], [O II] and [O III] emission lines observed in the spectra of these SNRs have earned them the title ’oxygen-rich supernova remnants’ (OSNRs). Aside from G292.0+1.8 , the other known OSNRs include Cassiopeia A (Minkowski 1957, Chevalier & Kirshner 1978, 1979, Fesen et al. 2001) and Puppis A (Winkler & Kirshner 1985) in the Milky Way, N132D (Lasker 1978, 1980; Morse, Winkler & Kirshner 1995; Morse et al. 1996; Blair et al. 2000) and 054069.3 (Kirshner et al. 1989; Serafimovich et al. 2005) in the LMC, 1 E0102.27219 in the SMC (Dopita, Tuohy & Mathewson 1981, Blair et al. 2000) and the luminous, spatially unresolved OSNR in the irregular galaxy NGC 4449 (Kirshner & Blair 1980; Milisavljevic & Fesen 2008).
More recently with the availability of high quality X-ray spectra of SNRs from Chandra and XMM, core-collapse SNRs have been identified purely from their line emission in X-ray spectra. The X-ray emission arises from faster shocks in lower density material, where the shocks remain in the non-radiative phase. These objects include purely non-radiative remnants such as B004973.6 in the SMC (Hendrick, Reynolds & Borkowski 2005) and E010372.6 in the SMC (Park et al. 2003). The lack of optically-emitting ejecta knots in these objects indicates either that dense ejecta knots do not exist in these objects or that this material is not currently being encountered by the reverse shock.
Based on our current understanding, the core-collapse supernovae that produce OSNRs (i.e., those exhibiting oxygen line emission in the optical) should leave behind rotating neutron stars (pulsars), but G292.0+1.8 is the only Galactic remnant from this class found to harbor both an active pulsar (Camilo et al. 2002, Hughes et al. 2003) and an associated pulsar wind nebula (PWN) (Hughes et al. 2001). Recent analyses of Chandra data of G292.0+1.8 (Park et al. 2002, 2004; Gonzalez & Safi-Harb 2003) have shown that a prominent X-ray filament stretching across the center of the OSNR seen in earlier Einstein observations (Tuohy, Burton & Clark 1982) is of normal composition. This suggests that G292.0+1.8 is interacting with circumstellar material. Due to the fact that is nearby, spatially resolved and exhibits all the expected features of a core-collapse SN (O-rich optical and X-ray emission, active pulsar/PWN and apparent circumstellar interaction) it is critical to carry out as many detailed studies of G292.0+1.8 in as many wavelength ranges as possible.
Recently the Infrared Spectrograph (IRS; Houck et al. 2004) on the Spitzer Space Telescope (SST) has provided a major step forward in sensitivity and spectral resolution in the spectroscopy of objects in the mid-IR. OSNRs, which exhibit strong shock-excited line and continuum emission, are particularly well suited for study with the IRS. The optical spectra of these remnants provide critical kinematic information from the Doppler shifts of strong emission lines. However, in the case of G292.0+1.8 and many of the other OSNRs, the optical spectra are dominated by few ions, making abundance measurements difficult. In addition, most Galactic SNRs including G292.0+1.8 are located in the plane of the Galaxy where significant extinction prevents the detection of the UV lines expected from these objects. These problems are circumvented in the mid-IR, where emission lines from nearly all of the main burning products of core collapse SNe, including O, Ne, Mg, Si, S, Ar and Fe, are expected in the 5-40 bandpass of IRS. In addition, the presence of multiple ionization stages from some species such as Ne, S, Ar and Fe in this band and insensitivity of IR fine structure lines to temperature help simplify the spectral analysis compared to optical and X-ray studies.
The IRS also provides a sensitive tool for probing the properties of dust in both the ISM and supernova ejecta. Dust grains overrun by supernova shocks are progressively heated and destroyed downstream from the flow (Tielens et al. 1994), producing continuum emission that often peaks in the mid-infrared (Draine 1981, Dwek, Foster & Vancura 1996). Dust continuum is observed from fast ( 1000 km s-1 ) non-radiative shocks driven into the ISM and CSM of young SNRs (as in Kepler’s SNR, see Blair et al. 2007), and from radiative shocks ( 150-500 km s-1 ) in dense (1000-104 cm-3) ISM/CSM and metal-rich ejecta, e.g., Cas A (Ennis et al. 2005; Rho et al. 2008; Smith et al. 2008); E010272.3 (Sandstrom et al. 2008) and N132D (Tappe, Reach & Rho 2006).
With the above diagnostic capabilities of Spitzer in mind, we undertook a Spitzer project to study the composition and physical state of the ejecta in G292.0+1.8 . The goals of these observations were to (1) measure the relative abundances of nucleosynthetic products within the shocked ejecta, and if possible, to compare the results with theoretical models of massive stellar evolution to refine mass estimates of the progenitor star; and (2) to investigate the emission from heated dust in G292.0+1.8 . Throughout our discussion, IR wavelengths are shown in units, and optical wavelengths are given in Å. Below we describe the observational program undertaken and our analysis.
2. OBSERVATIONS
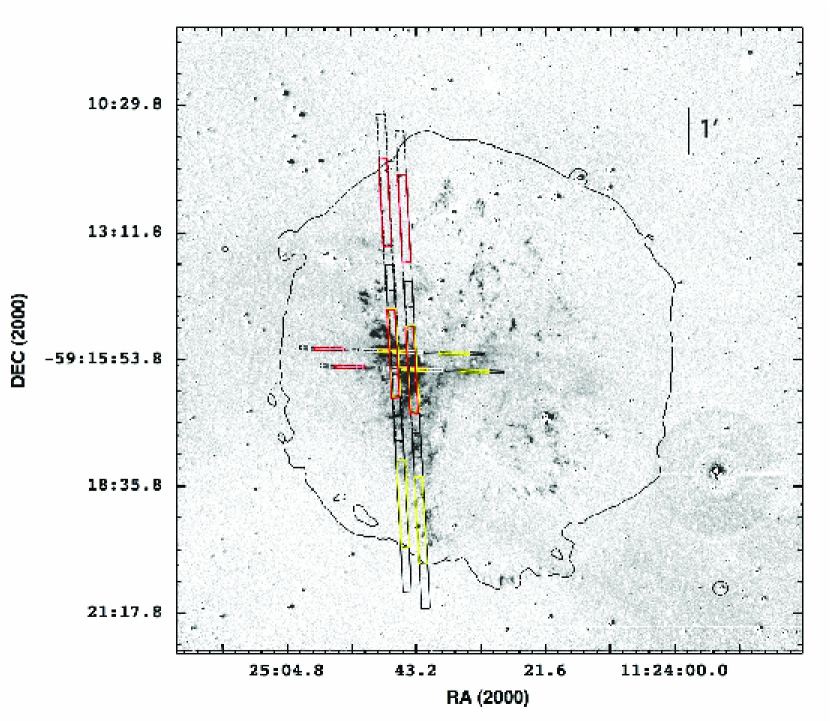
We observed G292.0+1.8 in a set of observations with the low resolution IRS module in early 2004 (Table 1). The observations were performed in IRS Staring mode as part of the Cycle 1 Guest Investigator program (PID 3598; P. Ghavamian, PI). Details of the instrument configuration are listed in Table 1. We observed two regions in G292.0+1.8 , located in the upper and lower portions of the dominant oxygen-rich feature in G292.0+1.8 known as the ’Spur’ (Goss et al. 1979; Ghavamian, Hughes & Williams 2005; Winkler & Long 2006; hereafter WL06) (see Fig. 1). The spectroscopic observations of the Spur included data from all four modules, namely Short-Low (SL) 2nd order (5.2-8.7 ), SL 1st order (7.4-14.5 ), Long-Low (LL) 2nd order (14.0-21.3 ) and LL 1st order (19.5-38.0 ). The spectroscopic resolution of the low resolution module lies in the range 64 128 in the wavelength range 5.2 38.0 . The spatial pixel scale of the SL modules is 18 pixel-1, while that of the LL modules is 51 pixel-1.
The positions of the slits for the observation dates are marked on the continuum-subtracted [O III] image of G292.0+1.8 (WL06) in Fig. 1. We list observational details such as the celestial coordinates of each pointing, position angles of the slits and number of observing cycles in Table 1. The staring observation through each IRS module consisted of two dithered pointings wherein the targeted feature is placed 1/3 of the distance along the length of the slit, then moved to a position 2/3 of the way along the length of the slit. The resulting spectra overlap in a region approximately 38 in length for the SL slits, and 112 in length for the LL slits. In the final combined data, the object spectra are extracted from this overlap region, where the signal-to-noise is highest.
We analyzed the G292.0+1.8 IRS spectra using the version S13.2.0 products of the IRS calibration pipeline. Before extracting the spectra we cleaned the coadded the two-dimensional spectra from each nod into a single high signal-to-noise spectrum. For each set of pointings we first removed rogue pixels from the bcd images using the IRSCLEAN v1.7 algorithm111Developed by J. Ingalls and the Cornell IRS instrument team, and distributed by the Spitzer Science Center at http://ssc.spitzer.caltech.edu/archanaly/contributed/ . Next we shifted the second set of nods by the length of each nod (11 pixels) to bring them into alignment with the first set, then combined all of the aligned data together into a single high signal-to-noise spectrum for each targeted position. There are two sets of combined spectra for Spur positions 1 and 2 (effective integration time of 1200 s for SL1/SL2 and 2400 s for LL1/LL2). We produced a combined uncertainty image for each data set by taking the root sum square of the individual bcd uncertainty images, then dividing the final uncertainty image by the square root of the total number of frames. The combined bad pixel masks were produced by adding the individual bad pixel masks for each bcd. After creating the final combined images we extracted one-dimensional spectra using SPICE222The Spitzer IRS Custom Extraction Software is distributed by the Spitzer Science Center at http://ssc.spitzer.caltech.edu/postbcd/spice.html v1.4.1.
Due to the extended nature of the targeted emission in G292.0+1.8 , the extraction and flux calibration of spectra required additional processing. The spectral extraction performed by the pipeline is optimized for point sources, with the extraction aperture expanding in the spatial dimension at longer wavelengths to account for widening of the instrumental PSF. The SNR emission in G292.0+1.8 , however, is spatially extended. If the emission is assumed to be uniform (admittedly a crude assumption for G292.0+1.8 ), then the emission gains from outside the extraction aperture compensate for losses at longer wavelengths, and the tapered extraction performed by the SPICE pipeline must be undone. This is accomplished by measuring the aperture loss correction function and the slit loss correction function for the spectrum and, multiplying these functions by the object spectrum. The correction factors have been calculated as a function of wavelength for each IRS module by Tappe, Reach & Rho (2006) from simulations of the Spitzer PSF. These simulations indicate that the correction factors vary between 0.6 and 0.8 over the full wavelength range covered by the two modules. The final correction includes division of the correction factors by the angular area covered by the extraction aperture. Multiplication of this final correction by a spectrum extracted in SPICE (units of Jy) gives a spectrum in units of Jy sr-1.
To obtain spectra of features in G292.0+1.8 we utilized the default extraction window used by SPICE for point source extraction to obtain spectra in units of Jy. We then multiplied these spectra by the extended source correction function described above to obtain spectra in surface brightness units (here W m-2 s-1 ). After extraction in SPICE we loaded the resulting spectra into the SMART333SMART was developed by the IRS Team at Cornell University and is available through the Spitzer Science Center at Caltech. application (Higdon et al. 2004) for analysis and post-processing.
3. ANALYSIS
3.1. DETECTED FEATURES
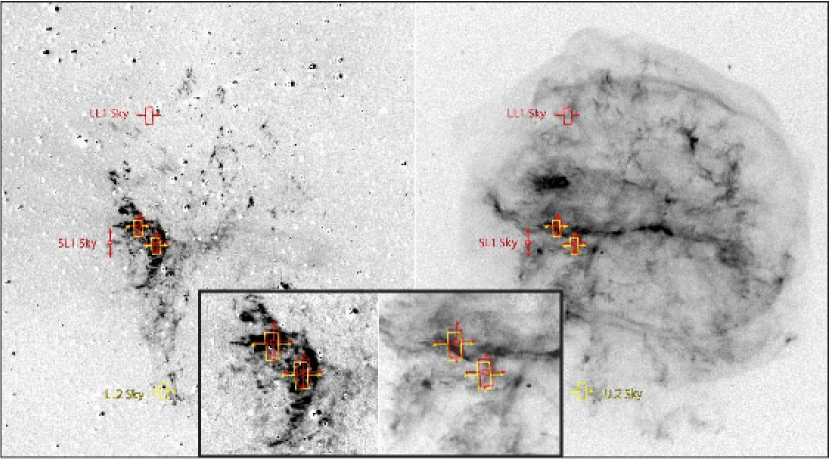
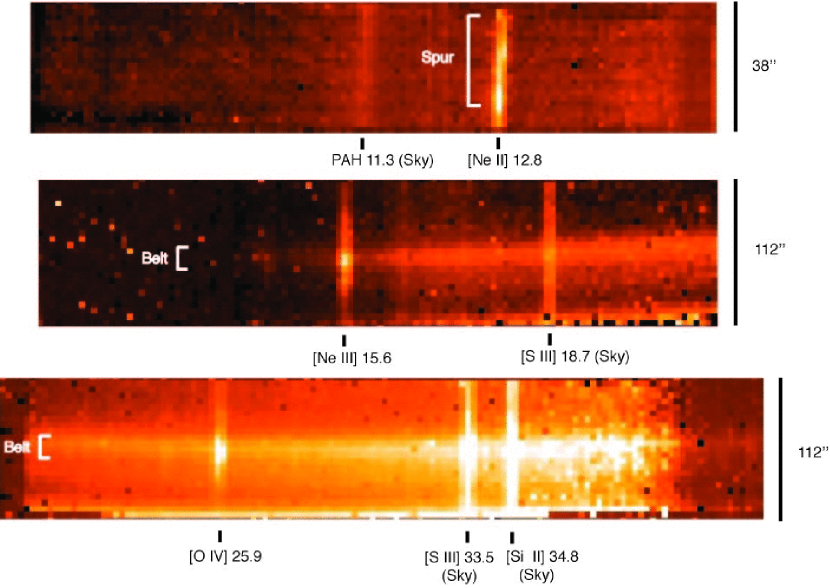
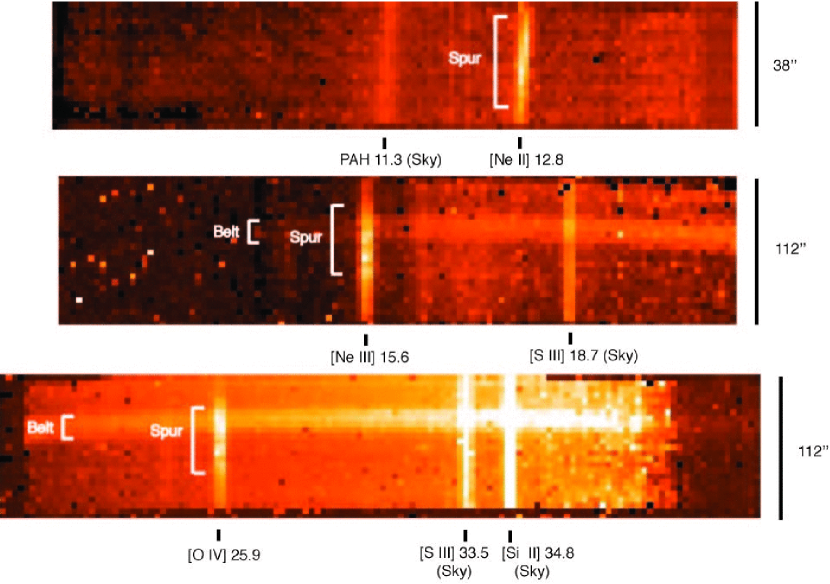
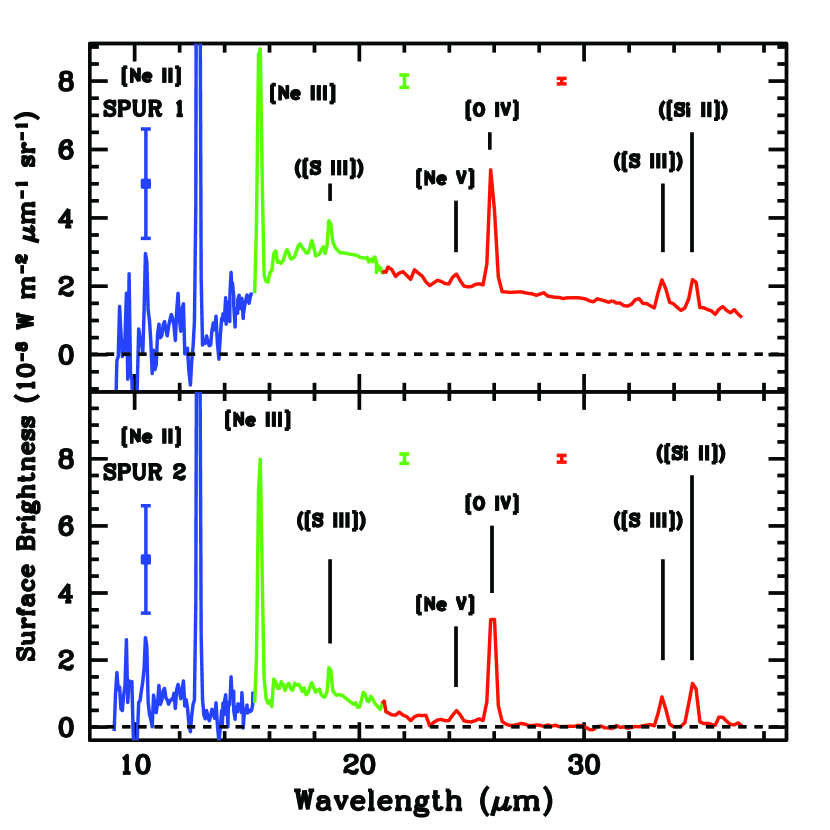
We performed spectral extractions from the upper and lower portions of the Spur as shown in Figure 2, corresponding to positions 1 and 2 listed in Table 1. Of the data taken in the four low resolution modules, all but the SL2 module (5.2-7.7 ) exhibit emission from either the SNR, its surrounding H II region, or both. The combined, cleaned two-dimensional spectra are shown in Figures 3 and 4 without background subtraction. In these two-dimensional spectra, we detect atomic line emission from the following transitions: [Ne II] 12.8, [Ne III] 15.6, [S III] 18.7, [O IV] 25.9, [S III] 33.6 and [Si II] 34.8. Less obvious in the two-dimensional spectra is [Ne V] 24.3, which is detected at the 15 and 23 levels in the sky-subtracted, one-dimensional spectra of Spur1 and Spur2 (respectively). A faint, diffuse emission feature is detected at 11.3 , consistent with a known polycyclic aromatic hydrocarbon (PAH) feature at that wavelength (Allamandola, Tielens, & Barker 1989). A continuum, rising toward longer wavelengths, is detected near the center of the LL1 and LL2 slits, consistent with dust emission from localized clumps of material.
Because our lines of sight pass well inside the projected edge of the SNR, the features detected in the IRS spectra of G292.0+1.8 arise from a combination of line/continuum emission from photoionized gas, radiative shocks in ejecta, and non-radiative shocks in the lower density circumstellar medium/ISM around the SNR. Although the gas phase component of the first two features can be traced at optical wavelengths via their forbidden line emission, the gas in the latter feature is very hot (106-108 K) and ionized, and is only detectable at X-ray wavelengths. On the other hand, the heated dust component in photoionized regions, radiative shocks, and non-radiative shocks can produce continuum emission in the mid-infrared band (Tielens & Hollenbach 1985; Vancura et al. 1994). Therefore, a careful comparison of the spatial information in the IRS spectra to the X-ray and optical images is critical for the identification and interpretation of mid-infrared features detected in Figures 3 and 4. As we show below, the dust continuum observed from structures in the IRS slit can all be attributed to the belt-like structure of circumstellar material observed in the Einstein (Tuohy, Burton & Clark 1982) and Chandra (Park et al. 2002, 2004, 2007) X-ray imagery of the OSNR.
There is significant structure evident along the slit in the lines of [Ne II] 12.8, [Ne III] 15.6 and [O IV] 25.9, and the emission from these lines rises sharply at the position of the ejecta in each of the spectra. These properties indicate strong emission from the Spur (ejecta) in O and Ne. On the other hand, the [S III] and [Si II] emission is relatively uniform and appears to fill the length of the slit, suggesting an association with the photoionized H II region surrounding G292.0+1.8 (this can be seen as the region of enhanced diffuse emission near the Spur in Figure 1). The emission at 25.9 may in principle be due to either of [O IV] or [Fe II]. These two spectral lines cannot be resolved from one another at the spectral resolution of the LL module, but given the high ionization potential of O2+ (54.9) eV it is likely that the faint emission seen near 25.9 is the [Fe II] 25.99, while the bright emission detected from the ejecta is [O IV] 25.9 . (As we show in the spectral fits described in the next section, the centroid of the feature near 25.9 is consistent with this line identification.)
In addition to the above emission, there are also discrete, diffuse features detected along the full length of the LL2 slit between 15 and 20 in all the unsubtracted spectra. The features blend together to form a plateau of emission. Discrete PAH features are detected at 16.4, 17.4 and 17.8 (consistent with photoionized emission from the overlying H II region) as well as a (0-0) S(1) emission feature at 17.03 . The detection of in particular argues for a contribution to the mid-IR background from gas along the line of sight unrelated to G292.0+1.8 .
3.2. SKY VARIABILITY AND SUBTRACTION
One of the main challenges in the interpretation of our Spitzer spectra of G292.0+1.8 is the characterization and subtraction of the sky emission from our spectra of the O-rich shocks. Since our observations did not include a separate sky exposure, our best option was to measure the sky emission from the off-object spectral order during each observation. For example, in LL1 observations targeting the Spur we extracted sky spectra from the LL2 channel, and vice versa for the LL2 observations. We followed a similar procedure for the SL spectra. We found that the Spur position 2 data provided the cleanest regions of sky emission, with the least amount of contamination from dust continuum from circumstellar material. We extracted sky spectra from the Spur position 2 data, using the default point source extraction aperture from SPICE as marked in Figure 2. We then multiplied the spectra by the extended source correction factors described above to obtain the sky spectrum in surface brightness units.
The most obvious complication in our sky estimation is that each order samples a different section of sky emission (as shown in Figure 2). In the optical, X-ray and now IRS data of G292.0+1.8 it is clear that the interior emission varies significantly from location to location. For example, it is evident from the [O III] image in Figure 1 that the diffuse photoionized emission surrounding G292.0+1.8 is distributed in a non-uniform manner: a swath of diffuse [O III] emission extending 2′ from the Spur exhibits significantly higher surface brightness than the emission immediately to the north where the fast-moving knots (FMKs) are observed (Ghavamian, Hughes & Williams 2005; WL06). More specifically, the [O III] surface brightness at the position where LL2 sky emission is sampled (Figure 2) is 70% lower than the diffuse [O III] emission immediately surrounding the Spur, while the [O III] sky emission sampled in the LL1 spectrum is 20% fainter than the diffuse emission around the Spur. These differences likely correspond to either variations in the density of the photoionized medium around G292.0+1.8 , or an enhancement in the flux of UV radiation near the O-rich ejecta on the eastern side of the SNR, or some combination of both.
Given the comparative faintness of the diffuse [O III] emission in the sky slits relative to the emission immediately surrounding the Spur, we can expect the mid-IR sky lines to also be intrinsically fainter than those close to the Spur. This results in under-subtraction of the line emission from the mid-IR spectra of the Spur, an effect which is clearly seen in the extracted spectra from both positions in the Spur (Figure 5). Specifically, the faint [S III] 18.7,33.6 and [Si II] 34.8 line emission in the spectra are likely residuals from incomplete sky subtraction.
To extract the spectrum of Spur Position 1 we first obtained a spectrum from the center of the slit, where a strip of enhanced line and continuum emission is seen in the two-dimensional LL1 and LL2 spectra (see Figure 3). We then subtracted the IRS sky spectrum obtained from the SL1, LL2 and LL1 apertures marked in Figure 2 to obtain the final spectrum. The line and continuum emission in the Position 1 spectrum appear to arise from the same source (Figure 3), suggesting at first that we may have detected dust emission from radiative shocks in the Spur. However, upon overlaying the IRS slit positions onto the [O III] and Chandra images of G292.0+1.8 it becomes clear that the situation is more complex. The extracted region coincides with both the circumstellar belt (seen in the Chandra image in Figure 2) and the radiative O-rich shocks in the Spur. It is unclear which of these structures generates the observed continuum. At mid-IR wavelengths the non-radiative shocks in the circumstellar belt are likely to produce strong continuum emission from shocked circumstellar/ISM dust. On the other hand, O-rich ejecta in the Spur are expected to produce strong line emission in the mid-IR. However, do they also contribute dust continuum emission? With the given geometric projection of the Spur onto the circumstellar belt it is difficult to answer this question.
The answer to the above question may be found by inspection of the two-dimensional spectrum of Position 2 (Figure 4). There, the radiatively shocked ejecta in the Spur (as detected in the LL1/LL2 observations) can be isolated spatially from the circumstellar X-ray belt, allowing us to better isolate emission from the two components. From Figure 4 it is clear that at the top of the IRS slit the radiative O-rich shocks of the Spur (distinguished by strong [O IV] 25.9 and [Ne III] 15.6 emission) are seen in projection on the circumstellar belt. Toward the bottom of the slit the two components separate spatially from one another, revealing that the Spur is dominated in the mid-IR by line emission. There is no clear dust continuum detected from the Spur. Extracting a spectrum from the continuum-free portion of the Spur in Figure 4 and subtracting the same sky spectrum used for obtaining the spectrum of Position 1, we obtained the spectrum for Position 2 shown in the lower panel of Figure 5. Save for the emission bump between 15 and 28 , the sky-subtracted spectrum of Position 2 shows no obvious underlying continuum. The residual 15-28 bump indicates excess emission from this feature at the location of the Spur (we defer discussion of this feature to Section 5). In Table 2, we present measurements of the emission line surface brightnesses and velocities as measured from the sky-subtracted data described above. These line strengths will form the basis of our comparison to shock models described in Section 4.
3.3. CIRCUMSTELLAR DUST CONTINUUM
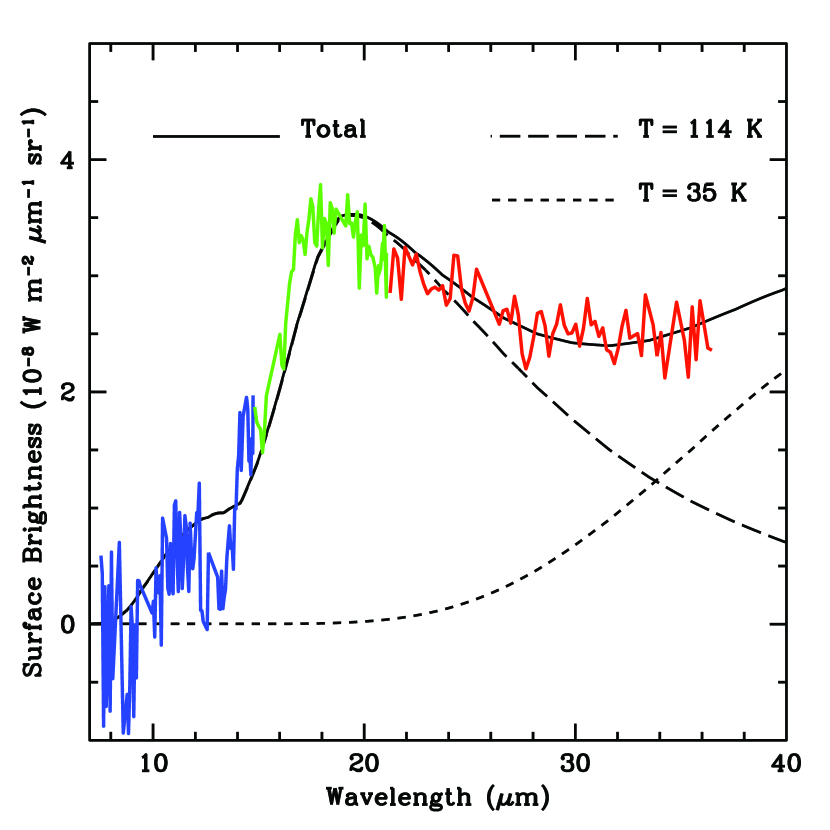
Having separated the emission from the shocked radiative ejecta (line-dominated) and the shocked non-radiative circumstellar belt (continuum-dominated), we now describe the properties of each component. We focus on the continuum from the belt observed in Position 1 (Figures 4 and 5). After masking the emission lines in the Position 1 spectrum we fit the underlying continuum with a modified blackbody using the SMART application. We fit two different dust types to the spectrum, one consisting of 0.1 silicate grains and one consisting of the = 3.1 grain mix suggested by Weingartner & Draine (2001) for the Milky Way ISM. We obtained equally good matches from both dust models, although this is most likely due to the substantial flux uncertainty in the data shortward of 22 Å (i.e., SL1 and LL2 data), as well as relative uncertainties in the flux calibration between channels. The fit to the spectrum is primarily driven by the LL1 channel data, where the flux errors are smallest. Therefore, aside from excluding a pure graphite composition for the dust grains, we cannot place strong constraints on the relative concentrations of graphite and silicate grains in the circumstellar belt from our IRS spectrum of the belt.
For the overall fit, we found it necessary to use two blackbody components to fit the spectrum, as shown in Figure 6: (1) a hot component (1145 K for both assumed compositions) to match the peak in the spectrum near 20 , and (2) a cold component to match the excess IR continuum longward of 20 (Figure 6), with = 386 K for a pure 0.1 silicate distribution or = 348 K for a Weingartner & Draine (2001) distribution. While the error bars on the cold component from SMART are fairly small, the fact that only the tail of this component lies in the observed range means that there is significant uncertainty in the characteristics of this component. However, clearly the presence of a cold component is indicated in our continuum fit shown in Figure 6.
From our dust model fits to the spectrum, we obtain a hot dust mass of (1.70.6)10-3 and a cold dust mass of 3.11.4 for both a Weingartner & Draine (2001) and 0.1 silicate dust composition. The large dust mass obtained for the cold component is very sensitive to the temperature of this component, which is itself very uncertain. MIPS 70 imagery just obtained in our Cycle 4 Spitzer program will better elucidate the characteristics of this component.
The temperature of the hot component and its close spatial correlation with the belt seen in the Chandra images strongly suggests that the continuum emission shortward of 20 arises from circumstellar dust overrun by the blast wave of G292.0+1.8 . The need for two grain temperatures indicates that there are either two different types of grains present within the shocked circumstellar belt, or that the same species of grains exist at two distinct temperatures. Assuming the latter, along with the fact that the temperature of the cold component likely exceeds the temperature of 15-20 K expected from dust grains in an average interstellar radiation field (Li & Draine 2001), then the two dust components can be attributed to two processes: collisional heating of grains behind the non-radiative shocks in the belt (hot component) and the heating of preshock grains by FUV radiation from the radiative precursor in the belt (cold component). The presence of faint [O III] 4959,5007 from the circumstellar belt in G292.0+1.8 (Ghavamian, Hughes, & Williams 2005) suggests that the shocks are becoming radiative there. In that case, FUV radiation produced in the partially formed cooling zone may be strong enough to heat the preshock dust in the belt up to 30 K.
3.4. KINEMATIC PROPERTIES
An interesting feature in our Spitzer spectra is the varying shape of the [Ne II] 12.8 line along the spatial length of the IRS slit. Tracing the shape of the [Ne II] line from the top of the SL slit down to its bottom, we can clearly distinguish an S-shaped variation in the shape of the line profile. This pattern can be seen at both observed positions in the Spur (Figures 3 and 4). This pattern is not seen in the [Ne II] sky emission, implying that we are resolving velocity structure (bulk Doppler motions) in the shocked ejecta.
We searched for a velocity shift in the centroid of the [Ne II] emission between the two ends of the slit in Spur Position. We utilized a point source aperture extraction box to obtain two spectra, one from each end of the 38″ overlap region between the two SL 1 nods (these correspond to the top and bottom ends of the two-dimensional spectrum seen in Figure 3). After subtracting the sky emission from the two spectra, we fit the [Ne II] 12.8 line profiles. Although our fits to the line did not reveal any additional broadening beyond the instrumental resolution (3000 km s-1 at 12.8 , or R 100), we did detect a variation in the velocity centroid of the [Ne II] 12.8 line: at the top (eastern) end of the slit the [Ne II] 12.8 velocity is blueshifted to a heliocentric velocity of 7324 km s-1 , while at the bottom (western) end of the slit the line is redshifted to a velocity of +29013 km s-1 . This result indicates that a velocity gradient of 365 km s-1 exists in the Ne-rich ejecta of the Spur, consistent with results from [O III] 5007 Fabry-Perot studies of the O-rich ejecta (Ghavamian, Hughes, & Williams 2005).
4. SHOCK MODELS
The presence of high ionization lines such as [O IV] 25.9 and [Ne V] 24.3 in the IRS spectra (Figure 5) suggests that the mid-IR emission from the Spur arises either partially or entirely from radiative shock excitation. To model the spectra we utilized the Raymond & Cox (1985) numerical shock code to predict line emission from radiative shocks in the metal-rich ejecta of G292.0+1.8 . The version of the code that we used has been modified to handle the enormous cooling rates found in metal-rich plasmas. As noted in earlier studies of metal-rich shocks (Itoh 1981a, 1981b, 1986; Dopita, Binette & Tuohy 1984; Sutherland & Dopita 1995; Blair et al. 2000) the radiative cooling time behind a shock driven into supernova ejecta is much shorter than the recombination time behind a shock propagating into a normal abundance medium. As a result, the electrons radiate away their energy rapidly within a thin (1013-1014 cm) layer behind the shock, reducing the temperatures to 100 K before the plasma can fully recombine. Overall these properties mean that the lack of ionization equilibrium found even in radiative shocks in cosmic abundance gas is much more pronounced in metal-rich plasmas.
To model the line emission from G292.0+1.8 we created grids in shock parameter space, utilizing the same version of the Raymond-Cox shock code used by Blair et al. (2000) to model the optical and UV emission from the O-rich ejecta in N132D and E010272.3. That version of the code calculates the time steps behind the shock more carefully than the cosmic abundance version, providing more accurate predictions of the temperature, ionization state, and compression in metal-rich shocks. The modified code also includes a calculation of the charge exchange reaction O++ + O0 2 O+, necessary for accurate estimation of the oxygen ionization fractions.
4.1. INPUT PARAMETERS AND MODEL SETUP
We have combined both the fluxes of mid-IR emission lines (Table 2) and optical line fluxes measured in the Spur by WL06 to provide the best constraints on the physical conditions in the shocked ejecta. The optical slit position of WL06 runs E-W along the top of the Spur, nearly perpendicular to the IRS slit location in Spur Position 1 (Figure 1) of our Spitzer observations. From East to West, the optical slit runs first through low density S-rich ejecta (labeled Filament 1E by WL06) and then higher density O-rich ejecta (labeled Filament 1W by WL06). Filament 1W exhibits optical emission lines of O, Ne and S and matches the location of Spur Position 1. Thus, we focus our modeling efforts on the optical and mid-IR spectra of Spur Position 1/Filament 1W.
We constructed a grid of shock models assuming conservation of ram pressure ( = const.) between the radiatively shocked ejecta and the hot non-radiative plasma behind the reverse shock. To gauge the ram pressure we examined the density-sensitive optical ratio of [S II] 6716/6731 in the radiatively shocked ejecta. For Filament 1W, WL06 found a [S II] 6716/6731 ratio of 1.16, indicating that the bulk of the [S II] emission arises from the postshock region where 300 cm-3. On the other hand, they found that the temperature-sensitive ratio [O III] (4959 + 5007)/4363 is approximately 17 (indicating an average electron temperature 42,000 K and confirming that the [O III] emission is primarily shock excited). These two results limit the range of possible preshock densities and radiative shock speeds in the Spur, suggesting that preshock densities 0.5-10 cm-3 and shock speeds 20-200 km s-1 would be appropriate.
The main goals of comparing our model predictions to the Spitzer observations are to determine whether the X-ray derived abundances are allowed by the optical/IR data and to determine whether additional abundance constraints can be imposed from our IRS spectra. Park et al. (2004) measured mass ratios for O, Ne, Mg and Si in four different ejecta knots. Save for one ejecta feature in the NW (labeled ’Region 5’ in their paper), the ejecta abundances in the other three ejecta knots are roughly consistent with one another. We have averaged the mass ratios for these four knots (ratios from Table 2 of Park et al. 2004) to obtain an estimate of the relative abundances in the radiative shocks in the Spur. From these ratios we estimated input abundances (by number) as a starting point for our models, obtaining O:Ne:Mg:Si = 16.0:15.52:14.74:13.97. Park et al. (2002, 2004) noted that they did not detect clear X-ray emission from elements heavier than Si in the ejecta of G292.0+1.8 . Except for the S abundance, which can be constrained from the optical spectra of WL06, the abundances of heavier elements in the ejecta of G292.0+1.8 such as Ar, Ca and Fe, remain unknown. The absence of Ar lines ([Ar II] 6.99, [Ar III] 8.99) and Fe lines (such as [Fe II] 5.33, 25.99 and [Fe III] 17.9) in our IRS spectra indicates a very low concentration of these elements in the Spur. The optical spectra also show no emission from these metals. Similarly the abundance of carbon, a significant constituent of the ejecta, is unknown because the UV emission lines from C are inaccessible due to the high extinction. In the absence of constraints on the abundances of C, Ar, Ca and Fe, we excluded these elements from the shock models.
The dependence of the optical and mid-IR fluxes on shock speed and preshock density must be constrained as well. We normalized the ram pressure constraint =5000 cm-3 km2 s-2 by taking = 0.5 cm-3 at = 100 km s-1 . The corresponding ram pressure is approximately 1.510-9 dyn cm-2, comparable to the pressure of 5.910-9 dyn cm-2 estimated by Hughes et al. (2002) for an X-ray ejecta knot located just south of PSR J11245916 in G292.0+1.8 . With our ram pressure condition we ran a grid of shock models with intervals = (20,30,40,50,60,80,100,120,130,160,180,200) km s-1 and corresponding densities = (12.5, 5.5,3.1,2.0,1.4,0.8,0.50.35,0.25,0.2,0.15,0.13) cm-3.
A number of other parameters must be set in the models. We assumed photoionization equilibrium in the preshock gas, i.e., we self-consistently calculated the preshock ionization state of the ejecta by using the radiation output of the postshock gas. The degree of electron-ion temperature equilibration at the shock front is another free parameter. For our models, we set = 0.05. The models follow the rise in temperature behind the shock by Coulomb collisions and terminate the downstream calculation when the gas had cooled to 300 K.444Currently the Raymond-Cox shock code does not include molecular cooling, which can, in principle, be important for 1500 K. However, the postshock gas in O-rich shocks may cool rapidly enough to delay molecular formation until the gas reaches around 300 K. Finally, following Blair et al. (2000) we set the value of the magnetic parameter 0.1 G cm3/2.
Inspection of the model grid is instructive. For the adopted ejecta abundances and initial temperature equilibration the slowest shocks (40 km s-1 ) produce strong [Ne II] 12.8 and [Si II] 34.8 in the mid-IR, and [S II] 6716, 6731 emission in the optical. In these cases the FUV radiation leaking upstream from the postshock flow produces little preshock ionization. Even after the gas crosses the shock the electron temperature is not high enough in these slow shocks to ionize the gas far beyond the second ionization stage. This allows ions like Ne+, Si+ and S+ to survive throughout the shock. At higher shock speeds, collisional ionization becomes more efficient. The mid-IR line emission becomes less sensitive to the preshock ionization state of the gas. Emission from higher ionization stages dominates, with lines such as [Ne III] 15.5, 36.0 and [S IV] 10.5 reaching their peak around = 80 km s-1 and [O IV] 25.9 reaching a peak around 120 km s-1 . The fastest shocks (150 km s-1 ) are required to produce [Ne V] 24.3 emission.
4.2. COMPARISON OF MODELING RESULTS TO OBSERVATIONS
Judging by the IRS spectra of the Spur (Figures 3, 4 and 5; Table 2) a wide range in shock speeds is apparently needed to simultaneously make the [Ne II] 12.8 lines stronger than the [Ne III] 15.5 lines (implying 40 km s-1 ) and produce detectable [Ne V] 24.3 and [O IV] 25.9 lines. Following the treatment of Vancura et al. (1992) and Blair et al. (2000), we model the mid-IR line emission by summing fluxes from the shock model grid between 20 km s-1 and 200 km s-1 with a weighting term ( / 200)-α. The power law index is a free parameter which can be adjusted to provide the best match with observed flux ratios. Although does not have a rigorous physical definition, it may be interpreted as a measure of the preshock density distribution within the ejecta. A steep value of emphasizes the slowest shocks and may reflect a small range of density contrasts within a clump of ejecta. A shallower index, on the other hand, would allow greater flux contributions from the intermediate and fast shocks, possibly reflecting a wider range of density contrasts within the shocked ejecta. Fitting the emission line ratios are thus functions of both the relative abundances and power law index. We estimated by tracking relative fluxes from different ionization stages of the same element, here the [Ne II](12.8):[Ne III](15.5):[Ne V](24.3) and [O III](4959 + 5007)/[O III](4363) ratios, before then varying relative abundances.
We combined the grid of models described above using various values of . We found that = 2.5 best matched the Spur Positions 1 and 2 [Ne II](12.8):[Ne III](15.5):[Ne V](24.3) line ratios (Model A in Table 3). This index is considerably steeper than that obtained by Blair et al. (2000) in modeling the radiatively shocked O-rich ejecta in N132D ( = 0.4) and E010272.3 ( = 0.5). However, it is nearly identical to the index of 2.3 estimated by Vancura et al. (1992) in their analysis of UV spectra from shocked interstellar clouds in the SNR N49. As discussed above, the steep index strongly weights the emission from the slowest shocks, as necessary to produce [Ne II](12.8)/[Ne III](15.5) ratios exceeding unity.
The overall agreement between the =2.5 model grid and the observed optical and mid-IR flux ratios for Spur Position 1 is reasonable (Table 3). Given the similarity between the mid-IR line ratios of Positions 1 and 2, the models essentially match the spectra from both positions. The X-ray estimate of the O:Ne:Mg:Si ratios from Park et al. (2004) were able to match both the optical and mid-IR optical line ratios. Our models reproduce the optical line ratios of [S II] and [Ne III] relative to [O III] very well for Spur Position 1, and closely match the ratios of the brightest lines in the Spitzer bandpass [Ne II], [Ne III] and [O IV]. The modeled [Ne II](12.8)/[Ne III](15.5) ratio for Spur Position 2 is 20% smaller than the observed value. Other important ratios such as [Ne III](15.5)/[O IV](25.9) and [Ne III](15.5)/[Ne V](24.3) are more closely matched by the models, though they are underpredicted as well (15%). We found that by slightly steepening the index from 2.5 to 2.7 (i.e., by increasing the contribution from slower, denser shocks to the integrated mid-IR spectrum) we obtained [Ne II](12.8)/[Ne III](15.5)2.5, matching the observed value of 2.70.24 in Position 2, while making [Ne III](15.5)/[O IV](25.9)1.5, roughly consistent with the observed value of 1.350.12. There was minimal change in the other ratios. The steeper index for Position 2 is consistent with an ejecta distribution that is on average slightly denser and clumpier.
As can be seen in Table 3, there are also significant discrepancies between the observed and predicted optical ratios of [O III]/[O II] and [O III]/[O I] for Position 1. In Model A the former ratio is underpredicted by a factor of 2, while the latter is overpredicted by an order of magnitude. As noted by Itoh (1981a, 1986) and Blair et al. (2000) the difficulty in matching the [O I] optical fluxes is a well known shortcoming of existing models of radiative shocks in metal-rich ejecta. The difficulty is due to the fact that very little of the oxygen-rich gas behind the shock has recombined to O I before the postshock temperature drops below 1000 K. This problem may be partially solved by extending the range of shock speeds down to 10 km s-1 . This modification adds more [O I] emission, thereby reducing the [O III]/[O I] ratio as needed. However, it also significantly increases the [O II] emission, worsening the disagreement between the observed and modeled [O III]/[O II] ratios. Therefore, adding slower shocks does not entirely solve the line ratio problem. Additional steps such as increasing the assumed ratio at the shock front can further alleviate the problem (see Model B in Table 3). However, this creates disagreement with other line ratios such as [Ne II]/[Ne III] and [Ne III]/[O IV] in the mid-IR. Lastly, our models ignore the contribution of photoionized unshocked ejecta clumps to the optical and mid-IR spectra of the O-rich knots. Without a detailed calculation (beyond the scope of this paper) the contribution of such clumps to the spectra of O-rich knots in G292.0+1.8 is uncertain. Taken together, all these difficulties illustrate the sensitivity of the modeled spectra to the input shock parameters. They remind us that such parameters as the mass ratios of heavy elements, ejecta densities and range of shock speeds obtained from our models must be interpreted with caution.
As a consistency check we compared the surface brightness of [O IV] 25.9 predicted by Model A (Table 3) with the observationally determined value at Position 1 of the Spur. Summing the fluxes from the plane parallel models and using the power law weighting in velocity described above, we obtained a predicted [O IV] 25.9 flux of I25.9([O IV]) = 2.410-5 ergs cm-2 s-1 sr-1 , roughly twice the observed value (Table 2). Given our admittedly ad hoc use of a power law velocity distribution in calculating the total fluxes and the model uncertainties described above, we consider this to be a reasonable agreement between the modeled and observed [O IV] 25.9 surface brightnesses.
We have also compared the surface brightness of [O III] 5007 predicted by the models with the value observed in the optical by WL06. Using the surface brightness of Filament 1W quoted by WL06 and applying an extinction correction using the relations of Fitzpatrick (1999), we obtained a dereddened surface brightness 4.610-4 ergs cm-2 s-1 sr-1 . Assuming that this number is representative of the Spur emission sampled at Position 1 in our IRS spectra, we summed the emission from our plane parallel shock models assuming the power law velocity distribution and obtained a predicted surface brightness 1.610-3 ergs cm-2 s-1 sr-1 . This result is also larger than the observed value (by a factor 3). Some of this difference may be ascribed to an overestimate of the ejecta density by our model scaling, or it may be attributed to the uncertainty in extinction correction, which ranges from a factor of 6.7 to 17.9 over the range in = 0.6 to 0.9 (again assuming a Fitzpatrick (1999) extinction law). However, we consider the overall agreement between the observed and predicted [O III] fluxes to be reasonable.
Although sulfur line emission has not been detected from the ejecta of G292.0+1.8 at X-ray wavelengths (Park et al. 2002, 2004), we were able to estimate or place limits on the abundance of this element from our joint mid-IR/optical spectral analysis. Starting from the averaged relative abundances of O, Ne and Si obtained from Park et al. (2004), we progressively increased the S abundance in the models until we matched the observed [S II]/[O III] flux ratio in the optical. We obtained a S abundance of 14.0 dex, with higher values producing unacceptably high [S II]/[O III] ratios and resulting in enough collisional de-excitation of [S II] 6716 to reduce the [S II] 6716/6731 ratio below unity. However, one remaining discrepancy is that our models predict a [S III] 18.7 flux that exceeds the upper limit on emission from that line in both IRS spectra of the Spur (Model A in Table 3). The reason for the disagreement is unclear, but it could be ascribed to uncertainties in scaling between the optical and Spitzer apertures and the uncertain correction for strong photoionized [S III] along the IRS slit.
Turning to the abundances of magnesium and silicon, we find that the abundance of the former is unconstrained by our observations, since the [Mg V] 5.6 line is predicted by our models to lie nearly an order of magnitude below the detection threshold at all shock speeds. Therefore, we left the Mg abundance at the average X-ray value of 14.74. On the other hand, we were able to constrain the relative silicon abundance in the Spur under the assumption that the [Si II] 34.8 emission in the IRS spectra is produced by radiative shocks (rather than being the result of incomplete background subtraction). We increased the abundance of Si in our shock models (Model A) until we reached a Si abundance of 14.4 dex, above which the [Ne III] 15.5 / [Si II] 34.8 ratio dropped below the observed upper limit of 2.7 in Spur Position 1. Therefore, we estimate the upper limit on the Si abundance to be 14.4 in Position 1 of the Spur, corresponding to 23.
5. DISCUSSION
5.1. DUST EMISSION
The mid-IR spectrum of the radiatively shocked O-rich ejecta in G292.0+1.8 (e.g., the lower panel in Figure 5) exhibits a faint, localized bump of emission between 15 and 28 . This contrasts strongly with the situation in Cas A, where recent Spitzer IRS observations (Rho et al. 2008) have revealed continuum emission from the ejecta extending across the IRS bandpass. The 1923 continuum maps of Cas A obtained with IRS show a strong correlation between the spatial distribution of emitting dust and that of ejecta-line emission from [Ar II] 6.99, [Ne II] 12.8 and [O IV] 25.9. This strongly suggests that the dust observed in the mid-IR has condensed within the dense ejecta in Cas A (Rho et al. 2008). This clearly differs from the Spur in G292.0+1.8 , where, despite the presence of strong Ne and O line emission, the only feature resembling a continuum is the broad emission bump between 15 and 28 . Summing the emission under the bump and excluding emission lines, the surface brightness of the bump is 7.410-8 W m-2 sr-1. If we adopt the this value as a measure of the dust continuum in G292.0+1.8 , then we estimate a line to continuum ratio 1 in the mid-IR for the O-rich shocks in the Spur.
The efficiency of dust formation in supernova ejecta and the variables that control it are currently not well known. One source of uncertainty is the condensation efficiency of grains in the SN ejecta. While theoretical models based on classical nucleation theory predict that 0.1-0.3 M⊙ of dust forms per SN (Kozasa, Hasegawa, & Nomoto 1991; Todini & Ferrara 2001), infrared observations have turned up significantly lower dust mass estimates in the ejecta of observed SNe. For example, Sugerman et al. (2006) estimated that 0.02 of dust had formed in the ejecta of SN 2003gd (although even this low number has been disputed; see Meikle et al. 2007). The 0.02-0.05 M⊙ of dust inferred to exist in the radiatively shocked ejecta of Cas A lies closer to (but still falls short of) the theoretically predicted value. If the ejecta dust in Cas A and G292.0+1.8 are of comparable temperature and composition, then the lack of a broad-band dust continuum in the mid-IR spectra of the latter might reflect a lower condensation efficiency in that OSNR.
The lack of strong dust continuum observed in the Spur of G292.0+1.8 may be similar to what was observed by Tappe et al. (2006) in the O-rich ejecta of N132D in the Large Magellanic Cloud. Their IRS spectrum, which covered only the LL channel between 14 and 40 , exhibits strong [Ne III] 15.5 and [O IV] 25.9 lines, similar to the ejecta in G292.0+1.8 . There is broad-band continuum emission present in the N132D spectrum. However, given that Tappe et al. (2006) utilized background regions lying outside the shell of N132D and that the ejecta are located near the center of this OSNR, it is likely that the continuum emission detected in the ejecta spectrum of N132D is actually overlying dust continuum from shocked interstellar material along the line of sight. If this is correct, then the line to continuum ratio of the ejecta knot in N132D may be similar that of the Spur in G292.0+1.8 .
A further parallel may be drawn between N132D and G292.0+1.8 using the HST FOS observations of N132D by Blair et al. (2000). The optical and UV spectrum of the ejecta feature labeled N132D-P3 by Blair et al. (2000) was found to have mass ratios of 4.5 and 50. These are very similar to the values we derived for the Spur. Blair et al. (2000) found that a low ram pressure, with 1 cm-3 at = 100 km s-1 was needed to reproduce the UV and optical line ratios in the ejecta spectrum of N132D-P3, along with shock speeds in the range of 30 km s-1 to 160 km s-1 . These are again very similar to the conditions we found were needed to reproduce the mid-IR and optical spectra of the Spur, though the velocity index is only 0.4 in N132D, considerably less steep than the value of 2.5 found for the Spur. Altogether it appears likely that N132D and G292.0+1.8 are currently in similar stages of evolution, with the O-rich ejecta having expanded to relatively low density and the reverse shocks having penetrated mostly the outermost ejecta formed during the hydrostatic evolution of the progenitor.
5.2. THE ORIGIN OF THE 15-28 BUMP
In both spectra of the Spur (Figure 5) there is a broad feature that peaks near 17 , then declines until it disappears near 28 . The feature resembles o the 15-20 bump observed in the southeastern rim of N132D by Tappe et al. (2006; see Figure 6 in that paper). Tappe et al. (2006) attributed the bump to in- and out-of-plane bending modes of the PAH C-C-C molecule, and suggested that the PAH emission from the southeastern rim of N132D is generated by collisional excitation behind the blast wave. The smallest PAHs are preferentially destroyed behind the shock, leaving the largest molecules de-hydrogenated in the form of large (104) clusters of carbon atoms. Since the smaller PAHs are responsible for the emission at 6.2, 7.7, 8.7 and 11.3 , the destruction of these molecules leaves the observed strong enhancement in the 15-20 / 11.3 flux ratio (7) in N132D.
Recently Sandstrom et al. (2008) observed the OSNR E010272.3 with IRS and found a very similar emission bump in the spectrum of the radiatively shocked O-rich ejecta of that remnant. The bump in their spectrum extends out close to 30 , much like the feature detected in G292.0+1.8 . The bump is prominent in the same spectra of E010272.3 that show the same emission lines from the radiatively shocked ejecta of E010272.3 as we observe in G292.0+1.8 ([O IV], [Ne II], [Ne III] and [Ne V]). Instead of PAHs, Sandstrom et al. interpreted the bump as mid-IR emission arising from hot (180 K) forsterite dust (Mg2SiO4) created within the SN ejecta. Dust formation models (Nozawa et al. 2003) predict that Al2O3 and Mg2SiO4 should form within 450 days after the SN explosion in region containing C-burning products of the O-Mg-Si layer in the outer portions of the star. If this is correct explanation for the dust in the O-rich ejecta of G292.0+1.8 should reflect the composition of the C-burning (hydrostatic) layers of the progenitor star.
Which of these suggestions is more likely to apply to the feature seen in G292.0+1.8 ? Observationally, the shape of the bump in G292.0+1.8 resembles that of E010272.3 more than N132D. The bump in the Spur 2 spectrum is considerably broader, extending well beyond 20 . In contrast, the feature in the N132D spectrum is well confined between 15 and 20 . Furthermore, the sky-subtracted Spur 2 spectrum lacks the corresponding bending mode PAH features at 6.2, 7.7, 8.7 and 11.3 (the wavelength of the feature seen in the SL1 spectrum of Spur 2 is actually located at 10.5 (the wavelength of [S IV]) but is a statistically insignificant (1.5 detection). If the Spur 2 bump is produced by dehydrogenated PAHs, then the 15-20 / 11.3 ratio would have to be significantly larger (30) in G292.0+1.8 than in N132D. Such a large ratio may be be physically possible (if nearly all of the smaller PAH molecules have been destroyed behind the blast wave), but a more detailed theoretical calculation is beyond the scope of this paper.
From a more theoretical perspective, PAH emission is expected in situations where shocks encounter cold molecular gas since this is where they form. PAHs are a fairly plausible explanation in N132D, since the region surrounding N132D contains such a molecular cloud (Tappe et al. 2006). Clearly there is no such molecular material deep within G292.0+1.8 . Therefore, if the 15-28 feature observed in the Spur spectra (Figure 5) arises from the excitation of PAH molecules, it would have to originate in the circumstellar medium around G292.0+1.8 , which would probably only be feasible if the lines and dust emission arose from physically distinct regions. Thus an ejecta dust origin for the 15-28 bump in G292.0+1.8 is a much more appealing interpretation. However, it also must be reconciled with the absence of [Si II] 34.8 in spectra of the Spur (Table 1). A forsterite origin would require that most of the Si in the ejecta be depleted onto dust grains. In the case of E010272.3 (where there is similar lack of [Si II]) this requirement would be less stringent, due to the fact that E010272.3 is nearly 10 times farther away than G292.0+1.8 and the IRS observations of the former encompasses a significantly larger fraction of the O-rich ejecta there than in the latter. This would increase the possibility that the mid-IR line emission and forsterite dust emission in E010272.3 arise from different locations, and may relax the requirement of Si dust depletion in that OSNR.
6. SUMMARY
We have presented the first mid-infrared spectra of shocked O-rich ejecta in the Galactic SNR G292.0+1.8 . These observations were obtained with the IRS spectrograph on Spitzer and targeted the prominent structure known as ‘the Spur’ on the eastern side of G292.0+1.8 . The only emission lines detected with certainty from the ejecta in the 540 range are those of oxygen ([O IV] 25.9) and neon ([Ne II] 12.8, [Ne III] 15.5, 36.0 and [Ne V] 24.3). While the IRS spectra of the Spur do not show the featureless continuum often associated with dust emission, it does show a broad emission bump localized between 15 and 28 . This feature may be produced by either emission from dehydrogenated PAHs heated in the forward shock of G292.0+1.8 , or it may be produced by Al2O3 or Mg2SiO4 (forsterite) dust grains in the radiatively shocked O-rich ejecta. It is similar to the bump seen recently in IRS spectra of radiatively shocked ejecta in E010272.3 (Sandstrom et al. 2008).
Guided by a range of observed line ratios sensitive to temperature, density, and relative abundances, we were able to constrain physical conditions in the Spur using a grid of radiative shock models. We calculated the spectra for radiative shocks with a range of speeds and preshock densities subject to constant ram pressure constraints. We then weighted the output fluxes with a power law in shock speed to account for the range of density contrasts and shock speeds within the Spur. We found that shock speeds in the range 20200 km s-1 , a power law index of 2.5 (preferentially weighting the slowest shocks) and corresponding densities in the range 0.112.5 cm-3 were needed to produce the range of low and high ionization emission lines observed in the optical and mid-IR. Furthermore, we found that simply by using average relative O:Ne:Si abundances obtained from Chandra spectroscopy of a handful of non-radiative ejecta knots by Park et al. (2004) we were able to obtain good overall matches between our shock models and the observed mid-IR and optical line ratios. In the case of sulfur, which has not been clearly detected in the X-rays, we were able to use the observed optical [S II] 6716, 6731 emission and the lack of [S IV] 10.5 emission in the Spitzer data to estimate its abundance. Our results are O:Ne:Si:S = (16:15.52:13.97:14.2), with an upper limit of 14.3 on the silicon abundance. These correspond to 3, 61 (limit 23) and 50. While these numbers are in broad agreement with those determined from X-ray observations, they were obtained from shock models which ignore the contribution of photoionized, unshocked ejecta to the optical and mid-IR emission in G292.0+1.8 . More detailed and realistic models will be required to refine these estimates.
In addition to the radiative shocks in the O-rich ejecta, we have also detected mid-IR continuum emission from the circumstellar belt observed in Chandra X-ray images of G292.0+1.8 (Park et al. 2002; 2004). X-ray analyses of the belt have indicated that it has abundances consistent with cosmic composition and point to excitation of circumstellar material in non-radiative shocks. The mid-IR continuum from the belt peaks at 20 and can be fit with a two-temperature dust model, with 114 K and 35 K. The corresponding masses in the two components are 1.710-3 and 3.1 , respectively, which we suggest are due to collisional heating of grains behind non-radiative shocks in the belt (hot component) and the heating of preshock grains by FUV radiation from the radiative precursor in the belt (cold component). The continuum is equally well fit with either a pure 0.1 silicate or a Milky Way (Weingartner & Draine 2001) dust model.
This work is based on observations made with the Spitzer Space Telescope, which is operated by the Jet Propulsion Laboratory, California Institute of Technology under a contract with NASA. Support for the work of P. G. was supported by NASA through the Spitzer Guest Observer Program.
References
- (1)
- (2) Allamandola, L, J., Tielens, A. G. G. M., & Barker, J. R. 1989, ApJS, 71, 733
- (3)
- (4) Bianchi, S., & Schneider, R. 2007, MNRAS, 378, 973
- (5)
- (6) Blair, W. P., et al. 2000, ApJ, 537, 667
- (7)
- (8) Blair, W. P., et al. 2007, ApJ, 662, 998
- (9)
- (10) Braun, R., Goss, W. M., Caswell, J. L., & Roger, R. S. 1986, A&A, 162, 259
- (11)
- (12) Camilo, F., et al. 2002, ApJ, 567, L71
- (13)
- (14) Chevalier, R. A., & Kirshner, R. P. 1978, ApJ, 219, 931
- (15)
- (16) ———–, ApJ, 233, 154
- (17)
- (18) Chevalier, R. A. 2005, ApJ, 619, 839
- (19)
- (20) Dopita, M. A., Tuohy, I. R. & Mathewson, D. S., ApJ, 248, L105
- (21)
- (22) Dopita, M. A., Binette, L., & Tuohy, I. R. 1984, ApJ, 282, 142
- (23)
- (24) Dwek, E. 1987, ApJ, 322, 812
- (25)
- (26) Dwek, E., Foster, S. M. & Vancura, O. 1996, ApJ, 457, 244
- (27)
- (28) Ennis, J., et al. 2005, ApJ, 652, 376
- (29)
- (30) Fitzpatrick, E. L. 1999, PASP, 111, 63
- (31)
- (32) Gaensler, B. M., & Wallace, B. J. 2003, ApJ, 594, 326
- (33)
- (34) Ghavamian, P., Hughes, J. P., & Williams, T. B. 2005, ApJ, 635, 365
- (35)
- (36) Goss, W. M., Shaver, P. A., Zealey, W. J. Murdin, P., & Clark, D. H. 1979, MNRAS, 188, 357
- (37)
- (38) Hendrick, S. P., Reynolds, S. P., & Borkowski, K. J. 2005, ApJ, 622 L117
- (39)
- (40) Higdon, S. J. U., et al. 2004, PASP, 116, 975
- (41)
- (42) Houck, J. R., et al. 2004, ApJS, 154, 18
- (43)
- (44) Itoh, H. 1981, PASJ, 33, 1
- (45)
- (46) —- 1981, PASJ, 33, 521
- (47)
- (48) —- 1986, PASJ, 38, 717
- (49)
- (50) Kirshner, R. P. & Blair, W. P. 1980, ApJ, 236, 135
- (51)
- (52) Kirshner, R. P., Morse, J. A., Winkler, P. F. & Blair, W. P. 1989, ApJ, 342, 260
- (53)
- (54) Kozasa, T., Hasegawa, H., & Nomoto, K. 1991, å, 249, 474
- (55)
- (56) Lasker, B. M. 1978, ApJ, 223, 109
- (57)
- (58) ———–, 1980, ApJ, 237, 765
- (59)
- (60) Li, A., & Draine, B. T. 2001, ApJ, 554, 778
- (61)
- (62) Meikle, W. P. S., et al. 2007, ApJ, 665, 608
- (63)
- (64) Milisavljevic, D., & Fesen, R. 2008, ApJ, 677, 306
- (65)
- (66) Minkowski, R., 1957, IAU Symp. No. 4, Cambridge Univ. Press, p. 107
- (67)
- (68) Morse, J. A., Winkler, P. F. & Winkler, AJ, 109, 2104
- (69)
- (70) Morse, J. A., et al. AJ, 112, 509
- (71)
- (72) Murdin, P., & Clark, D. H. 1979, MNRAS 189, 501
- (73)
- (74) Nozawa, T., Kozasa, T., Umeda, H., Maeda, K. & Nomoto, K. 2003, ApJ, 598, 785
- (75)
- (76) Park, S., et al. 2002, ApJ, 564, L39
- (77)
- (78) Park, S., et al. 2003, ApJ, 598, L95
- (79)
- (80) Park, S., et al. 2004, ApJ 602, L33
- (81)
- (82) Park, S., et al. 2007, ApJ 670, L121
- (83)
- (84) Peeters, E., Mattioda, A. L, Hudgins, D. M., & Allamandola, L. J. 2004, ApJ, 617, L65
- (85)
- (86) Reach, W. T., et al. 2006, AJ, 131, 1479
- (87)
- (88) Reach, W. T., Rho, J., & Jarrett, T. H., ApJ, 618. 297
- (89)
- (90) Rho, J. H., et al. 2008, ApJ, 673, 271
- (91)
- (92) Sandstrom, K., Bolatto, A. D., Stanimirovic, S., van Loon, J., & Smith, J. D. 2008, ApJ, submitted (astroph/0810.2803)
- (93)
- (94) Serafimovich, N. I., Lundqvist, P., Shibanov, Yu. A., & Sollerman , J. 2005, AdSpR, 35, 1106
- (95)
- (96) Smith, J. D. T., et al. 2008, ApJ, submitted (astroph/0810.3014)
- (97)
- (98) Stanimirovic, S., et al. 2005, ApJ, 532, L103
- (99)
- (100) Sugerman, B. S., et al. 2006, Science, 313, 196
- (101)
- (102) Sutherland, R. S., & Dopita, M. A. 1995, ApJ, 439, 365
- (103)
- (104) Tappe, A., Rho, J., & Reach, W. T. 2006, ApJ, 653, 267
- (105)
- (106) Tielens, A. G. G. M., & Hollenbach, D. 1985, ApJ, 291, 722
- (107)
- (108) Todini, P., & Ferrara, A. 2001, MNRAS, 325, 726
- (109)
- (110) Tuohy, I. R., Burton, W. M. & Clark, D. H. 1982, ApJ, 260, L65
- (111)
- (112) Vancura, O., Raymond, J. C., Dwek, E., Blair, W. P., Long, K. S. & Foster, S. 1994, ApJ, 431, 188
- (113)
- (114) Van Kerckhoven, C., et al. 2000, A&A, 357, 1013
- (115)
- (116) Weingartner, J. C., & Draine, B. T. 2001, ApJ, 548, 296
- (117)
- (118) Williams, B. J., et al. 2006, ApJ, 652, L33
- (119)
- (120) Winkler, P. F. & Kirshner, R. P. 1985, ApJ, 299, 981
- (121)
- (122) Winkler, P. F., & Long, K. S. 2006, AJ, 132, 360 [WL06]
- (123)
| Position | AORaaAstronomical Observation Request ID | PA(°) (SL) | SL Exp. Time (s) | PA(°) (LL) | LL Exp. Time (s) | Obs. Date | |||
|---|---|---|---|---|---|---|---|---|---|
| Position 1 | 11254016 | 59° 15′ 451 | 266.6 | 5240 | 183.0 | 5120 | 2005 Mar 24 | ||
| Position 2 | 11254272 | 59° 16′ 109 | 266.6 | 5240 | 183.0 | 5120 | 2005 Mar 24 |
| Line ID | Wavelength () | Surf. Br. (10-8 W m-2 sr-1)aaEquivalent to surface brightness in units of 10-5 ergs cm-2 s-1 sr-1 | (km s-1) | ||||
|---|---|---|---|---|---|---|---|
| Position 1 | |||||||
| [S IV] | 10.5 | 0.25 | |||||
| [Ne II] | 12.8 | 3.550.07 | +373 | ||||
| [Ne III] | 15.6 | 1.70.09 | +300 | ||||
| [S III] | 18.7 | 0.15bbThese lines are most likely residuals from incomplete sky subtraction, so the fluxes quoted here are upper limits on the flux from the radiatively shocked ejecta. | 51 | ||||
| [Ne V] | 24.4 | 0.120.01 | +43 | ||||
| [O IV] | 25.9 | 1.240.02 | 51 | ||||
| [S III] | 33.6 | 0.2bbThese lines are most likely residuals from incomplete sky subtraction, so the fluxes quoted here are upper limits on the flux from the radiatively shocked ejecta. | +106 | ||||
| [Si II] | 34.8 | 0.63bbThese lines are most likely residuals from incomplete sky subtraction, so the fluxes quoted here are upper limits on the flux from the radiatively shocked ejecta. | +117 | ||||
| [Ne III] | 36.0 | 0.230.05 | +385 | ||||
| Position 2 | |||||||
| [S IV] | 10.5 | 0.68 | |||||
| [Ne II] | 12.8 | 4.210.14 | +290 | ||||
| [Ne III] | 15.6 | 1.550.13 | +31 | ||||
| [S III] | 18.7 | 0.21bbThese lines are most likely residuals from incomplete sky subtraction, so the fluxes quoted here are upper limits on the flux from the radiatively shocked ejecta. | 33 | ||||
| [Ne V] | 24.4 | 0.110.01 | 285 | ||||
| [O IV] | 25.9 | 1.140.04 | +11.5 | ||||
| [S III] | 33.6 | 0.2bbThese lines are most likely residuals from incomplete sky subtraction, so the fluxes quoted here are upper limits on the flux from the radiatively shocked ejecta. | +168 | ||||
| [Si II] | 34.8 | 0.26bbThese lines are most likely residuals from incomplete sky subtraction, so the fluxes quoted here are upper limits on the flux from the radiatively shocked ejecta. | +573 | ||||
| [Ne III] | 36.0 | 0.1 |
| Line Ratio | Position 1 | Position 2 | Model AaaModel parameters are preshock density = 0.5 cm-3 at shock velocity = 100 km s-1 , with = constant; 0.1, abundances in dex are O = 16.00, Ne = 15.52, Mg = 14.74, Si = 13.97 and S = 14.0. Fluxes from plane parallel shock models are combined with a power law weighting factor as (/200)-α, where we have assumed 2.5. The range of shock velocities in the models is 20 200 km s-1 , and = 0.05 is assumed at the shock front. The Mg abundance is set to the averaged value determined from X-ray observations and is not actually constrained by the optical/IR spectra. | Model BbbModel B parameters are same as Model A, but with = 0.4, = 0.85, and shock velocities in the range 10 130 km s-1 . | |||
|---|---|---|---|---|---|---|---|
| Mid-IR | |||||||
| Ne II(12.8)/Ne III(15.5) | 2.10.1 | 2.70.24 | 2.2 | 0.4 | |||
| Ne III(15.5)/Ne V(24.3) | 14.11.4 | 14.11.74 | 11.8 | 11.7 | |||
| S IV(10.5)/Ne II(12.8) | 0.07 | 0.16 | 0.04 | 0.23 | |||
| Ne III(15.5)/O IV(25.9) | 1.330.08 | 1.350.12 | 1.3 | 0.7 | |||
| Ne III(15.5)/Si II(34.8) | 2.7 | 6.0 | 11.1 | 4.1 | |||
| S III(18.7)/Ne III(15.5) | 0.09 | 0.14 | 0.22 | 0.05 | |||
| OpticalccOptical line ratios for Spur 1 are those of Filament 1 W from the optical spectroscopy of WL06. Ratios are quoted for 0.6 as estimated by WL06. | |||||||
| O III(4959+5007)/O II(3727+3729) | 0.44 | 0.23 | 0.77 | ||||
| O III(4959+5007)/O II(7325) | 16.7 | 4.55 | 19.5 | ||||
| O III(4959+5007)/O I(6300+6363) | 13.1 | 149.2 | 4.9 | ||||
| O III(4959+5007)/O III(4363) | 17.0 | 18.7 | 20.0 | ||||
| S II(6716+6731)/O III(4959+5007) | 0.13 | 0.13 | 0.16 | ||||
| Ne III(3869)/O III(4959+5007) | 0.14 | 0.14 | 0.13 | ||||
| S II(6716)/S II(6731) | 1.16 | 1.2 | 1.3 |