CO interferometry of gas-rich spiral galaxies in the outskirts of an intermediate redshift cluster
Abstract
We present IRAM Plateau de Bure Interferometer 3 mm observations of CO J(10) emission in two 24m-selected starburst galaxies in the outskirts (2–3) of the rich cluster Cl 0024+16 (). The galaxies’ inferred far-infrared luminosities place them in the luminous infrared galaxy class (LIRGs, ), with star formation rates of 60 yr-1. Strong CO J(10) emission is detected in both galaxies, and we use the CO line luminosity to estimate the mass of cold molecular gas, . Assuming , we estimate – for the two galaxies. We estimate the galaxies’ dynamical masses from their CO line-widths, –, implying large cold gas fractions in the galaxies’ central regions. At their current rates they will complete the assembly of and double their stellar mass within as little as 150 Myr. If these galaxies are destined to evolve into S0s, then the short time-scale for stellar mass assembly implies that their major episode of bulge growth occurs while they are still in the cluster outskirts, long before they reach the core regions. Subsequent fading of the disc component relative to the stellar bulge after the gas reservoirs have been exhausted could complete the transformation of spiral-to-S0.
keywords:
clusters: galaxies, clusters: individual: Cl 0024+16, galaxies: starburst, evolution| Target | SFR | ||||||||
| (h m s) | ( ′ ′′) | () | ( yr-1) | (km s-1) | (km s-1) | (1010 K km s-1 pc2) | () | ||
| MIPS J002621.7 | 00 26 21.7 | +17 19 26.4 | 0.3803 | 14413 | |||||
| MIPS J002721.0 | 00 27 21.1 | +16 59 49.9 | 0.3964 | 15834 | , | ||||
| Offset from [O ii] line. MIPS J002721.0 is best fit with a double Gaussian, and we quote the offsets of both peaks. The uncertainty is 30 km s-1. | |||||||||
| Assuming a CO luminosity to total gas mass conversion factor of | |||||||||
1 Introduction
One key requirement for a starburst is the presence of a reservoir of dense, cold gas that can be efficiently converted to stars. For galaxies entering rich clusters this is especially important, because they are expected to be affected by mechanisms that can remove cold gas from the haloes and discs of infalling galaxies (e.g. ram-pressure stripping, Gunn & Gott 1972) or prevent further cooling of gas within galaxies’ dark matter halos (starvation or strangulation, e.g. Larson, Tinsley & Caldwell 1980; Bekki, Couch & Shioya 2002). This environmental dependence has a profound influence on cluster galaxies’ evolutionary histories, the net effect of which is the eventual termination of star formation (there is virtually no residual star formation in the cores of local clusters). The observational evidence for the gradual truncation of star formation in clusters is the conspicuous disappearance of star-forming disc galaxies in the cores of rich clusters since . It has been proposed that the spiral galaxies in distant clusters must be transforming into passive lenticular (S0) galaxies, since the fraction of S0s in rich clusters is believed to increase at the same time that the spirals begin to vanish (Dressler et al. 1997). However, the detailed nature of the physics controlling this evolution is still poorly understood. For example, what process is responsible for the transformation of the bulge-to-disc ratio of the spiral population? (Kodama & Smail 2001).
A growing body of observational evidence suggests that distant clusters contain significant populations of dust obscured starburst galaxies in their peripheral regions (e.g. Duc et al. 2000; Biviano et al. 2004; Coia et al. 2004; Geach et al. 2006; Marcillac et al. 2007; Bai et al. 2007; Dressler et al. 2008; Koyama et al. 2008; Fadda et al. 2008). Geach et al. (2009) proposed that the population of luminous infrared galaxies (LIRGs) residing in the ‘infall’ population of clusters could be examples of spiral galaxies undergoing an episode of bulge growth via circumnuclear starburst, and therefore excellent candidates for the progenitors of local massive S0s. Geach et al. (2009) estimate that, given the cluster LIRGs’ current SFRs, 10 of stars could be built up within a few 100 Myr. Although this simple model suggests that these galaxies could evolve onto the bright end of the local cluster S0 luminosity function by , we still lack crucial observational constraints, such as the likely duration of the starburst, where it occurs in the cluster, and limits on the final stellar mass of the bulge.
In this Letter we refine our model by asking a simple question: what is the mass of the cold molecular gas reservoir in these starbursts? Using the IRAM Plateau de Bure Interferometer we have conducted a pilot study of the cold gas properties of two dusty starburst galaxies in the distant cluster Cl 0024+16. The initial results are presented here. Throughout we assume in units of 100 km s-1 Mpc-1, and . The projected scale at in this model is 5.3 kpc/′′, and the luminosity distance is Mpc.
2 Observations
The two galaxies chosen for this pilot study were selected as two of the brightest in our Spitzer Space Telescope InfraRed Spectrograph (IRS) survey of 24m-selected members of Cl 0024+16 (). Full details of the mid-infrared observations can be found in Geach et al. (2006 & 2009). Both galaxies have mJy, and implied far-infrared luminosities ; they are in the LIRG class. The far-infrared luminosity is estimated from the luminosity of the 7.7m polycyclic aromatic hydrocarbon (PAH) emission line, extrapolating from the tight correlation between PAH strength and total infrared luminosity observed in local star forming galaxies (Smith et al. 2007; Geach et al. 2009). Both galaxies are in the outskirts, or infall region, of the cluster: they large clustocentric radius, and , where is the virial radius, Mpc (Treu et al. 2003). Further details of the two galaxies is provided in Table 1.
The observations were conducted using the IRAM Plateau de Bure Interferometer on 31 July 2008 (MIPS J002621.7) and 25 August 2008 (MIPS J002721.0) as part of program S035. The exposure times were 9.5 hr and 8.2 hr for each source respectively using 5 antennae. The observing conditions were excellent in terms of atmospheric phase stability, however any anomalous and high phase-noise visibilities were flagged. Data were calibrated, mapped and analysed using the IRAM gildas software (Guilloteau & Lucas 2000). Phase and flux calibration was performed using 3C454.3 and 0007+106. Secondary flux calibrators also included the sources MWC349, 3C454.3, 0119+115, 3C84, 2145+067. We targeted the CO(1–0) 115.27 GHz rotational transition, which at is redshifted into the 3 mm band, with GHz. The central frequency of the 3 mm receiver was set to the frequency of the redshifted CO(1–0) line at the systemic redshift of each galaxy derived from optical spectroscopy (Table 1). The correlator was set-up with 2.5 MHz spacing (264 channels, 320 MHz bandwidth) to comfortably cover the CO line should it be offset from the systemic redshift, and to take into account a broad velocity profile. The noise per 18 km s-1 channel for the two observations is 1.4 mJy beam-1 and 1.3 mJy beam-1.
3 Results & Discussions
3.1 CO(1–0) line luminosity and H2 gas mass
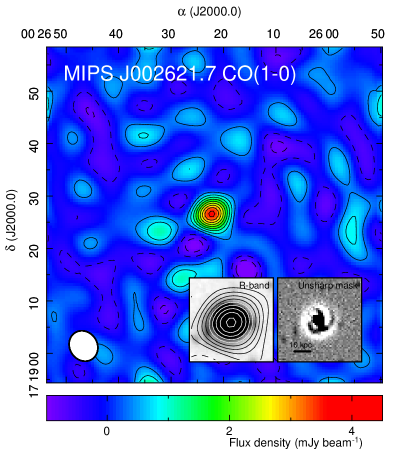
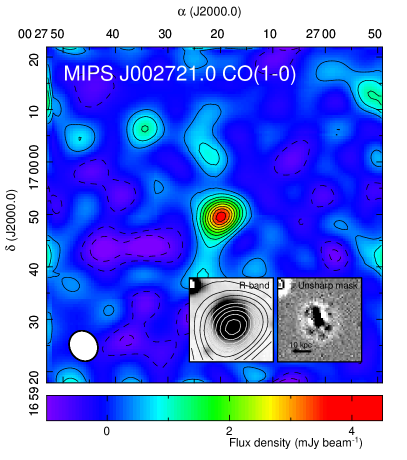
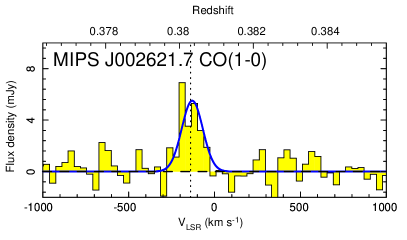
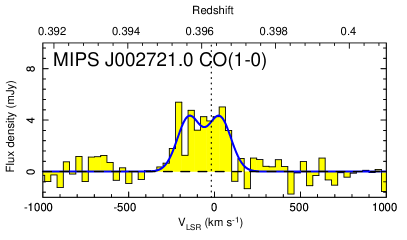
We detect CO(1–0) emission in both galaxies with significances of and respectively. Note that these observations represent the highest redshift CO detection in un-lensed LIRGs yet achieved (see Melchior & Combes 2008). In Figure 1 we present velocity integrated emission maps, and the spectra extracted from the peak pixel of these are shown in Figure 2. We estimate the line luminosities by fitting the spectra with Gaussian profiles, although in the case of MIPS J002721.0, the broad line is better fit with a double Gaussian (there is a marginal improvement on the fit). We discuss the physical interpretation of the line profiles in §3.2.
We calculate (in the usual units of K km s-1 pc2) from the integrated line emission according to e.g. Solomon & Vanden Bout (2005): . The line luminosities are given in Table 1 with 1- errors estimated by repeatedly re-evaluating the line fits after adding noise to the spectra. The ‘noise’ is randomly drawn from a Gaussian distribution with a width equivalent to the variance in the data sampled in the extreme wings ( km s-1) of the line. We take the standard deviation in the resulting values from 1000 of these ‘bootstrap’ realisations as the 1 uncertainty in the measured value.
It is assumed that the CO luminosity linearly traces the molecular gas mass: (e.g. Young & Scoville 1991; Solomon & Vanden Bout 2005) with the conversion factor typically taken as either for ‘normal’ spirals (the Galactic conversion factor), or for ultraluminous infrared galaxies (ULIRGs, ). The cluster starbursts are not quite in the ULIRG class, but are at the extreme end of what would be considered a ‘normal’ IR-bright galaxy (see Gao & Solomon 2004). We therefore adopt the more conservative ULIRG conversion when estimating the H2 gas mass (Table 1), and we discuss the implications of this in §3.4. In this sense, the estimated H2 masses could be considered lower limits.
3.2 Morphology, geometry & dynamics
Deep, high-resolution (FWHM0.8′′) optical imaging of these galaxies (Fig. 1, inset) allows us to constrain their orientation111Unfortunately both galaxies are outside the sparse HST WFPC2 mosaic of this cluster (Treu et al. 2003). MIPS J002621.7 appears to be nearly face-on to the line of sight, with a bright core and distinctive arms. MIPS J002721.0 is slightly more complicated; an un-sharp masked R-band image reveals a ring of bright knots and a bright core or bar that appears to be slightly extended to the north-east. It could also be orientated close to face-on.
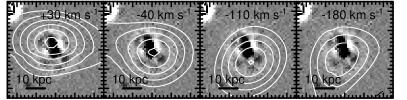
The CO(1–0) spectrum for MIPS J002721.0 exhibits a double peaked line profile (Fig. 2), and we show in Figure 3 that the peak of the CO emission traced by this velocity shear describes a locus that runs 10 kpc across the direction of the extended optical emission. This could be interpreted as a rotating disc, with an angular separation between the velocity peaks of or kpc. Note that the peak of the CO emission at the [O ii] redshift is centred on the bright central core. An alternative situation is that this galaxy is in the process of a merger along the line-of-sight, and the CO(1–0) emission profile originates from emission from two gas-rich clumps.
Finally, we can use the CO line widths to estimate the galaxies’ dynamical masses. For a rotating disc of radius , the dynamical mass enclosed within is (Neri et al. 2003). One way of estimating the likely size of the molecular disc is to force these galaxies to fall on the global Schmidt-Kennicutt relation, connecting star formation surface density to the gas surface density: (Schmidt 1959; Kennicutt 1998). Assuming the gas masses and SFRs given in Table 1, this implies discs of radius 0.4 kpc and 1 kpc for MIPS J002621.7 and MIPS J002721.0 respectively. These values are not unreasonable, given that observations of local LIRGs indicate large concentrations of gas in their inner few kpc (Sanders & Mirabel 1996). However, clearly the latter value is at odds with the 10 kpc separation of the velocity peaks in MIPS J002721.0, and of course, these radii would further increase if we had adopted a higher CO-to-H2 mass conversion. Assuming for MIPS J002621.7, we find . This ignores the systematic uncertainty on the inclination angle, which would clearly affect these mass estimates. The orientation of MIPS J002721.0 is similarly uncertain – it could be a face-on merger, or an inclined disc. Assuming it is a disc of radius 5 kpc, with (appropriate for a random orientation), this yields . In a merger model this estimate would increase by a factor 2 (Neri et al. 2003; Genzel et al. 2003).
3.3 Star formation efficiency & timescales
If we assume that the far-infrared luminosity is dominated by dusty star-formation, then the star formation efficiency can be represented by . For these galaxies, we have and . This is in the range observed in local () spirals, which have (Solomon & Vanden Bout 2005). In contrast, much larger values of are observed in ULIRGs and SMGs over a wide range of redshift () implying higher SFEs, perhaps driven by more violent mergers and interactions (Downes, Solomon, & Radford 1993; Tacconi et al. 2008; Coppin et al. 2008).
Recently, Daddi et al. (2008) have presented evidence for similar ‘low-efficiency’ star formation in two BzK-selected galaxies at . Those authors argue that while the most luminous galaxies such as ULIRGs and SMGs are indeed special cases of intense, high-efficiency star-formation, the general case could be a less efficient (yet still vigorous) mode of star-formation fuelled by a large reservoir of gas. Unfortunately a lack of CO observations of LIRGs at intermediate redshift makes such comparisons challenging. More extensive surveys in the ALMA era will no-doubt dramatically improve our understanding of this issue.
Given our measured gas mass, we can estimate the gas depletion timescale from the galaxies’ current SFRs (Table 1). Assuming the activity continues at the observed rate, and that all the gas is converted to stars, the lifetime of the starbursts are 100 Myr and 160 Myr for MIPS J002621.7 and MIPS J002721.0 respectively. Note that this is much shorter than the time it takes for a galaxy on a radial orbit to traverse the distance from the outskirts of the cluster to the core, which is of order 2–5 Gyr for Cl 0024+16 (Treu et al. 2003). The implication of these short time-scales is that self-exhaustion of the gas-reservoirs dominates these galaxies’ star formation histories. Moreover it is only the environment within a few 100 kpc of the cluster core that can ram-pressure strip the disc gas (and thus truncate star formation). The major episode of star-formation for these very active galaxies will be long-since over by the time the galaxies reach the core. Note that this may not be true of the ‘general’ star forming population, where lower SFRs mean that gas is not exhausted in such a dramatic way, and allows star-formation in less active systems to endure further into the cluster environment (e.g. Moran et al. 2007).
3.4 Ordinary, extraordinary or somewhere in-between?
We have treated these galaxies as ULIRGs in terms of H2 mass estimation, but how would our conclusions change if we applied the Galactic conversion of ? The obvious implication is that our derived gas masses would increase by a factor 6, and so the galaxies’ descendants could have stellar masses of order 10. If the majority of this additional mass is built in the bulge region, then this further supports a model where spiral galaxies in distant clusters can evolve into some of the most massive S0 galaxies in the cores of local clusters. The longer gas-depletion timescales (500 Myr and 900 Myr) are still shorter than the time it takes the galaxies to reach the virial radius in Cl 0024+16; our conclusion that the majority of the bulge growth occurs in the outskirts of the cluster still holds.
These galaxies are clearly different in nature to the Milky Way – they are forming stars at 15 the Galactic rate for example. Although these galaxies are not as extreme as ULIRGs, it is likely that their mode of star formation is more similar to ULIRGs than the ‘quiescent’ mode of star formation that occurs in the discs of local spirals. It could be driven by a circumnuclear mode where cold gas is being funnelled into the central regions for example. Taking this into account, we assume that the ULIRG conversion factor is most appropriate here.
3.5 The cluster environment and the starbursts’ fate
This pilot study is not extensive enough to make strong conclusions about the potential role of the cluster environment on the gas properties of these galaxies; a more complete survey is needed. However we can make some comments about the possible mechanisms that might be operating, the likely fate of these galaxies, and the implications this has for models of galaxy evolution in rich clusters.
At their large clustocentric radii, these galaxies are not affected by ram-pressure stripping (although weak pressure of the ICM on the discs of the galaxies could promote star formation in the disc; see Bekki & Couch 2003 and the discussion in Geach et al. 2009). Loosely bound gas in the halos of the galaxies could be gradually removed (Moran et al. 2007), but the additional mass such a reservoir could supply in the short-term is probably insignificant compared to the large masses already in the discs and cores. So, provided the molecular reservoirs are securely bound to the galaxy, the cold gas mass we measure now is likely to contribute to their final stellar masses. Their current stellar masses (estimated from their -band luminosities, see Geach et al. 2009) are likely to be in the range –, implying that the current episode of star formation could double their stellar mass (if the bursts are half-way through their lifetime). Assuming most of the current star formation occurs in the central regions, then relative fading of the disc component compared to the maturing bulge will contribute to the morphological transformation necessary for them to evolve into a massive S0 (Kodama & Smail 2001).
These galaxies appear to be undergoing significant evolution in the outskirts of the cluster, with their activity potentially driven by mergers and interactions. So how important is the central cluster environment in transforming spirals to S0s, and maintaining the evolution of the morphology-density relationship? Our observations suggest that the cluster environment is not required to terminate star formation in the progenitors of S0s; the key environmental effect might be more subtle. One can speculate on the likely processes that the galaxies will experience as they are virialised (long after they have used up their gas). First, the lack of accretion of additional gas from a cooling halo will prevent additional star formation. It is unlikely that the galaxies will experience further mergers, and so they cannot acquire cold gas that way; all that remains is morphological transformation. If the galaxies are on radial orbits, then high speed passes in the cluster potential and close encounters could promote tidal disruptions or even removal of any remaining spiral disc (Moore, Lake & Katz 1998; Gnedin 2003), completing the transformation to S0.
4 Summary
We have presented new IRAM CO detections of two LIRGs in the outskirts of the rich cluster Cl 0024+16 at . From the CO(1–0) line luminosities, we measure H2 gas masses of and in the two galaxies. This assumes a conversion between CO luminosity and H2 mass that is applied in ULIRGs; if we adopt the Galactic conversion factor, these estimates would increase by a factor 6. The infrared-derived SFRs are 60 yr-1, and so they will exhaust their reservoirs in as little as 150 Myr.
Our observations hint that dusty starbursts in the outskirts of Cl 0024+16 can assemble of stellar mass long before they reach the cluster core, implying that the cluster environment is unlikely to have a significant influence on the burst. However, it is interesting to note that one of the galaxies shows evidence of dynamic disturbance, potentially linked to a merger. If the galaxies are destined to evolve into S0s, then the main transformation required after the gas reservoirs have been exhausted is fading of the disc relative to the bulge. Potentially this could be accompanied by some morphological disturbance when the galaxies reach the high density core.
On a final note, we highlight the fact that if the critical epoch of star formation occurs 1–2 Gyr before the galaxies reach the virial radius, and these starbursts are feeding the local S0 population, then there should be a sizable population of post-starburst (k+a) galaxies at in rich clusters at –0.3 (Couch & Sharples 1987). Detection of such an ‘intermediate’ population would be a key piece of evidence in the model where starbursts triggered early during cluster infall at high-redshift are rapidly exhausting their gas reservoirs and sinking to the bottom of the cluster potential well where they are destined to complete their evolution into local massive S0s.
We warmly thank Roberto Neri and Philippe Salomé at IRAM for their assistance in obtaining and reducing this data. We also thank Mark Swinbank for helpful comments. This work is based on observations carried out with the IRAM PdBI. IRAM is supported by INSU/CNRS (France), MPG (Germany) and IGN (Spain). JEG is supported by the U.K. Science and Technology Facilities Council (STFC). KEKC is a STFC Fellow at Durham University. IRS and RSE acknowledge the Royal Society and STFC.
References
- (1)
- (2) Bai, L., et al., 2007, ApJ, 664, 181
- (3) Bekki, K. & Couch, W. J., 2003, ApJ, 596, L13
- (4) Bekki, K., Couch, W. J., Shioya, Y., 2002, ApJ, 577, 651
- biviano (04) Biviano, A., et al., 2004, A&A, 425, 33
- (6) Coia, D., et al., 2005, A&A, 430, 59
- (7) Coppin, K. E. K., et al., 2008, MNRAS, 389, 45
- (8) Couch, W., & Sharples, R. M., 1987, MNRAS, 229, 423
- (9) Czoske, O., Kneib, J.-P., Soucail, G., Bridges, T. J., Mellier, Y., Cuillandre, J.-C., 2001, A&A, 372, 391
- (10) Daddi, E., et al., 2008, ApJ, 673, L21
- dressler (97) Dressler, A., et al. 1997, ApJ, 490, 577-+
- dressler (08) Dressler, A., et al., 2008, astro-ph/0806.2343
- fadda (08) Fadda, D., Biviano, A., Marleau, F. R., Storrie-Lombardi, L. J., Durret, F., 2008, 672, L9
- (14) Downes, D., Solomon, P. M., Radford, S. J. E., 1993, ApJ, 414, L13
- duc (04) Duc, P.-A., et al. 2004, IAU Colloq. 195: Outskirts of Galaxy Clusters: Intense Life in the Suburbs, Luminous infrared starbursts in a cluster of galaxies
- (16) Gao, Y. & Solomon, P. M., 2004, ApJ, 606, 271
- (17) Geach, J. E., et al. 2006, ApJ, 649, 661
- (18) Geach, J. E., Smail, I., Moran, S. M., Treu, T., Ellis, R. S., 2009, ApJ, 691, 783
- (19) Genzel, R., et al. 2003, ApJ, 584, 633
- (20) Gnedin, O. Y., 2003, ApJ, 582, 141
- (21) Guilloteau, S., & Lucas, R., 2000, ASPC conference proceedings, 217, 299
- (22) Gunn, J. E., & Gott, J. R., III., 1972, ApJ, 176, 1
- (23) Larson, R. B., Tinsley, B. M., Caldwell, C. N., 1980, ApJ, 237, 692
- (24) Kennicutt, R. C., 1998, ApJ, 498, 541
- (25) Kodama, T., et al., 2006, PASP, 57, 309
- (26) Koyama, Y., et al., 2008, MNRAS, astro-ph/0809.2795
- (27) Marciliac, D., et al., 2007, ApJ, 654, 825
- (28) Melchior, A.-L., & Combes, F., 2008, A&A, 477, 775
- moran (06) Moran, S.M., Ellis, R. S., Treu, T., Salim, S., Rich, R. M., Smith, G. P., Kneib, J.-P., 2006, ApJ, 641, L97
- moran (07) Moran, S.M., et al., 2007, ApJ, 671, 1503
- (31) Moore, B., Lake, G., Katz, N, 1998, ApJ, 495, 139
- (32) Neri, R., et al. 2003, ApJ, 597, L113
- (33) Sanders, D. B., Mirabel, I. F., 1996, ARA&A, 34, 749
- (34) Schmidt, M., 1959, ApJ, 129, 243
- (35) Schweizer, F., Whitmore, B. C., Rubin, V. C., 1983, AJ, 88, 909
- (36) Smith, J. D. T., et al., 2007, ApJ, 656, 770
- (37) Solomon, P. M., & Vanden Bout, 2005, ARA&A, 43, 677
- (38) Tacconi, L. J., et al. 2008, ApJ, 680, 246
- treu (03) Treu, T., Ellis, R. S., Kneib, J.-P., Dressler, A., Smail, I., Czoske, O., Oemler, A., Natarajan, P. , 2003, ApJ, 591, 53
- (40) Young, J. S., & Scoville, N. Z., 1991, ARA&A, 29, 581