Improved Estimate of the Occupancy by Beamstrahlung Electrons in the ILD Vertex Detector
Abstract
The impact of the incoherent electron-positron pairs from beamstrahlung on the occupancy of the vertex detector (VXD) for the International Large Detector concept (ILD) has been studied, based on the standard ILD simulation tools. The occupancy was evaluated for two substantially different sensor technology in order to estimate the importance of the latter. The influence of an anti-DID field removing backscattered electrons has also been studied.
1 Introduction
The incoherent production of electron-positron pairs resulting from the beam-beam interaction is the main source of background for the ILD vertex detector, and it is most constraining for its innermost layer. These electrons and positrons are produced with a longitudinal momentum up to few hundreds GeV and a transverse momentum of few tens of MeV on average. Due to their low , they spiralize in the solenoidal magnetic field, whose field lines are parallel to the beam line, thus several of them can traverse repeatedly the same VXD layer. Those primary electrons and positrons may also hit elements of the detector further down the beam line, originating low energy particles traveling backward (secondaries), which may reach the VXD. The rate of secondaries reaching the VXD depends strongly on the presence of an additional dipole field located further down the beam line, as shown in Section 2.3; thus primaries and secondaries will be analized separately in the following. The time when the hit has taken place, will be used to distinguish them. Namely, will be considered as generated by primaries all hits with a hit time shorter than 20 ns and by secondaries those with a hit time larger than 20 ns. A detailed description of this analysis can be found in [2].
2 Analysis
100 bunch crossings (BX) generated with the GuineaPig [3] generator have been studied. The standard simulation and reconstruction tools for the ILD detector concept have been used (i.e. Mokka [4] and Marlin [5] respectively). The model of detector used in this study takes properly into account the angle of 14 mrad between the beam directions. A preliminary description of the calorimeters along the beam line is also included [4].
2.1 Hit density
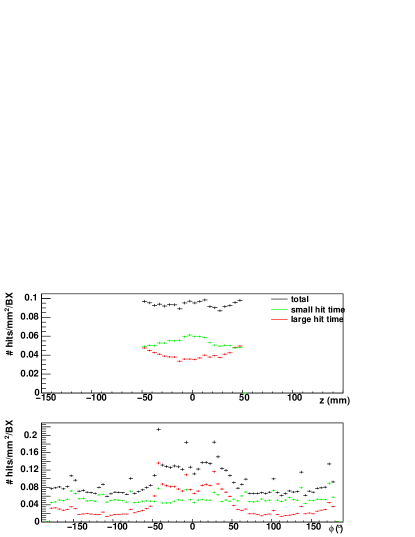
The number of hits in the first layer of the VXD as function of the coordinate along the beam line and the polar angle is shown in Fig. 1. Besides a change of the absolute hit rate, analogous distributions can be observed for the remaining layers. The distribution shows a significant increase of the number of hits in the region , due to the particles with large hit time which are not produced symmetrically around the axis. The ”spikes” in the distributions are due to particle crossing the overlapping regions of neighbouring ladders.
2.2 Occupancy
In order to calculate the occupancy, the effective path length of the
particles inside the sensitive volume of the detector ougth to be
accounted for. It may reach up to several millimeters, especially for
backscattered particles which were produced at small polar angle in
order to reach the VXD.
The occupancy depends on the characteristics of the VXD, namely pixel
size, integration time, number of hit pixels per impact, effective
thickness of the sensitive volume. In absence of choice of the sensor
technology, a set of those parameters has been agreed upon in the ILD
vertex community as reference and they have been used to estimate the
occupancy. As a comparison, the occupancy has been also estimated in
the framework of a specific technology (CMOS [6]). The
parameters describing both options are shown in Tab. 1).
| layer | standard | CMOS | ||
| pitch (m) | integration time (s) | pitch (m) | integration time (s) | |
| 1 | 25 | 50 | 20 | 25 |
| 2 | 25 | 200 | 25 | 50 |
| 3 | 25 | 200 | 33 | 100 |
| 4 | 25 | 200 | 33 | 100 |
| 5 | 25 | 200 | 33 | 100 |
The results for the occupancy in each layer are shown for the two configurations in Tab. 2.
| layer | standard | CMOS | ||||
|---|---|---|---|---|---|---|
| total | large hit time | short hit time | total | large hit time | short hit time | |
| 1 | 0.0790 | 0.0347 | 0.0443 | 0.0183 | 0.0080 | 0.0103 |
| 2 | 0.0381 | 0.0164 | 0.0217 | 0.0062 | 0.0026 | 0.0035 |
| 3 | 0.0105 | 0.0049 | 0.0056 | 0.0054 | 0.0025 | 0.0029 |
| 4 | 0.0041 | 0.0020 | 0.0021 | 0.0021 | 0.0010 | 0.0011 |
| 5 | 0.0016 | 0.0006 | 0.0010 | 0.0008 | 0.0003 | 0.0005 |
The values are averaged over . In fact, due to the dependence shown in Figure 1, the local occupancy in a sector can be twice as high as the mean. In average, one can conclude that the large hit time contribution to the occupancy is more than of the total rate.
2.3 Anti-DID magnetic field
A Detector Integrated Dipole (anti-DID), aligning the outgoing beam with the experimental magnetic field, can be used to reduce the beam size growth due to synchrotron radiation. The anti-DID impacts also the hit rate on the VXD due to beamstrahlung electrons, by reducing the number of backscattered electrons travelling backwards from further along the beam line.
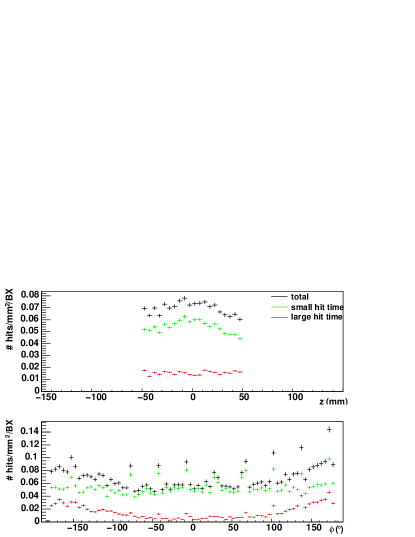
The anti-DID reduces by roughly 30% the number of hits on the VXD, in particular the large hit time component, as can be seen in Figure 2. This leads to a more homogeneous local distribution in . The occupancy of the ILD vertex detector, which is a driving parameter of its requirements, has been evaluated with the latest version of the experimental apparatus, assuming a five-layer VXD geometry with 15 mm inner radius and a 3.5 T magnetic field. The evaluation was performed for two different sets of pixel characteristics, representative of the most mature sensor technologies under consideration. Both sets assume a continous read-out during the train. They differ by their read-out time, pixel pitch, cluster multiplicity and sensitive volume thickness.
3 Conclusion
Occupancies of and were found in the innermost layer for the two sets. The average occupancy would be about 30% lower in presence of anti-DID, with a 50% decrease in one azimuthal sector. Accounting for the uncertainties on these predictions translates into upper limits on the occupancy in the innermost layer in the range 5-15%, depending on the sensor characteristics. These high rates plead for additional R&D on the sensors equipping this layer, in particular for shortening the read-out time significantly below 50 .
References
-
[1]
Presentation:
http://ilcagenda.linearcollider.org/contributionDisplay.py?contribId=221&sessionId=21&confId=2628 - [2] R.De Masi et al., ILC-note in preparation.
- [3] D. Schulte, PhD Thesis, University of Hamburg, (1996).
-
[4]
P.M. de Freitas, MOKKA,
http://mokka.in2p3.fr. -
[5]
ILC software
http://ilcsoft.desy.de. -
[6]
http://iphc.in2p3.fr/-CMOS-ILC-.html.