790
C. Caretta
22email: caretta@astro.ugto.mx
Galaxy activity influenced by the environment in the cluster of galaxies Abell 85
Abstract
We analyse the relation between the dynamical state of a cluster of galaxies and the activity (star formation and AGN) of its members. For the case of Abell 85 we find some evidence for an enhanced activity of both types in substructures which are in the early stage of merging with the cluster.
keywords:
galaxies: clusters: individual (A85) – galaxies: clusters: evolution – galaxies: active – galaxies: star formation – galaxies: evolution1 Introduction
It is widely accepted that the environment has strong influence on the formation and evolution of galaxies. One of the most established examples is the morphology-density relation (e.g., Dressler, 1980). The question then is: which are the mechanisms that cause this influence, and specifically, how do these mechanisms affect the activity of the galaxies – probably one of the most important characteristics related to galaxy evolution? Here we present some results on a case study, the cluster Abell 85, of the influence of the environment on the star formation (SF) and AGN activity of its member galaxies.
2 The Cluster Abell 85
The cluster of galaxies A85 is a moderately rich (R = 1), relatively nearby (z = 0.055) cluster. It has been extensively studied over all the electromagnetic spectrum, especially in the radio, optical and X-rays. Many works have revealed a dynamically young system undergoing the merging of smaller clumps of galaxies. In Fig. 1 we show the results of the application of the -test (Dressler & Shectman, 1988) to the 3D distribution of 367 member galaxies in A85 [projected positions from SuperCOSMOS data (Hambly et al., 2001) and radial velocities from an updated version of the compilation by Andernach et al. (2005)]. This test searches for deviations of the local kinematics (based on the 10 nearest neighbors for each galaxy) and the global one (called ). We identify five substructures in this cluster based on the concentration of galaxies with deviant kinematics (displayed in magenta in Fig. 1):
C2: this substructure is composed of two clumps: the northern one, which is centered on the 2nd-brightest galaxy; and the southern one, identified in a Chandra X-ray image (Kempner et al., 2002);
SB (South Blob): identified originally from X-ray imaging (Kempner et al., 2002); its kinematics is not particularly deviant but it represents the second highest density peak of the cluster;
F: X-ray filament: also identified in X-rays (Durret et al., 1998);
SE: this substructure is projected in the direction of the background cluster A87 (at z = 0.130);
W: probably a clump that started interaction with A85 most recently.
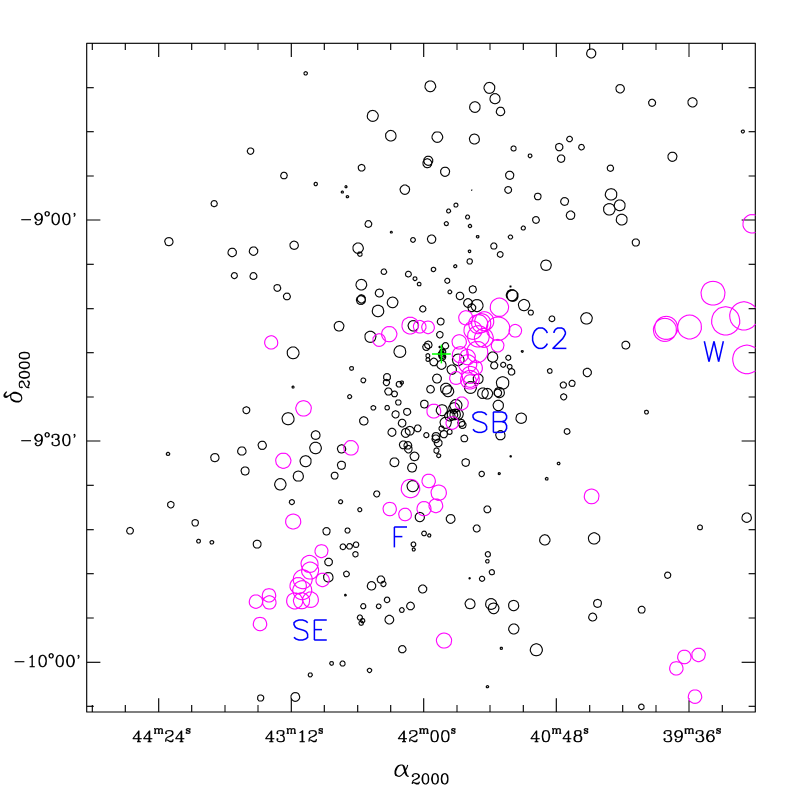
Details of this analysis are presented in (Bravo-Alfaro et al. 2008, in prep.).
3 Classification of Galaxies
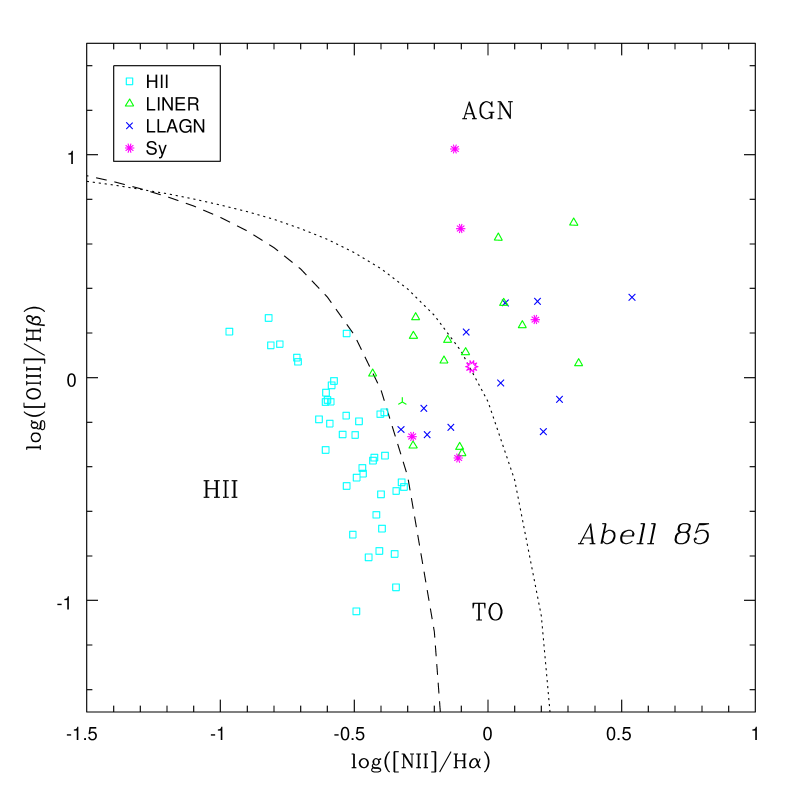
For the analysis of activity (SF and AGN) we used an homogeneous sample of 232 spectra of A85 galaxy members (63% of known members) available from SDSS (e.g., Adelman-McCarthy et al., 2007). Using the starlight routine (Cid Fernandes et al., 2005) we obtained the population synthesis of these spectra. Subtracting the respective synthetic stellar spectrum from each observed one we could fit and measure the emission lines. Only lines with S/N were used. Two diagnostic diagrams (Coziol et al., 1998; Baldwin, Phillips & Terlevich, 1981) and an exhautive visual inspection were used in order to separate the emission line galaxies into HII and AGN domains (Figs. 2 and 3). Our results show that 17% of A85 members are HII, 17% are LLAGNs, 5% are LINERs and 2.6% are high-luminosity AGNs, the remaining being galaxies without emission-lines (noEL).
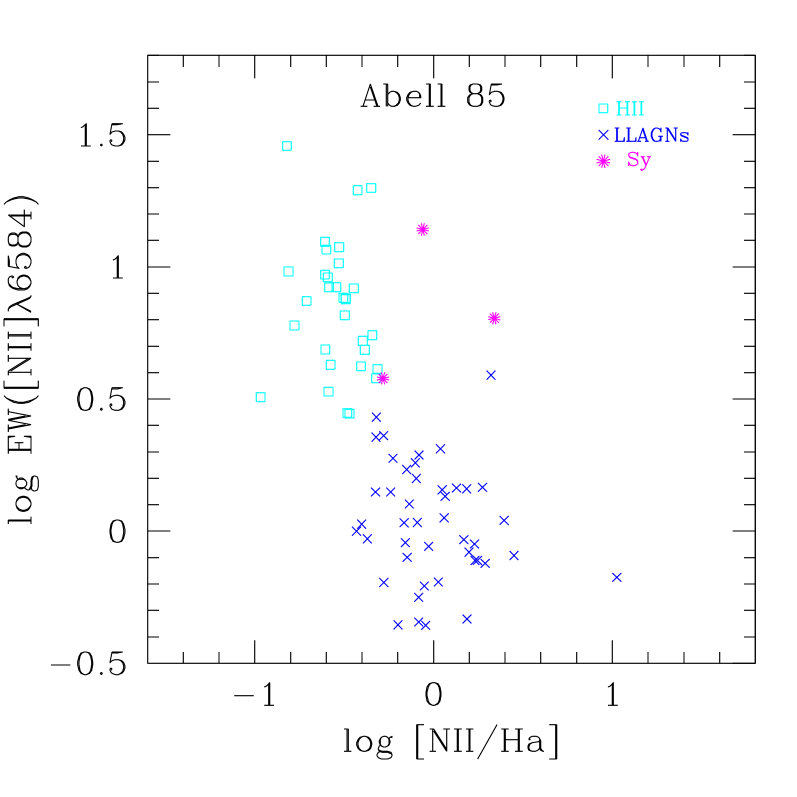
This AGN fraction in a cluster is much higher than previously reported, especially before the era of large spectroscopic surveys, when the estimates showed a decrease of the number of AGNs in clusters with respect to the field (e.g., Gisler, 1978). A recent X-ray survey of A85 (Sivakoff et al., 2008) detected 4 high luminosity AGNs in a sample of 170 member galaxies of A85 (2.4%), in accordance with our results.
4 Environmental Effects
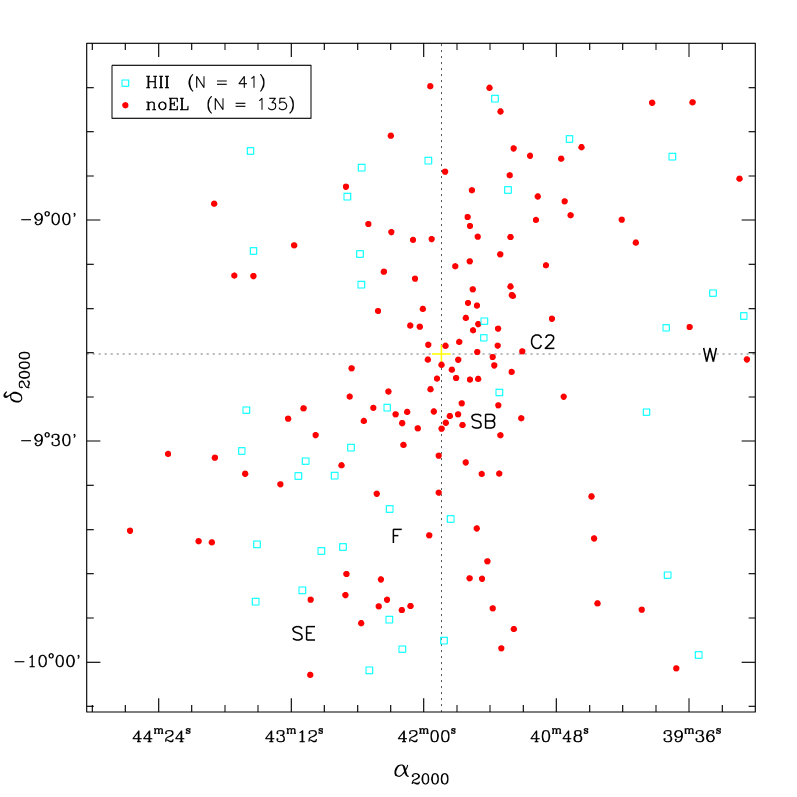
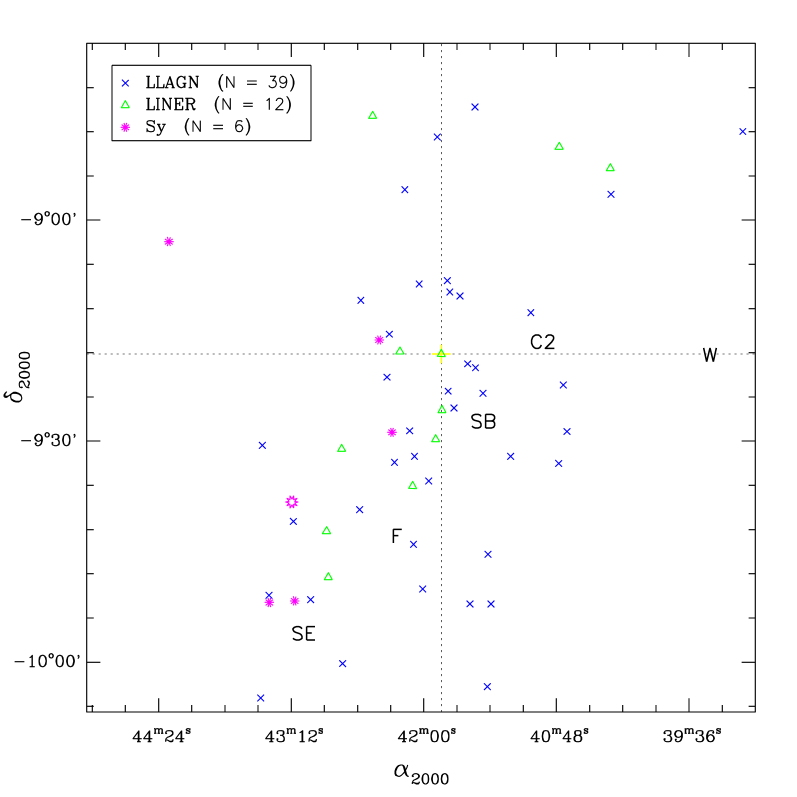
We correlate the distribution of our sample of galaxies spectroscopically classified with the substructures in A85. In Fig. 4 one can see that the noEL present a fairly homogeneous distribution, concentrated toward the center as expected. On the other hand, the HII galaxies show some concentration in the SE quadrant. This is the region comprising the majority of the substructures found in A85, namely the SE, the X-ray filament and the SB. Since this ridge of clumps is poblably the most dynamically active part of the cluster in recent times, representing a sequence of future merging structures to the main body of the cluster, we are lead to conclude that there is some stimulation of SF activity by this dynamical status. More than that, the AGN activity (Fig. 5), both the low energy phenomenon (LLAGNs and LINERs) and high energy one (Sy2), present a more enhanced concentration around the ridge. All of the Sy2 galaxies are located on the eastern side of A85, and two of them are members of the SE substructure. This relative overdensity of active galaxies inside the substructure SE suggests that activity is favored inside substructures that are beginning to interact with the cluster. We have also started to study the complete SF history of our sample galaxies using starlight, which will be presented elsewhere.
5 Conclusions
The main results of this work are: (a) we found a very large number of LLAGNs (Ho et al., 1993) in A85, with a similar abundance to the one found in compact groups of galaxies (Coziol et al., 1998); this suggests the LLAGN phenomenon is very common in dense environments; (b) there is some evidence of enhanced activity, both SF and AGN, in substructures in the early stage on their process of merging with the cluster; (c) we suggest that the distribution of active galaxies may be used to search for the presence of subtructures in clusters of galaxies.
Acknowledgements.
We are grateful to CONACyT and Universidad de Guanajuato for supporting this project. We also acknowledge the use of SDSS data (the SDSS Web Site is http://www.sdss.org/).References
- Adelman-McCarthy et al. (2007) Adelman-McCarthy, J.K., et al. 2007, ApJS 172, 634.
- Andernach et al. (2005) Andernach, H., et al. 2005, ASPC 329, 283.
- Baldwin, Phillips & Terlevich (1981) Baldwin, J.A., Phillips, M.M., Terlevich, R. 1981, PASP 93, 5.
- Cid Fernandes et al. (2005) Cid Fernandes, R., et al. 2005, MNRAS 358, 363.
- Coziol et al. (1998) Coziol, R., et al. 1998, ApJ 493, 563.
- Dressler (1980) Dressler, A. 1980, ApJ 236, 351.
- Dressler & Shectman (1988) Dressler, A., Shectman, S.A. 1988, AJ 95, 985.
- Durret et al. (1998) Durret, F., et al. 1998, A&A 335, 41.
- Gisler (1978) Gisler, G.R. 1978, MNRAS 183, 633.
- Hambly et al. (2001) Hambly, N.C., et al. 2001, MNRAS 326, 1279.
- Ho et al. (1993) Ho, L.C., Shields, J.C., Filippenko, A.V. 1993, ApJ 410, 567.
- Kempner et al. (2002) Kempner, J.C., Sarazin, C.L., Ricker, P.M. 2002, ApJ 579, 236.
- Sivakoff et al. (2008) Sivakoff, G.R., et al. 2008, arXiv0804.3797.