Vibrational anisotropy and quadrupole interactions of Fe substituted into Mn site of the charge and orbitally ordered and disordered layered manganites LnBaMn1.96Fe0.04O5 and LnBaMn1.96Fe0.04O6 (Ln=Y, Gd, Sm, La, etc.)
Abstract
A-site ordered manganites LnBaMn1.96Fe0.04O5 and LnBaMn1.96Fe0.04O6 are investigated by x-ray full-profile diffraction and Mössbauer spectroscopy. Powder samples were oriented with preferred orientation of platy crystallites in the plane of sample surface. March-Dollase function of preferred orientation was employed in analysing both the Rietveld patterns and the Mössbauer spectra. Combined effects of preffered orientation and vibrational anisotropy on the line area asymmetry of Mössbauer doublet are analysed. Constructive and destructive interference between the effects of texture and vibrational anisotropy is observed in LnBaMn1.96Fe0.04O6 and LnBaMn1.96Fe0.04O5, respectively. Both series of the manganites show the main axis of electric field gradient perpendicular to layers (V) with in oxygen-poor series and in oxygen-rich series. Charge-orbital order (COO) melting around Fe dopants explains the single-site spectra observed for several Ln in both ”O5” and ”O6” series, except LaBaMn1.96Fe0.04O5. However, the short-range COO persists to be observed in magnetization and in x-ray patterns.
I Introduction
The manganites LnBaMn2Oy present a novel class of layered materilas, in which the layered arrangements of Y and Ba cations results into the regular architectures of the half-occupied eg-orbitals of Mn3+ with the out-of-plane and in-plane orientations for and , respectively. Both series enclose manganese in state of half-doping mixed valence. The orbital order is coupled to charge order, consisting in the alternations Mn3+/Mn2+ and Mn3+/Mn4+ for and , respectively, along three axes, which are Cartesian for the majority of Ln’s, but slightly oblique in monoclinicNKIOYU or triclinicWAR YBaMn2O6.
Owing to the layered structure the polycrystalline materials are highly susceptible to preferred orientation withstanding a simple quantitative description, except the special case of YBaMn2O6. Recently, such a quantitative description was suggestedEPL to be useful in vibrational spectroscopy on powders of anisotropic materials. As a matter of fact, the oriented polycrystals consisting of platy crystallites can replace the single crystals in studies of a variety of anisotropic properties of materials, such as electric, magnetic or vibrational. Especially, when the polycrystalline material is a ferromagnet or a superconductor it can be subjected to a thorough texturing in an external magnetic field.
In this work, members of both the ”O5” MCDRS ; MA ; Millange and ”O6” NKYOU ; WAR ; NYU ; NKIOYU ; Aka ; NKU families with Ln=Y, Gd, Sm, Nd, Pr, La and Ln=Sm1-xNdx solid solutions were doped with 2% of 57Fe and investigated using Rietveld analysis, magnetization and Mössbauer spectroscopy on both random and oriented powders. We investigate the effect of the Fe substituents on the phase transitions known to occur in undoped systems. Clean samples exhibit the COO on the long-range scale observed previously via neutron diffractionNKYOU ; NKIOYU ; NYU ; Aka ; WAR . We show that the substitution smears some of the transitions and lowers the temperature for others.
In charge-ordered state, the Fe substituents display only one component Fe3+ in Mössbauer spectra. With doping the stable-valence ion Fe3+ into the mixed-valence site of Jahn-Teller ions, such as Mn2+/Mn3+or MnMn4+, the long-range COO becomes the subject of suppression by quenched disorder. The short range order is understood to preserve a favorite arrangements of Mn electronic configurations around the 57Fe impurity dopants.
Via the quadrupole interactions and isomer shifts we explore the variety of structural and valence states adopted by the impurity. In addition, due to the layered structure the manifestations of vibrational anisotropy appears in Mössbauer line intensities, similarly to layered cuprates, which showed a notable Goldanskii-Karyagin effect (GKE)RCR . In samples with preferred orientation, the texture effects are combined in Mössbauer spectra intensities with GKE and a technique is suggested to disentangle these effects. The same technique can be useful to determine the anisotropy in tensor material properties starting from the data obtained on the aligned powders. We illustrate the application of this technique to one of such properties, when the measurements is feasible again with the radiation of the same wavelength as in Mössbauer spectroscopy, however, realizable only on a large-scale synchrotron facility. This property is the anisotropic multicomponent phonon density of states (DOS), which request the single crystals for ordinary measurementKCR , however, this work presents a proposal for determination of both DOS components using the aligned powders instead of a single crystal.
II Experimental details
The layered A–site-ordered oxygen-saturated manganites LnBaMn1.96Fe0.04O6 were prepared for Ln=Y, Gd, Sm, (Sm0.9Nd0.1), (Sm0.1Nd0.9), Nd, Pr and La. The oxides Ln2O3 and Fe2O3 were mixed with carbonates BaCO3 and MnCO3. These mixtures were first annealed in 6N pure Ar (99.9999%) flow at 1350oC. This annealing has led to obtaining the oxygen-depleted phases LnBaMn1.96Fe0.04O5. The synthesis of the oxygen-saturated ”O6” manganite is a two-step process as described previouslyNKU . The second step consisted of annealing in O2 flow at low temperature (500oC). While in the first step of the oxygen-depletion the layered structure is formed of the alternating BaO and Y sheets interleaved by the MnO2 ’checkerboards’, in the second step this structure is intercalated into Y-layer with the additional oxygen. A third family of manganites with the same cationic compositions was obtained in air (without layer-growing treatment in 6N Ar) and showed a simple perovskite-like disordered structure.
Rietveld profiles for both ”O5” and ”O6” families of layer-ordered manganites were obtained by means of a ”Mac Science” diffractometer using Cu- radiation (= 0.15405 nm and 0.15443 nm). Mössbauer spectra were measured at room temperature. Isomer shifts are referred relatively Fe. To prepare the oriented powder samples several methods were used. The powders were wet-spread in alcohol and dry-spread onto scotch tape or onto blotting-paper. The data were obtained for powders oriented with their largest dimension in the plane-of the tape with a marked texture. Rietveld refinements for all diffraction profiles were carried out using FULLPROF programDBW ; Full .
Measurements of magnetization were performed using a SQUID magnetometer in an applied field of 1 kOe at heating the samples from 5 K to and then at cooling from down to 5 K. This measurment protocol was applied in LnBaMn1.96Fe0.04O6 for Ln=Sm with =400 K and for Ln=(Nd0.9Sm0.1) with 370 K. The magnetization in YBaMn1.96Fe0.04O6 was measured first at heating from ambient temperature to = 600 K (Ln=Y) and then at cooling from down to 5 K. The sample was then remagnetized at 5K by setting the external field kOe followed by reapplying kOe. Finally, this sample magnetization was measured at heating up to 300 K.
III Results and discussion
III.1 Structural considerations.
III.1.1 Room-temperature lattice parameters and symmetry groups
Prior to first reports on the manganites YBaMn2O5MCDRS ; MA ; MSCB and LaBaMn2Oy ( and )Millange ; Caignaert which crystallized in the perovskite-like bilayered tetragonal structures, the ferrocuprate YBaCuFeO5 with the same structure built up of bipyramidal layers was already knownEr since 1988. On the other hand, the oxygen-rich () layered manganite system had no prototype among cuprates. There exist two important features of the manganite systems, distinguishing them from the cuprate one. First, the layers of Ba and Ln develop in LaBaMn2Oy only if the system is deoxygenated () at high-temperature synthesis. Excess of oxygen during the high-temperature annealing breaks the layered structure and create the disordered isotropic phase. Second, both the ”O5” and ”O6” structures exhibit the in-plane ordering mixed valence ions Mn2+/Mn and Mn3+/Mn4+, respectively, both associated with COO. We observed that all of our x-ray profiles from ”O5” samples are perfectly fitted with the model (Fig.1). The quality of fit was strongly declined when we attempted to fit the patterns in terms of model. This result suggests that the COO is essentially preserved in our samples having the Fe ions placed into 2% of the Mn sites. However, from Mössbauer single-site spectra a COO meltdown is suggested, as shown below. Such a meltdown is not denotiative of full randomness. Short range order in the arrangement of charges and orbitals is preserved. Indeed, since no superstructure reflections were observed, associated with lowering symmetry from to , our Rietveld refinement preference for the symmetry group indicates only that the COO is kept on a short range. In pure LaBaMn2O the supercell reflections are observable with electron diffractionMillange , while Fe-doping may broaden them and suppress their intensity to the level insufficient for observation. The coexistence of the preserved short-range COO with the doping-induced quenched disorder is discussed below along with Mössbauer spectra.
In contrast to the singular ”O5”-phase (phase, that is common for all the rare-earth elements, a few different modifications are known for the oxygen-saturated ”O6” A-site ordered layered manganites, depending on the size of Ln NKU ; NKYOU ; NKIOYU ; WAR . All of them are built up of octahedral bilayers composed of octahedra distorted in one way or other. Our Rietveld refinements were carried out using several symmetry groups and structure models known from the literatureNKU ; NKYOU ; NKIOYU ; WAR . These treatments have shown that the tetragonal cell suits best (Fig.2) to all the samples in the layer-ordered oxygen-saturated family, with one exception of YBaMn1.96Fe0.04O6. The structure of the latter was refined using the monoclinic symmetry (space group P2, No.3).
To smmarize, the lattice cells were fitted with the volume double or quadruple of perovskite one ( or 4) owing to the lattice parameters relations:
| for |
III.1.2 Distortions of perovskite cell
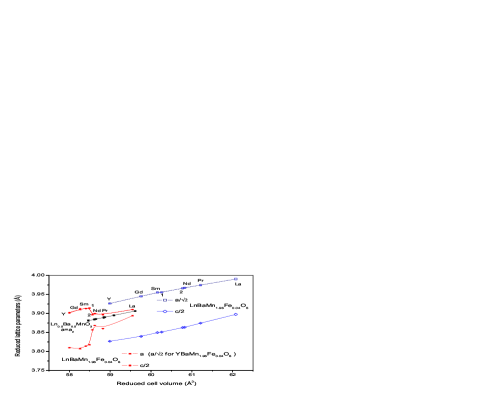
Comparing the parameters of reduced lattice cell (i.e. a distorted perovskite cell) one can analyze the extent of distortion depending on Ln, in function of the volume of the reduced cell. Fig. 3 summarizes the results of refinement of the lattice cell parameters. The reduced parameters () and are plotted against the reduced cell volume (). From Y to La the volume varies in LnBaMn1.96Fe0.04O5 within 5% and both and vary in the range of 1.7%. Distortion of the reduced cell can be calculated in LnBaMn2O5 as . From Y to La the distortion decreases from 2.56% to 2.36%, respectively. In the oxygen-saturated series, the distortion does not show a stationary level from Y to La, but changes abruptly between Sm and Nd.
III.1.3 Phase transitions
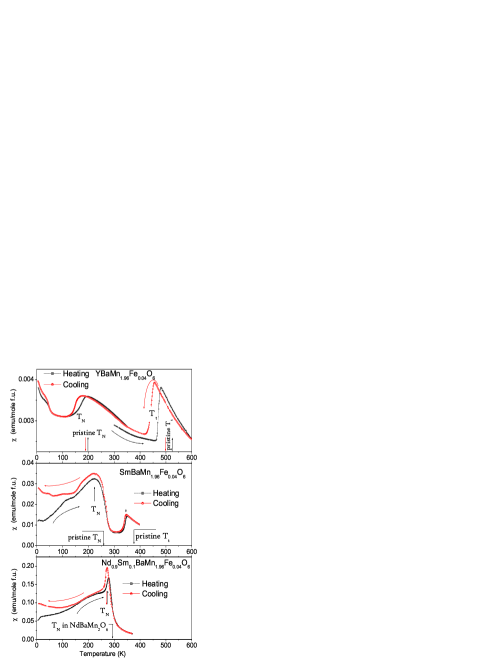
We observe in Fig. 4 that there occurs in LnBaMn1.96Fe0.04O6 the phase transitions associated with COO and magnetic ordering. The same jumps and humps of susceptibility are observed as in the undoped LnBaMn2O6, however, the corresponding transition temperatures are suppressed. According to size of Ln three groops of the oxygen-saturated manganites were specified previouslyJPSJ2002 as Ln(I) (Y, Tb, Dy, Ho), Ln(II)=(Sm, Eu, Gd) and Ln(III)=(Nd, Pr, La). A member from each of these families was investigated in this work for the effect of the Fe substituents on the transitions manifested in magnetic properties.
The transition sequences (temperatures , ) in the lightly (i.e. 2%) Fe-doped manganites are essentially same as in undoped manganites, but differ in details. In YBaMn1.96Fe0.04O6 and SmBaMn1.96Fe0.04O6, the highest in temperature jump of magnetzation is associated with a structural transition, which is monoclinic-to-triclinicNKIOYU or triclinic-to-monclinicWAR for Ln=Y, and tetragonal-to-orthorhombicAkah for Ln=Sm. Orbital ordering is now believedUN to accompany these structural transition (), while complete charge ordering is attributedNKU ; NKIOYU , e.g. for Ln=Y, to a separate small hump shifted from to lower temperature by K. In the undoped manganites, the temperature is associated with sharp localization of charge carriers. In the magnetization of YBaMn1.96Fe0.04O6, the large jump is observed apparently without any small foregoing hump. Interestingly, similar disappearance of the hump in magnetization caused by Fe doping was reported for orbital ordering transition in BiMnO3Belik . Smearing the transition over a broad temperature range induced by Fe substitution suppresses such a hump.
Another key feature of the doped systems stems from the fact that the values of are slightly suppressed compared to undoped YBaMn2O6 and SmBaMn2O6NKIOYU ; NYU . The suppression ranges are 2%Fe50K and 40 K for Ln=Y and Sm, respectively.
In contrast to similar values of , there occurs a large difference between the cases of Ln=Y and Sm for the shift of the transition temperature with the reversal of temperature sweep direction. Such a shift is associated with an energy barrier for nucleation of a new phase within the region of overheating or undercooling the preceding phase. The hysteresis indicates strongly the first-order character of transition that was observed also in undoped YBaMn2O6NKIOYU . The large nucleation barrier is observed in YBaMn2O6 but not in SmBaMn2O6. This is in agreement with a very small structural distortion in SmBaMn2O6 at as reported by Akahoshi et alAkah .
Temperatures of Neel () are also notably suppressed in both cases, as well as in the third group member, Nd0.9Sm0.1BaMn1.96Fe0.04O6. The antiferromagnetic transitions humps were observedNKYOU ; NYU at 290 K and 250 K in undoped NdBaMn2O6 and SmBaMn2O6, respectively, therefore, the value of 286 K is expected for the solid solution Nd0.9Sm0.1BaMn2O6. Remaining suppression K should be attributed to the effect of Fe substitution. Temperature ranges for sweep-reversal hysteresis around are not much different between the three.
III.1.4 Preferred orientation
In both series of the layered manganites the samples displayed some degree of preferred orientation which is directly seen in x-ray diffraction patterns through an enhancement of the reflections of the type (Fig.2). This indicates the platy habits of thin crystallites with the easy cleavage planes parallel to the layers. Table 1 summarizes the results of refinement of the preferred orientation parameters.
Table 1. Parameters of March-Dollase function, and , Eq.(1), refined from x-ray diffraction patterns.
| LnBaMn1.96Fe0.04O5 | LnBaMn1.96Fe0.04O6 | |||||
|---|---|---|---|---|---|---|
| Ln | G1 | G2 | G1 | G2 | ||
| Y | 0.61(3) | 0.27(2) | 5.64 | N/A*** | N/A*** | — |
| Gd | 0.61(1) | 0.47(2) | 3.88 | 0.57(3) | 0.84(2) | 1.88 |
| Sm | 0.73(1) | 0.68(4) | 1.71 | 0.76(3) | 0.78(2) | 1.38 |
| 1* | 0.61(2) | 0.74(3) | 2.18 | 0.74(3) | 0.76(2) | 1.48 |
| 2** | 0.80(2) | 0.59(10) | 1.57 | 0.97(5) | 0.99(1) | 1.00 |
| Nd | 0.47(4) | 0.75(5) | 3.80 | 0.55(10) | 0.94(3) | 1.35 |
| Pr | 0.45(6) | 0.57(10) | 7.56 | 0.46(22) | 0.97(2) | 1.31 |
| La | 0.68(2) | 0.75(15) | 1.74 | 0.96(3) | 0.86(3) | 1.03 |
*1: Sm0.9Nd0.1BaMn1.96Fe0.04O
**2: Sm0.1Nd0.9BaMn1.96Fe0.04Ox
***Refinement with the uniaxial texture along [] was not applicable by reason of monoclinic structure.
The March-Dollase (MD) functioninc depends on three variables: the texture-axis-misfit angle and two profile-refinable parameters , (Ref.Dollase, ),
| (1) |
That is to say, is the acute angle between the x-ray scattering vector and the axis of preferred orientation. In powders of single-crystalline particles, the preferred axis is dictated by the grain shape. The cylindrical-symmetry texture axis runs along the whisker-like or fiber-like crystals, but along the normal to the plate-like crystals. We fitted all our x-ray patterns with the uniaxial texture along the direction []. The Eq.(1) describes the density of poles, which come into reflection position at a given Bragg angle . From the viewpoint of conserving the scattering matter the function is a true distribution function suitable for quantitative analysis. In this sense, the March-Dollase distribution is much better than Gaussian distribution, originally suggested by RietveldRiet . The parameter desrcibes the fraction of the sample that is not textured and the parameter describes the degree of alignment within the textured fraction. The diffraction intensities are scaled by the distribution which culminates at for , but at for . Therefore, both plate-like and needle-like powders are refinable with the universal function . The domains and correspond to the platy and acicular habits, respectively, while fully isotropic powder fits to .
Two parameters of the textured sample anisotropy and presents the full set of texturing characteristics, however, it is convenient to simplify the sample comparison using the single parameter given by a combination of and . This ratio displays directly the enhancement of right-hand line within the closely-spaced pairs and (Fig.2). From the Table 1 it becomes clear that LnBaMn1.96Fe0.04O5 shows much stronger tendency to texturing than LnBaMn1.96Fe0.04O6. This result could be explained by variations in crystallite size and aspect ratio.
Returning to the preparation conditions of these series of samples, one sees that LnBaMn1.96Fe0.04O6 was prepared from LnBaMn1.96Fe0.04O5 in oxygen at the temperature as low as 500oC. In such a low temperature process, the crystallites could be destroyed and diminished in size, but hardly could grow. It follows indeed from Fig.3 that the large compression of the lattice takes place at oxygenation. It was observed previously in GdBaMn2O5+x Taskin , that the rate of oxygen intercalation into the layered oxide is extremely high. Strains associated with the oxygenation are very large. The crystal cracking and breakup in lateral dimension are likely to accompany the oxygen intercalation. The crystal cracks and strains observed during oxygenation were attributed to orthorhombicityTaskin . We have stabilized the orthorhombic phase GdBaMn2O5.5 using a more complicated sequence of thermal treatmentsparallel . The orthorhombic distortion in GdBaMn2O5.5 is indeed much larger than either D5 or D6, calculated above. Large distortion arises from channel-like structure of the half-filled layer LnO0.5 and this could be the plausible origin of the crystal dispergating with oxygenationparallel .
III.2 Mössbauer spectroscopy
III.2.1 Oxygen-depleted phase LnBaMn1.96Fe0.04O5
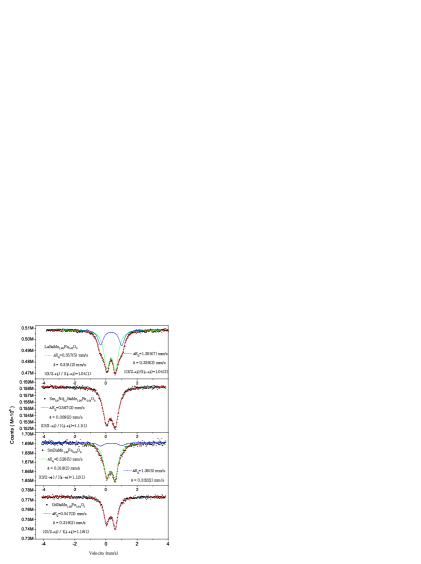
Mössbauer spectra in oriented samples of LnBaMn1.96Fe0.04O5 are clearly asymmetric. In the samples with Ln=Gd and Ln=(Sm0.9Nd0.1) the spectra are fitted with single asymmetric doublet. However, two doublets are crucial to fit the spectra for Ln=La and Sm (Fig.5).
Spectral asymmetry increases from La towards Gd and this increase correlates with increasing distortion D5. The second doublet is not enough resolved to fit separately its asymmetry. Therefore, its asymmetry was fixed at fitting to be the same as the asymmetry of the major doublet.
As the size of Ln decreases we observe the systematic decrease in the area of second doublet. An exception from this series is made by the mixed rare-earth manganite Sm0.9Nd0.1BaMn1.96Fe0.04O5 showing a single doublet, although the average size of (Sm0.9Nd0.1) is larger than the size of Sm, while SmBaMn1.96Fe0.04O5 still shows a presence of the second doublet. However, this observation is in line with our interpretation of the single-site spectrum as originating from the meltdown of the charge order induced by the pointlike quenched disorder. Indeed, the additional pointlike disorder in Sm0.9Nd0.1BaMn1.96Fe0.04O5 is related to disorder in the Ln site.
III.2.2 Coexistense of the short-range COO with quenched disorder
An important result appears in the fact that Fe sees the charge order broken more easily for smaller Ln by the same level of doping. The double-site spectrum in LaBaMn1.96Fe0.04O5 evidences that the charge order is robust for Ln=La, so that the Fe species ocuppy both Mn(II) and Mn (III) sites, although the area ratio is 7:3 instead of 5:5 expected for random occupation. Such a random occupation might be expected only in case of long-range charge order. However, iron can adopt more easily its preferred site when the charge and orbital ordered domains decrease in size.
There occurs enough charge fluidity in GdBaMn1.96Fe0.04O5 and in Sm0.9Nd0.1BaMn1.96Fe0.04O5 to realize the unique surrounding for overwhelming majority of dopants. On the other hand, in LaBaMn1.96Fe0.04O5 and in SmBaMn1.96Fe0.04O5, we observe the robust COO that has a longer correlation lengths, such that a minor but significant part of dopants remains in a different surrounding.
The second doublet shows the same isomer shift but twice increased quadrupolar splitting. Both doublets originate from 57Fe in pyramidal coordination, however, one of these doublets originates from the site having a larger apical distance and stronger Jahn-Teller character. Trying to understand the origin of difference between doping behaviors for large and small Ln’s, let us compare the pyramidal interatomic distances in LaBaMn2O5 and in YBaMn2O5 as reported previouslyMillange ; MSCB . The difference between Mn(II) and Mn(III) pyramids is similar for Ln=La and Y, however, in YBaMn2O5, both Mn(II) and Mn(III) pyramids are more elongated in apical dimension, and compressed in equatorial dimension. Such a distortion appears thus to facilitate the melting of the charge and orbital order around the doped Fe species.
III.2.3 Two sources of the doublet asymmetry
Known origins of the line area asymmetry in Mössbauer spectra are the preferred orientation of crystallites and vibrational anisotropy. In a random polycrystalline material, the ordinary single-site spectra in paramagnetic domain are the symmetric doublets. The equal intensities of both lines result from random-powder averaging, unless GKE takes place. Preferred orientation would induce the asymmetry with or without GKE. We discuss first the separate ocurrence of texture effects and GKE and start from the texture effects.
Texture effects
Let us consider the doublet intensity ratio for a single crystallite. This ratio depends on the orientation of the wave vector of the incident x-ray quantum with respect to the axes of the electric field gradient (EFG) tensor of the site wherein the 57Fe nucleus is located. The angular dependence of Clebsch-Gordan coefficientsSh results in the -dependent intensity ratio of the quadrupole doublet for each crystallite:
| (2) |
When the unoriented powder is used for measuring the spectra the angular averaging gives , and . In case of oriented powder, using the MD texture function (Eq.1), we substitute and with
| (3) |
where
| (4) | ||||
| (5) | ||||
| (6) | ||||
| (7) |
Both factors and are imaginary for , however, is real in full range .
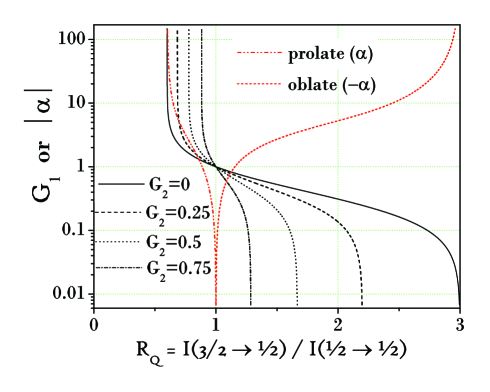
Rietveld analysis allows one to fit the parameters of the degree of alignment and the aligned fraction starting from a set of x-ray diffraction intensities. A similar problem can be formulated in Mossbauer spectroscopy: to determine and starting from the spectral asymmetry. In the area of small asymmetries, the effect of and on the asymmetry turns out to be nearly equal, as will be shown below. In Fig.6, the degree of alignment is plotted vs. the asymmetry for several values of the textured fraction .
Vibrational anisotropy
The vibrational anisotropy is also plotted in Fig.6 vs. . It is expressed through the absolute value of the wave vector for -radiation and the mean-square vibrational displacements along , and in perpendicular direction, . This plot was calculated following the integral of each line intensity scaled with the angle-dependent Lamb-Mössbauer factor for uniaxial symmetry :
| (8) |
The Eq.(8) is appropriate in randomized powders of all our ”O6” phases, except YBaMn1.96Fe0.04O6. The sigmoidal function is decreasing from 3 to 0.6 when is varied from to . The inverse function is shown in Fig.6 as a semilog plot, having two branches. The right-hand branch () corresponds to oblate, pancake-shaped ellipsoids of atomic thermal displacements (ATD), and the less-dispersive left-hand branch correspond to prolate, or cigar-like ATD.
From Fig.6 it becomes clear that the underbalanced line area ratio ( is related to either prolate ATD or to acicular crystallite textures. The overbalanced ratio () is produced either by oblate ATD or by platy crystallite textures. Mixing these effects will be analysed below in §8.
III.2.4 Line assignement
The case refers in Eqs.(2,8) to stronger line and weaker line . The line lies higher in energy than the line if . Vice versa, if , the lines swap the energy positions.
We attribute the more intense line in Fig. 5 to the transition assuming that the electric field gradient is oriented along axis perpendicular to layers. This is in agreement with the point charge model for pyramidal coordination HI . Thus, either oblate ATD or platy crystallite textures underlie the observed in Fig.5 spectral asymmetry. Among the reports of neutron diffraction profile refinements in LnBaMn2O5, no data are known for an anisotropic ATD because all profiles were refined using BisoMCDRS ; MA ; Millange . The anisotropic ATD, however, were refined previously for pyramidal coordination of YBaFeCuO5. The oblate ATD ellipsoids were never observed in pyramidal coordination. On the opposite, the ATD tensor shaped as very extended prolate ’cigar’ was found in YBaFeCuO5Mom . Thus, the self-consistent combination is and prevailing asymmetry owing to platy-crystallite texture. The asymmetry would be reduced by prolate ATD, but not fully compensated.
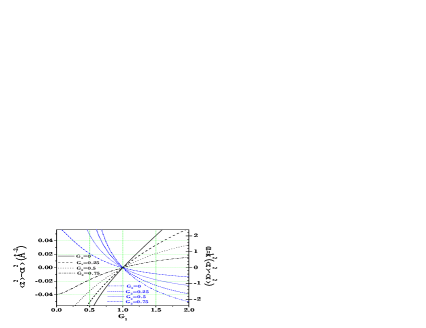
The compensation effects can be described quantitatively if we find what texture parameters are equivalent to vibrational anisotropy parameter in its effect on asymmetry. Having arrived to the quantitative description of texture using the Eqs.(4-3) and Fig.6, we can now plot the vibrational parameter vs. the equivalent degree of alignment (Fig.7). Due to the second parameter G2 a family of curves is produced, so that the effective corresponding to a pair () can be found from the plot.
Knowledge of the EFG orientation and sign is not ubiquitous in Mössbauer spectroscopy. Since the correct attribution of the doublet lines to the and transitions is not always obvious, we plot in Fig.7 also the family of curves, which correspond to the false attribution. True attribution regions correspond to the bottom-left (oblate-platy) and top-right (prolate-acicular) quarters of the plot. False attribution regions correspond to the top-left (prolate-platy) and bottom-right (oblate-acicular) regions. In other words, the curves with positive slope refer to the true attribution, and the curves with negative slopes refer to the false attribution.
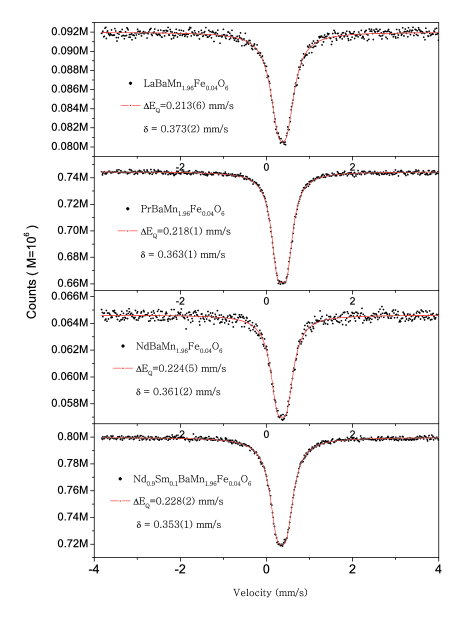
III.2.5 Oxygen-saturated phase LnBaMn1.96Fe0.04O6
In contrast to LnBaMn1.96Fe0.04O5 the left-hand line of the doublet turn to be more intense in the LnBaMn1.96Fe0.04O6 series. The swap between the and lines originates from the reversal of the sign of Here again the negative sign of is consistent with the ionic point charge model, in which only the charges in first coordination sphere are taken into accountHI . The case remains unchanged. The origin of asymmetry is therefore attributable to either platy habits of the crystallites, or to oblate vibrational ellipsoids. Both of them are expected a priory and their combined effect must be additive, but not partly extinguishing each other as in above case of LnBaMn1.96Fe0.04O5. The anisotropies indicated on Fig.8 are the ”effective” values given by the sum of true and equivalent to the pair () values.
The negative quadrupole splitting decreases with decreasing the size of Ln. This is in agreement with the ionic point charge modelHI . The absolute value of EFG correlates with distortion . In agreement with abrupt change of distortion between Sm and Nd as shown in Fig.3 the absolute value of abruptly drops from 0.7 mm/s to 0.2 mm/s as the Ln size increases from Sm to Nd. The oxygen-saturated ”O6”-family can be thus divided into two subseries, according to their values of . The spectra of small-size and large size Ln-subfamilies are shown in Figs. 8 and 9, respectively. This observation of two subfamilies agrees well with two types of behavior in the phase diagram reported previouslyNKIOYU ; Aka . In the subfamily with small size Ln (Y, Gd, Sm) the COO is formed by the orbital stacked in sequence aabb along c-axis, and in the the large-size Ln-subfamily (Nd, Pr), the COO is not observed, while at lowering temperature the ferromagnetism first sets in at , followed by the onset at of antiferromagnetic order of so-called A-typeNKIOYU ; Aka .
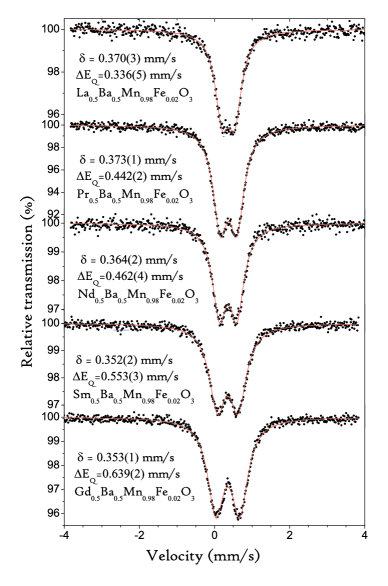
III.2.6 Cation-disordered phase Ln0.5Ba0.5Mn0.98Fe0.02O3
Mössbauer spectra for the cation-disordered phase Ln0.5Ba0.5Mn0.98Fe0.02O3 are shown in Fig.10. Iron is in octahedral coordination wherein the small quadrupole splitting can be associated either with the random short-range strain in oxygen sublattice or with the randomness in the (Ba,La)-coordination sphere of the 57Fe nuclei.
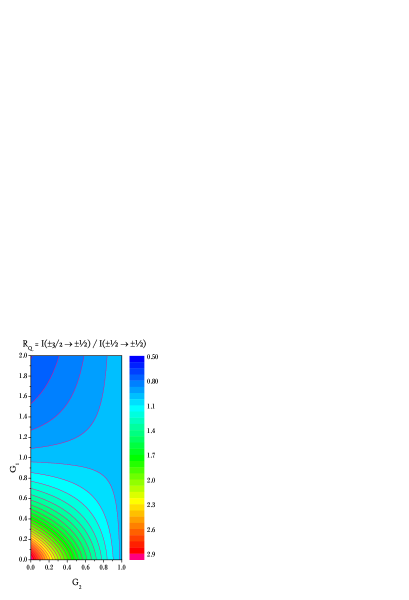
III.2.7 Mössbauer line intensities versus March-Dollase parameters
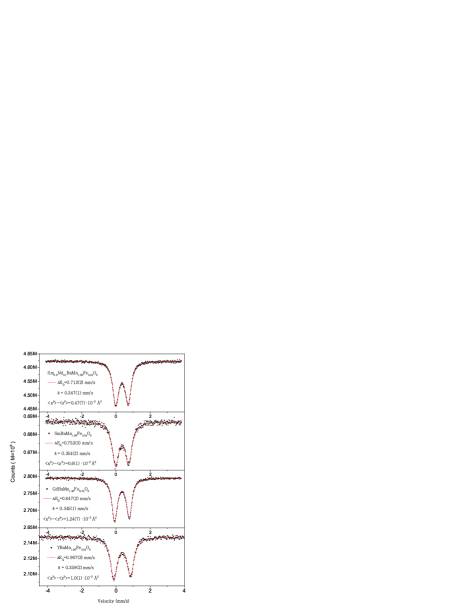
The obtained formulas (4) and (3) allow to interpret the Mössbauer line intensities in terms of the Rietveld profile parameters and . In order to compare the Rietveld and Mössbauer results we present first in Fig.11 the contour plot of the doublet asymmetries in function of and . Different values of are shown by different colors. Total ranges of variation for the alignment degree is and for the fraction of unoriented phase . In Fig.11 the ranges and are presented.
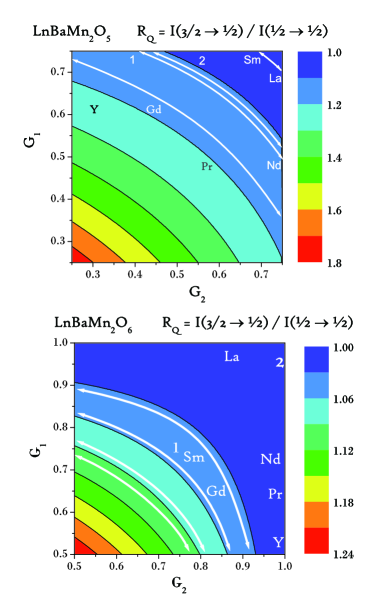
Since all the data in Table 1 indicate the platy habits with in all our LnBaMn1.96Fe0.04O5 samples, and with we select these regions in Fig.12, (a) and (b), respectively. On the other hand, both these regions correspond to the small enough experimental asymmetries for the ”O5” and ”O6”, respectively. The experimental Mössbauer doublet asymmetries from Figs. 5 and 8 are marked with the arc segments, and the data from Table 1 are indicated by chemical symbol of Ln at points with coordinates (G1,G2). Interestingly, it turns out that the effects of and on the asymmetry turns out to be approximately equal.
The detailed analysis of Fig.12 confirms the suggested above picture. In the ”O5” series (Fig.12, top), the asymmetry indicated by symbols is stronger than the asymmetry indicated by arcs. It means that GKE reduces the total asymmetry indicated by arcs. In the ”O6” series (Fig.12, bottom), the asymmetry indicated by arcs is stronger than the asymmetry indicated by symbols. It means that GKE enhances the total asymmetry indicated by arcs.
III.2.8 Theory of GKE in oriented powders
The effects of texture and GKE on spectral asymmetry are only qualitatively considered above to be additive or extinguishing. To express it more exactly, the expression for intensity ratio was formulatedPfan1 ,
| (9) |
however, the solutions were yet found either for texture effects, or for GKE, separately only. Substituting the MD function (Eq.1) for we propose a general solution for the combined effect of texture and vibrational anisotropy. A replacement of with the minimum texture function Pfan2 ; Gren makes the Eq. (10) integrable:
| (10) |
Here , is the Kummer confluent hypergeometric function, and The minimum texture function (MTF) compatible with the MD function was taken as follows:
| (11) |
with The solution (10) gives the exact solution only for small asymmetries, because MTF is only a good approximation for the MD function for close to 1. A perfect approximation for the broad range of asymmetries is given elsewhereRSUN .
III.3 Implications for the nuclear inelastic scattering (NIS)
spectroscopy
III.3.1 Putting in use the Rietveld analysis for the NIS spectra on synchrotron radiation
One of the problems, in which the well-oriented powders of platy or acicular crystallites can be useful is the problem of determination of the partial phonon density of states of 57Fe in anisotropic materials using the NIS spectroscopySeto . The vibrational density of states is conventionally derived from measuring the NIS spectra in single crystals along different crystal axis. This Section presents a proposal for the novel NIS experiments using the oriented powder samples.
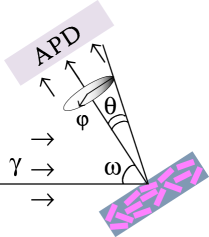
In the NIS spectrum of an anisotropic single crystal the phonon DOS is weighted by the squared projection of the phonon polarization vectors to the wave vector of the x-ray quantumKCR . Three projected densities of states () of an anisotropic layered material can be determined my measuring the single crystal spectra at three different orientations. In the uniaxially anisotropic material, the powder-averaged NIS spectrum is isotropic, however, measuring two spectra on a sample with preferred orientation of crystallites, and at different angles(Fig.13) provides the full basis for determination of both DOS functions and . For this purpose the texture of a sample should be well enough characterized, using Rietveld analysis and Mössbauer spectroscopy.
The simplest experiment that we propose for measuring two components of the uniaxially anisotropic DOS on a oriented sample involves the sample stage rotated around the horizontal axis perpendicular to the incident beam (Fig.13). Therefore, it is worth to describe the DOS in terms of the angles , and the Rietveld MD function preferred orientation parameters and .
III.3.2 Deriving the components of anisotropic vibrational DOS
Let us launch the incident beam under the angle with respect to the preferred axis (z-axis) of a platelike or a needle-like crystallite. Each DOS component is weighted by the projection of the phonon polarization vectors to the wave vector of the x-ray quantum, therefore, the phonon DOS projected on the direction defined by the angle can be written:
| (12) |
Powder averaging of the DOS consists in integrating these two terms with the volume of crystallites whose z-axis lies within the cone shell element and result in
| (13) |
Here the normalization of the texture function to unity and the notation are employed. The polar function , independent on the azimuth angle, is to replace via the coordinate transform from the frame of the beam to the frame of the rotation stage. The ratio of angular elements is and the Jacobian of this transform is . Using
| (14) |
we obtain for the uniaxial symmetry
| (15) |
Using the inegrated MD texture function (Eqs.4 and 3), we substitute and with and and obtain
| (16) |
From the Eq.(13) a couple of measurements of DOS and at the angles and leads immediately to determination of both DOS components:
| (17) |
| (18) |
where and .
IV Concluding Remarks
Two aspects of this study were dealt with the methodological and material issues. First, we proposed putting the Rietveld analysis in use for nuclear inelastic scattering spectroscopy and developed the method of derivation of the anisotropic phonon DOS from the experiments on oriented powder samples.
Second, in the material aspect of investigating the structure of doped manganites we found a seemingly contradictory events of persistence of the charge-orbital order observed in magnetization and in lattice cell dimension, coexisting with the disordered-state single-site Mössbauer spectra in most of the samples, excluding LaBaMn1.96Fe0.04O5, and, possibly, SmBaMn1.96Fe0.04O5. However, a plausible interpretation of this combination of results is given suggesting the adaptiveness of the residual short-range COO towards the quenched disorder related to the random distribution of impurities.
In oxygen-saturated state () the manganites exhibit the charge and orbital order at ambient temperature for Ln=Y, Gd, Sm, but unordered eg-electronic system for Ln=La,Pr,Nd. Fourfold increase of quadrupole splitting was observed in charge and orbitally ordered manganites compared to unordered ones. This is in agreement with the jumplike increase of distortion of reduced perovskite-like cell in the charge and orbitally ordered structures. The light (i.e. with 2%) substitution of Mn by Fe suppresses the temperatures of structural and magnetic transitions by 20 to 50 K.
V Acknowledgements
The authors acknowledge the financial support provided through joint JSPS-RFBR Grant 07-02-91201. The work at School of Engineering was additionally supported by Asahi Glass Foundation.
VI References
References
- (1) T. Nakajima, H. Kageyama, M. Ichihara, K. Ohoyama, H. Yoshizawa, and Y. Ueda, J. Solid St. Chem. 177, 987 (2004).
- (2) A.J. Williams, J.P. Attfield, and S.A.T. Redfern, Phys. Rev. B 72, 184426 (2005).
- (3) A. I. Rykov, Europhys. Lett. 85 (2009) 16003.
- (4) J.P. Chapman, J.P. Attfield, M. Molgg, C.M. Friend, and T.P. Beales, Angew. Chem. Int. Ed. Engl. 35, 2482 (1996).
- (5) J.A. McAlister, J.P. Attfield, J. mater. Chem. 8, 1291 (1998).
- (6) F. Millange, V. Caignaert, B. Domengès, and B. Raveau, Chem. Mater. 10, 1974 (1998).
- (7) T. Nakajima, H. Kageyama, H. Yoshizawa, K. Ohoyama, and Y. Ueda, J. Phys. Soc. Jpn. 72, 3237 (2003).
- (8) T. Nakajima, H. Yoshizawa and Y. Ueda, J. Phys. Soc. Jpn., 73, 2283 (2004).
- (9) D. Akahoshi, Y. Okimoto, M. Kubota, R. Kumai, T.Arima, Y. Tomioka, and Y. Tokura, Phys. Rev. B 70, 064418 (2004).
- (10) T. Nakajima, H. Kageyama, Y. Ueda, J. Phys. Chem. Solids, 63, 913 (2002).
- (11) A. Rykov, V. Caignaert, and B. Raveau, J. Solid. St. Chem. 109, 295 (1994).
- (12) V.G. Kohn, A.I. Chumakov, R. Rüffer, Phys. Rev. B. 58, 8437 (1998).
- (13) R.A. Young and D.B. Wiles, Adv. X-ray. Anal. 24, 1, (1981).
- (14) J. Rodriguez-Carvajal. Physica B 192, 55 (1993).
- (15) F. Millange, E. Suard, V. Caignaert, and B. Raveau, Mat. Res. Bull. 34, 1 (1999).
- (16) V. Caignaert, F. Millange, B. Domengès, and B. Raveau, Chem. Mater. 11, 930 (1999).
- (17) L. Er-Rakho, C. Michel, P. Lacorre and B. Raveau, J. Solid State Chem. 73 (1988) 531.
- (18) T. Nakajima, H. Kageyama, H. Yoshizawa, and Y. Ueda, J. Phys. Soc. Jpn 71, 2843 (2002)
- (19) D. Akahoshi, M. Uchida, Y. Tomioka, T. Arima, Y. Matsui, and Y. Tokura, Phys. Rev. Lett. 90, 177203 (2003).
- (20) Y. Ueda and T. Nakajima, Progr. Solid St. Chem. 35, 397 (2007).
- (21) A.A. Belik, N. Hayashi, M. Azuma, S. Muranaka., M. Takano, and E. Takayama-Muromachi, J. Solid St. Chem. 180, 3401 (2007).
- (22) Incorporated into FULLPROF program, http://www-llb.cea.fr/fullweb/powder.htm.
- (23) W.A. Dollase, J. Appl. Cryst. 19 (1986) 267-272.
- (24) H.M. Rietveld, J. Appl. Cryst. 2, 65 (1969).
- (25) A.A. Taskin,A.N. Lavrov, Yoichi Ando, Progr. Solid St. Chem. 35 481 (2007).
- (26) A.I. Rykov, Y. Ueda and K. Nomura, arXiv:0902.2027v1 [cond-mat.str-el].
- (27) G.K. Shenoy, G.M. Friedt, Nucl. Inst. Meth. 136, 569 (1976).
- (28) A.I. Rykov, A. Ducouret, N. Nguyen, V. Caignaert, F. Studer and B. Raveau, Hyperfine Interact. 77 (1993) 277.
- (29) A.W. Mombrú, K. Prassides, C. Christides, R.Erwin, M. Pissas, C. Mitros, and D. Niarchos, J. Phys.: Cond. Mat. 10, 1247 (1998).
- (30) H.-D. Pfannes and U. Gonser, Appl. Phys. 1, 93 (1973).
- (31) H.-D. Pfannes and H. Fisher, Appl. Phys. 13, 317 (1977).
- (32) J.-M. Greneche and F. Varret, J. Phys. C15, 5333 (1982).
- (33) A.I. Rykov, M. Seto, Y. Ueda and K. Nomura, arXiv:0902.1801v1 [cond-mat.mtrl-sci]
- (34) M. Seto, Y. Yoda , S. Kikuta , X.W. Zhang and M. Ando, Phys. Rev. Lett.74, 3828 (1995).
VII Figure Captions
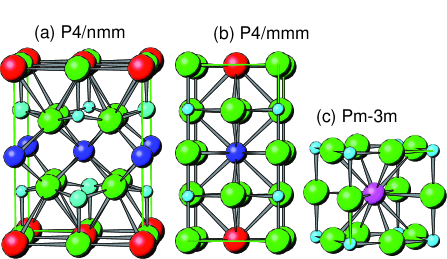
Fig.1. The crystal structures and symmetry groups of the layer-ordered LnBaMn2O5(a), LnBaMn2O6(b) and disordered Ln0.5Ba0.5MnO3 (c).
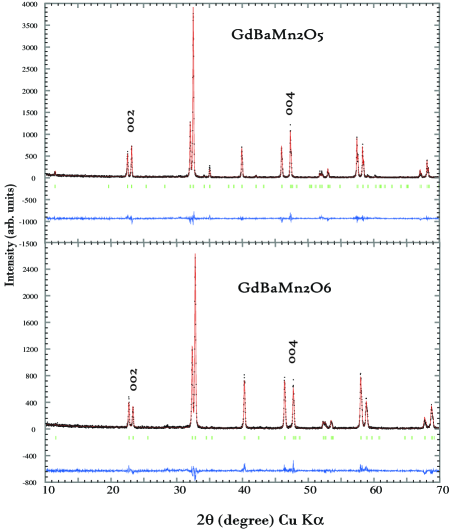
Fig.2. Powder x-ray diffraction patterns of the tetragonal phases of GdBaMn1.96Fe0.04O5 and GdBaMn1.96Fe0.04O6 refined using space groups (No. 129) and (No.123), respectively.
Fig.3. Lattice parameters of the reduced perovskite-like cell vs. volume of this cell. Sm0.9Nd0.1BaMn1.96Fe0.04Ox and Sm0.1Nd0.9BaMn1.96Fe0.04Ox are denoted by ”1” and ”2”, respectively.
Fig.4.Magnetic susceptibility measured in the external field of 1 kOe per mole of formula units in LnBaMn1.96Fe0.04O6 for Ln=Y, Sm and (Nd0.9Sm0.1). The zero-fied-cooled magnetization was measured at heating the samples up to of 600 K (Ln=Y), 400 K (Ln=Sm) and 370 K (Ln=Nd0.9Sm0.1) and then at cooling from . The arrows indicate the temperatures of phase transitions in corresponding pure LnBaMn2O6 without Fe substitution as reported previouslyNKIOYU ; NYU .
Fig.5. Mossbauer spectra in oriented samples of 57Fe-doped oxygen-poor series of the A-site ordered layered manganites LnBaMn1.96Fe0.04O5. Fitted values of isomer shift, quadrupole splitting, and area asymmetry are indicated on the spectra. The spectra are fitted with one or two asymmetric doublets. Meltdown of Mn2+/Mn3+charge order results in single-site spectra for 57Fe, while residue of the second doublet is attributed to the remainder of the charge/orbital order.
Fig.6. Determination of the parameters of texture and vibrational anisotropy starting from the ratio of line intensities of Mössbauer doublet. Either texture or GKE is supposed to be a single source of spectral asymmetry. Strength of preferred orientation is plotted vs. spectral asymmetry for four values of the fraction of unoriented phase .
Fig.7. The equivalent vibrational anisotropy parameter versus degree of alignment at four values of the unoriented phase . The curves with positive slope refer to the true assignment, and the curves with negative slopes refer to the false assignment of the doublet lines to the and transitions.
Fig.8. Mossbauer spectra in oriented samples of 57Fe-doped oxygen-rich series of the charge and orbitally ordered layered manganites LnBaMn1.96Fe0.04O6. The spectra are fitted with one asymmetric doublet. Meltdown of Mn3+/Mn4+charge order results in single-site spectra for 57Fe. Fitted values of isomer shift, quadrupole splitting, and area asymmetry are indicated on the spectra. The values of are the ”effective” anisotropies given by the sum of true and equivalent to the pair () values.
Fig.9. Mossbauer spectra in the large-size-Ln subseries of the oxygen-rich series of the A-site ordered layered manganites LnBaMn1.96Fe0.04O6 showing no COO transition. The spectra are fitted with one symmetric doublet.
Fig.10. Mössbauer spectra in disordered phase Ln0.5Ba0.5Mn0.98Fe0.02OFitted values of the quadrupole splittings and chemical shifts are indicated.
Fig.11. Contour plot of the Mössbauer spectra asymmetry versus and (Eqs. 4 and 3). The upper half of the plot corresponds to acicular habitus and the lower part of the plot correspond to the platy habitus of the crystals. Note that only the region of relatively weak degrees of alignment for acicular habitus is shown, while full range is shown for platy habitus crystallites. The region of relatively weak alignments exhibits symmetric dependence of on and .
Fig.12. Regions of vs. , plot corresponding to our samples of GdBaMn1.96Fe0.04O5 (top panel) and GdBaMn1.96Fe0.04O6(bottom panel). The arcs show the spectral asymmetries from Figs. 5 and 8 and the element symbols indicate the texturing coordinates (,) of the samples from the Table1.
Fig. 13. Geometry of nuclear inelastic scattering experiment.
References
- (1)