Blazars in hard X–rays
Abstract
Although blazars are thought to emit most of their luminosity in the –ray band, there are subclasses of them very prominent in hard X–rays. These are the best candidates to be studied by Simbol–X. They are at the extremes of the blazar sequence, having very small or very high jet powers. The former are the class of TeV emitting BL Lacs, whose synchrotron emission often peaks at tens of keV or more. The latter are the blazars with the most powerful jets, have high black hole masses accreting at high (i.e. close to Eddington) rates. These sources are predicted to have their high energy peak even below the MeV band, and therefore are very promising candidates to be studied with Simbol–X.
Keywords:
Radiation mechanisms; X–ray; –ray; blazars:
95.30.Gv; 95.85.Nv; 95.85.Pw: 98.54.Cm1 Introduction
Simbol–X will be very important for the understanding of the physics of jets by observing low power, lineless and TeV emitting BL Lacs and high power, Flat Spectrum Radio Quasars (FSRQs) with relevant broad emission lines. Both subclasses can emit most of their luminosity in the hard X–ray band. While low power BL Lacs are well known hard X-ray emitters, we here emphasise the properties of the (less known) most powerful blazar jets. They can be the most rewarding Simbol–X blazar targets.
Very low and very high power blazars are at the two extremes of the blazar sequence, since its main parameter is the apparent luminosity fossati98 . Their spectral energy distribution (SED) has two broad humps whose peak frequencies increase as the total luminosity decreases. At the same time, the dominance of the high energy hump over the low energy one increases with luminosity. This sequence has been interpreted in terms of radiative cooling becoming more important with total luminosity, thus allowing the presence of high energy electrons only in low luminosity sources gg98 . In gg08 we proposed a new version of the blazar sequence, linking the jet power to the accretion rate of the associated disk, and pointing out the importance of the mass of the black hole, governing the distance scale where most of the jet dissipation occurs. This is a crucial quantity, since it determines the value of the magnetic field in the emitting region, and controls, in high power blazars, the amount of radiation produced externally to the jet, whose photons are the seeds for the “external” inverse Compton (EC) process. Thus the shape of the SED and the ratio between the inverse Compton to the synchrotron luminosity (called “Compton dominance”) depends on , as investigated in gg09 . As a source of seed photons, we included the radiation from the accretion disk and its X–ray corona, the broad line region (BLR), an infrared emitting torus and the cosmic microwave background.
2 Low power BL Lacs
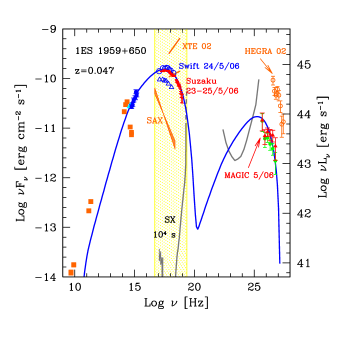
Low power jets, and their progenitor FR I radio–galaxies, are likely associated to radiatively inefficient accretion disks, accreting at a small fraction (i.e. ) of the Eddington rate. Thus the ionising radiation is small, and the BLR, even if it can be present (as in BL Lac itself), should be located very close to the black hole. Dissipation distances of order of a few hundreds of Schwarzschild radii imply that most of the jet luminosity is emitted in a “photon clean” environment, with no (or weak) external seed photons (apart from the possible presence of an emitting slow “layer”, see below). Consequently, the high energy emission is due to the self–Compton mechanism (SSC). Fig. 1 shows one example, 1ES 1959+650 (data in gt08 ). The synchrotron flux peaks at a few keV, ensuring the presence of high energy electrons, producing, by their SSC emission, a peak at hundreds of GeV. There are other, even more extreme BL Lacs, like Mkn 501, 1ES 1101–232 pian ; aharonian ; wolter , with synchrotron peaks above 100 keV. Low power BL Lacs are therefore the best TeV candidates. Fig. 1 shows also the sensitivity curve of Simbol-X for an exposure time of s, to illustrate that even with a relatively short exposure it is possible to study the spectrum and the variability of these kind of sources, up to 100 keV. Among the most interesting topics to be studied there are: i) to find possible lags between different X–ray frequencies, including the unexplored 10–100 keV range. This gives information on the cooling/acceleration process (i.e. cooling electrons should produce lags between high and low frequency fluxes, while shock accelerated electrons should correspond to the opposite behaviour, see e.g. kirk . ii) We can study trends in the X–ray spectral variability. This can shed light on the way the dissipation occurs: if the variability has a random character, then it can be produced by different emitting region varying independently. This is what the “internal shock model” predicts (spada ; guetta . If there are well defined trends, then a “standing shock model” is favoured (see, e.g. the discussion in gt08 and Fig. 1). iii) Electrons emitting at 10–100 keV by synchrotron emit around or above the peak of the SSC one. Coordinated campaigns can tell if both fluxes are coming from the same electrons. iv) If so, the detailed knowledge of the synchrotron spectrum helps to model the high energy one, and therefore to put constraints on the amount of – absorption suffered by high energy photons from the IR cosmic background.
3 High power blazars
We now turn to the other extreme of the blazar sequence, stretching it to very large values of the jet power. It is sensible to measure jet powers in units of the Eddington luminosity of the associated accretion disk (see e.g. gg08 ). “Large” therefore means close to Eddington.
3.1 Powerful blazars with different black hole masses
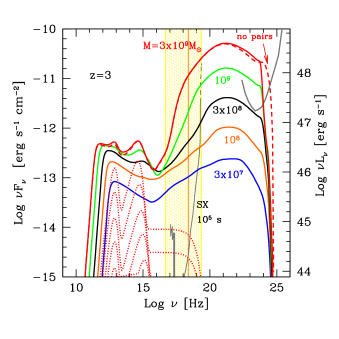
For illustration, the left panel of Fig. 2 shows the predicted SED produced by FSRQs with different black hole masses (from to ) scaling and the jet power with the Schwarzschild radius and the Eddington luminosity, respectively. The Poynting flux carried by the jet is a fraction of its total power , assumed to be constant all along the jet, so which follows from const. We then have since we assume const. For all our cases, the dissipation occurs within the BLR, which yields a constant radiation energy density (we assume and the same for all sources). As a consequence, the ratio . This is the reason of the increasing dominance of the inverse Compton emission increasing the black hole mass. This implies that blazars with large black hole masses should preferentially be more Compton dominated, and therefore more easily detected by the Fermi satellite. In fact, in Fig. 1 one can see the 5 sensitivity of Fermi for 1 year of operation (grey line), suggesting that, at high redshifts, the detected blazars will preferentially have large black hole masses.
Also the importance of the EC relative to the SSC emission increases with the black hole mass, hardening the X–ray spectral shape. For the SED with we show the effects of neglecting the – absorption and the consequent reprocessing (dashed line). The effect is modest, since the primary spectrum breaks at GeV energies due to the decreasing, with energy, Klein–Nishina scattering cross section. This figure shows that there are many high power jets with intermediate black hole masses that are undetectable by Fermi, but are well visible by Simbol–X. It will be hard for Simbol–X to serendipitously discover these blazars, due to its small field of view, but good targets for Simbol–X can come from the BAT/Swift and/or the INTEGRAL surveys, that will select blazars bright in the hard X–ray range.
3.2 Up to
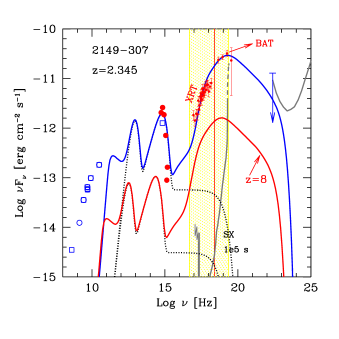
Interesting results concerning high redshift, powerful blazars have been already obtained by sambruna07 with BAT; by bassani07 with INTEGRAL and by tavecchio07 with Suzaku. One interesting blazar present in the 9–months BAT survey sambruna07 is PKS 2149–307 at . The right panel of Fig. 2 shows that the high energy peak lies in the 100 keV–MeV range. This figure shows also the the best fitting model (blue upper line) corresponding to cm, (i.e. 800 for the assumed black hole mass of ) The BAT data have large error bars, precluding the possibility to firmly claim that its high energy peak is within the BAT energy range (namely, at keV), but this possibility is indeed suggested by the present data. The Simbol–X sensitivity for an exposure of s is shown by the grey line. The red lower line corresponds to the same model used to fit the blazar, but now placing it at , to demonstrate that even at these redshifts Simbol–X has the capability to detect and study this blazar, and, most importantly, find its high energy peak.
The main scientific issues to be studied include: i) we can determine the jet power in the most powerful sources, by the knowledge of the peak of the SED, that ii) will also depend upon thus giving informations on the mechanisms of jet dissipation. iii) The coordinated variability will tell if simple one–zone models are viable. iv) High power blazars should have a visible UV bump, allowing to directly study the jet/disk connection and the ratio of their respective powers.
4 Radio–galaxies
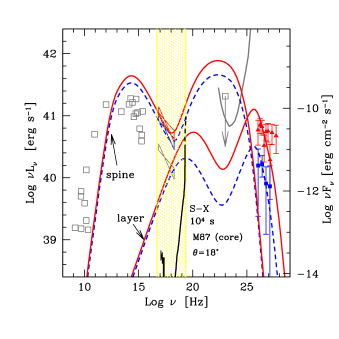
The typical bulk Lorentz factor , in blazars, is in the 10–20 range, and there seems to be the need, in flaring TeV blazars, to have even more extreme around 50 to overcome spectral and variability difficulties konopelko ; begelman . Therefore the typical beaming angle . Radio–galaxies, being observed at much larger angles, should be therefore strongly de–beamed. On the other hand, there is the possibility that the jet has a velocity structure, being faster in its spine, and being surrounded by a slower layer. If this layer is emitting, there is an interesting radiative interplay between the spine and the layer: both components see the emission from the other amplified by beaming (due to the relative motion). The extra photons are used as seeds for the inverse Compton emission, which is then more intense for both the spine and the layer. In gtc05 we have studied the SED resulting from assuming a fast spine–slow layer jet structure, finding that i) radio–galaxies can be relatively strong high energy emitters, and ii) that when the radiative interplay between the layer and the spine is strong, the latter can decelerate, due to Compton drag, helping to explain the small apparent VLBI velocity piner08 .
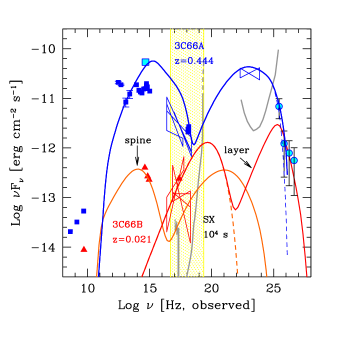
We have then applied this model to two radio–galaxies observed in the TeV range (M87 and 3C 66B, tavecchio08 ; tg09 , whose SED are shown in Fig. 3. According to the spine/layer interpretation, the SED of M87 is dominated by the spine emission at all but the TeV energies, where the layer dominates. The predicted X–ray spectrum shows an upturn at 10 keV, that Simbol–X can confirm (or not) with a relatively inexpensive exposure of s (see the plotted sensitivity curve on the same figure).
For 3C 66 (A and B), the origin of the high energy emission is still debated aliu09 , since the two sources are separated by 6’, close to the angular resolution of MAGIC. If our model is correct, the synchrotron flux of 3C 66B should peak at 100 keV, and this is can again be confirmed by Simbol–X with a relatively short exposure of s. In this case the layer dominates the emission above the UV band.
References
- (1) G. Fossati, L., Maraschi, A. Celotti, A. Comastri & G. Ghisellini, MNRAS, 299, 433 (1998)
- (2) G. Ghisellini, A. Celotti, G. Fossati, L. Maraschi & A. Comastri, MNRAS, 301, 451 (1998)
- (3) G. Ghisellini, G. & F. Tavecchio, MNRAS, 387, 1669 (2008)
- (4) G. Ghisellini & F. Tavecchio, subm. to MNRAS (astro–ph/0902.0793) (2009)
- (5) G. Tagliaferri, L. Foschini, G. Ghisellini, et al., ApJ, 679, 1029 (2008)
- (6) E. Pian, G. Vacanti, G. Tagliaferri et al., ApJ, 491, L17 (1998)
- (7) F. Aharonian, A.G. Akhperjanian, A.R. Razer–Bachi et al. Nature 440, 1018 (2007)
- (8) A. Wolter, F. Tavecchio, A. Caccianiga, et al. A&A 357, 429 (2000)
- (9) J. Kirk, F. Rieger, & A. Mastichiadis, emphA&A 333, 452 (1998)
- (10) M. Spada, G. Ghisellini, D. Lazzati & A. Celotti, MNRAS, 325, 1559 (2001)
- (11) D. Guetta, G. Ghisellini, D. Lazzati & A. Celotti, A&A, 421, 877, (2004)
- (12) R.M. Sambruna, F. Tavecchio, G. Ghisellini, et al. ApJ, 669, 884 (2007)
- (13) L.Bassani, R. Landi, A. Malizia et al., ApJ, 669, L1 (2007)
- (14) F. Tavecchio, L. Maraschi, G, Ghisellini, et al., ApJ, 665, 980 (2007)
- (15) F. Aharonian, A.G. Akhperjanian, A.R. Bazer-Bachi, et al., Science, 314, 1424 (2006)
- (16) F. Tavecchio & G. Ghisellini, G. MNRAS, 385, L98 (2008)
- (17) E. Aliu, H. Anderhub, L.A. Antonelli, et al., ApJ in press (2009) (astro–ph/0810.4712)
- (18) F. Tavecchio & G. Ghisellini, G. MNRAS, submitted
- (19) A. Konopelko, A. Mastichiadis, J. Kirk, O.C. de Jager & F.W. Stecker, ApJ, 597, 851 (2003)
- (20) M.C. Begelman, A.C. Fabian & M.J. Rees, MNRAS, 384, L19 (2008)
- (21) G. Ghisellini, F. Tavecchio & M. Chiaberge, A&A, 432, 401 (2005)
- (22) B. Piner, N. Pant & P.G. Edwards, ApJ, 678, 64 (2008)