Vibrational entropy and the structural organization of proteins
Abstract
In this paper we analyze the vibrational spectra of a large ensemble of non-homologous protein structures by means of a novel tool, that we coin the Hierarchical Network Model (HNM). Our coarse-grained scheme accounts for the intrinsic heterogeneity of force constants displayed by protein arrangements and also incorporates side-chain degrees of freedom.
Our analysis shows that vibrational entropy per unit residue correlates with the content of secondary structure. Furthermore, we assess the individual contribution to vibrational entropy of the novel features of our scheme as compared with the predictions of state-of-the-art network models. This analysis highlights the importance of properly accounting for the intrinsic hierarchy in force strengths typical of the different atomic bonds that build up and stabilize protein scaffolds.
Finally, we discuss possible implications of our findings in the context of protein aggregation phenomena.
pacs:
87.15.-v,87.14.et,87.15.bdAuthor summary
The intricate structure/dynamics/function relations displayed by proteins are at the core of life itself. Yet, a thorough and general understanding of such interplay still remains a formidable task, at the frontier of physics and biology. Proteins perform their functions while fluctuating at room temperature about their native folds. As a consequence, the entropic contribution to their free energy landscapes, i.e. vibrational entropy, constitutes a crucial element to decipher the dynamical bases of protein functions. In this study, we examine a whole database of highly-non-homologous protein structures in the effort of rationalizing the entropic contributions of the distinct secondary structure motifs in protein scaffolds. With the help of a novel coarse-grained model, we measure a significant correlation between secondary structure content and vibrational entropy, thus shedding light into the structural roots of protein flexibility. Finally, we discuss our findings in the context of the unsolved problem of protein aggregation.
I Introduction
In its native state a protein fluctuates around a configuration corresponding to the absolute minimum of its energy landscape. However, realistic energy landscapes are characterized by many competing minima. Protein folding can therefore be viewed as the process of selecting the right minimum among many others. Since proteins perform their function at finite temperatures, the entropy of their native states concurs in determining their stability even when folding is driven mainly by an enthalpic bias. When only one basin of the energy landscape is significantly visited, as it happens for folded proteins, entropy is mainly contributed by fluctuations around the minimum – it is all vibrational entropy.
Native states are highly compact structures, characterized by the presence of secondary structure motifs, such as -helices and -sheets. In turn, the vibrational properties of a heterogeneous system are typically influenced by the presence of simmetries and by its degree of modularity. It is therefore interesting to investigate whether a correlation exists between the presence of and structures and vibrational entropy. Previous work has shown that both -helices and -sheets are characterized by a larger flexibility than random-coil conformations Ma et al. (2000). However, a systematic study quantifying the impact of secondary structure content on the vibrational properties of native protein conformations is lacking.
It is the aim of this paper to introduce the simplest coarse-grained model able to quantify the correlation between vibrational dynamics of proteins and their structural organization at the secondary level. A sensible starting point for such analysis is represented by the class of coarse-grained network models, that map a given protein structure on a network of point-like aminoacids interacting trough Hookean springs.
In most implementations aminoacids are taken to sit at the corresponding Cα sites and are assigned the same average mass of 120 Da. In this framework, a given native structure specifies by construction the topologies of inter-particles interactions, that is the networks of connectivities and equilibrium bonds. The patterns of low-frequency collective modes are uniquely dictated by the topology of the network of physical interactions that characterizes the native configuration Tama and Sanejouand (2001). In this sense, network models might be considered as the simplest tools to describe the low-frequency regime of protein dynamics. However, due to the coarse-graining element, such schemes are more questionable in the high-frequency part of the vibrational spectrum. This makes them unsuitable to compute vibrational entropies, which include nonlinear contributions from all modes, as it shows from its very definition
| (1) | |||||
where the last passage follows in the classical limit . As a consequence, one needs to incorporate further structural and dynamical details within the network description besides the sheer topology of connections in order to correctly compute vibrational entropies. More precisely, we are interested in capturing the structural and dynamical elements that characterize fluctuations at the scale of secondary structures. We identify three crucial features that must be taken into account.
-
A realistic hierarchy of force constants, reproducing the different strengths of bonds featured in a protein molecule. These comprise covalent bonds (such as the peptide bond along the chain), and in particular the interactions stabilizing secondary structures. i.e. hydrogen bonds, besides long-range forces such as
-
The degrees of freedom corresponding to side chains, which play a fundamental role in the spatial organization of secondary motifs. hydrophobic or screened electrostatic interactions.
-
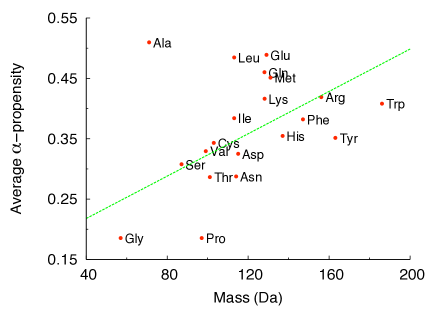
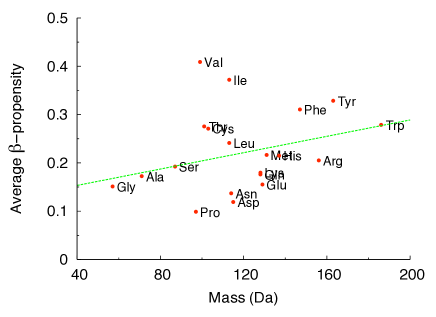
The appropriate aminoacid masses, correctly reproducing the true protein sequence. In fact, as shown in Fig. 1, residues of different mass show different and propensities. In particular light residues tend to be less represented in secondary structure motifs.
As we will show later, this analysis highlights that -rich (and -poor) native conformations tend to have a higher vibrational entropy per residue regardless of protein size and shape.
This is particularly interesting with respect to protein aggregation since protein aggregates are know to be rich in -structures. In most cases, they share the same -spine architecture characteristic of amyloid fibrils: an assembly of beta sheets perpendicular to the fibril axis. Moreover, aggregation is a rather common phenomenon for all sorts of polypeptide chains regardless of their sequence Ventura (2005). This suggests that the phenomenon should be governed by rather general laws, uniquely related to the dynamical properties of poly-peptide chains in solution. In particular, in view of the rather slow time-scales characteristic of aggregation and in view of our results on the correlation between vibrational entropy and secondary structure, it is tempting to postulate a mechanism of thermodynamic origin, that would favor the growth of structures rich in -content under quite generic conditions.
The paper is organized as follows. In the Methods section we describe the database of native structures and the models used for our analysis. In the Discussion section we discuss the features of vibrational spectra and the emergence of the observed correlation between vibrational entropy and secondary structure. Finally, we comment on the biological relevance of our results, particularly for what concerns protein aggregation phenomena.
II Methods
II.1 The database
It is our aim to conduct the most general analysis of the interplay between vibrational entropy and the content of secondary structure in a large database of protein structures. Of course, we are bound to avoid repeatedly taking into account structures corresponding to homologous proteins. We therefore chose the PDBselect database, which was explicitly built to gather the largest number of protein scaffolds by keeping the structural homology between any two structures lower than 30 % Hobohm and Sander (1994).
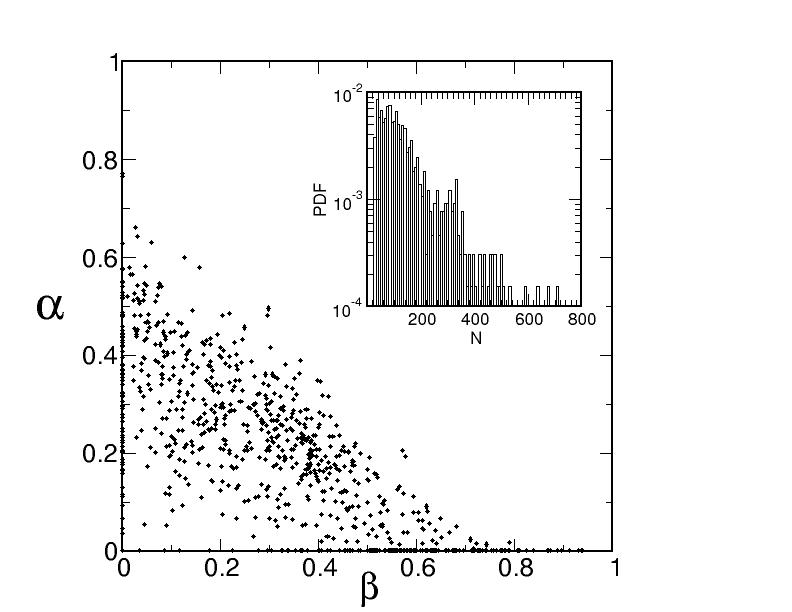
In order to illustrate the amount of structural diversity displayed by proteins from the PDBselect database, we show in Fig. 2 both the -helix and -sheet content of each structure as computed by means of the DSSP algorithm introduced by Kabsch and Sanders Kabsch and Sander (1983). We see that the two measures roughly anti-correlate, their sum being Gaussian-distributed around 50 % with a standard deviation of about 15%. As a further piece of information, we report in the inset of Fig. 2 the statistical distribution of chain lengths for all sequences contained in the database, which shows to decay exponentially. Additionally, we found no appreciable correlation between or -content and other structural indicators such as chain length or surface accessible area. On the contrary, although not surprisingly, the sum of and -content correlates positively with the number of hydrogen bonds (HB), which is indeed the principal physical interaction stabilizing both kind of motifs.
II.2 The HNM model
Our starting point is a widely employed coarse-grained scheme, the Anisotropic Network Model (ANM). Originally proposed by Tirion Tirion et al. (1995); Tirion (1996) at the all-atom level, such model has been successively reconsidered by Bahar and co-workers in the Cα approximation Doruker et al. (2000), with results in fair agreement with experiment. In the spirit of coarse-grained network models, aminoacids are modelled as spherical beads linked by Hookean springs if they are close enough in the native structure, as specified through a pre-assigned cutoff distance. Both ANM and its scalar analogue, the Gaussian Network Model (GNM) Bahar et al. (1997); Eyal et al. (2006), proved very efficient in describing the low-frequency part of protein spectra, which is dominated by large-scale, collective motions of entire domains or other structural sub-units, as measured from X-ray crystallography or electron microscopy Zheng and Brooks (2005); Tama et al. (2002); Delarue and Sanejouand (2002); De Los Rios et al. (2005); Hinsen et al. (2005); Hinsen (1998),
Let be the number of residues of a given structure and let denote the distance between the Cαs of the -th and -th aminoacids in the PDB structure 222In the spirit of elastic network models, the PDB structure is taken as an approximation of the native structure, i.e. the global minimum of the true potential energy of the system. Hence, no minimization is performed and the network of interactions is built directly from the PDB coordinates.. Then, the network of residue-residue interactions can be constructed by introducing a distance cutoff , and the corresponding connectivity matrix
| (2) |
Accordingly, the total potential energy of the Cα ANM is a sum of harmonic potentials,
| (3) |
Here measures the instantaneous elongation of the bond and is the strength of all springs connecting interacting pairs.
The ANM model is known to describe accurately long-wavelength fluctuations, such as the concerted motions of subunits or entire domains, whereas some doubts can be cast on its predictive accuracy concerning aminoacid motions at a scale comparable to the characteristic dimension of a residue. However, we are interested in computing vibrational entropies, which depend on the whole spectrum. Importantly, the contributions of high and low frequencies to the entropy are impossible to disentangle in an elementary manner, due to its strong nonlinearity. Hence, in order to increase the spectral reliability of the Cα scheme and make it more accurate in the high-frequency domain, we introduce three additional features within the standard ANM model.
-
1.
In the basic ANM protocol, all springs share the same strength, in spite of the wide differences among the real forces governing residue-residue interactions in a real protein. Hence, we introduce a hierarchy of spring constants, aimed at reproducing the strength of the most important interactions, that is covalent, hydrogen-bond and Van der Waals (VW) bonds. Consequently, we modify the potential energy function (3) as follows
(4) (5) where , and are the connectivity matrices of the three distinct sub-networks comprising all aminoacids interacting via peptide bonds along the main chain, through HBs and VW interactions, respectively. The quantities , and are the corresponding spring constants, whose magnitude is taken by construction to span two orders of magnitude. We coin this scheme the Hierarchical Network Model (HNM).
Spring constants customarily used to model covalent bonding are in the range kcal/mol/Å2. Here we chose kcal/mol/Å. A second order expansion of the Lennard-Jones potentials used to describe HB in different all-atom force fields gives values of in the range kcal/mol/Å2. We tried values of in the range with no appreciable difference in the distinctive features of the vibrational spectra. Finally, taking into account that the young modulus of covalent solids is about times that of a Van der Waals solid, we assume .
-
2.
Coarse-graining protein structure at the Cα level, one neglects all degrees of freedom associated with aminoacid side chains. However, these are known to be subject to different positional constraints in secondary structure motifs such as parallel and anti-parallel -sheets and -helices. Moreover, the entropic contribution of side chains has been recently proved fundamental in determining the free energy of protein native states Sciretti et al. (2009) Hence, we also consider a variant of the HNM model where we model side chains as additional beads, whose equilibrium position we fix at the side chain center of mass in the native structure. Furthermore, we place a covalent bond between each bead-like side chain and its corresponding carbon. In particular, given their small size, we neglect side chains of Glycines, which will be only represented by their carbon bead. We remark that this approach is utterly similar to many other unified residue models Zacharias (2003).
-
3.
Usually, in the framework of protein network models, one assigns to each carbon bead the average aminoacid mass of 120 Da. In the present study, we adopt the following convention: we split the mass of each aminoacid into a constant contribution of 56 Da, that represents the atoms lying along the peptide bond, and assign a variable mass ranging from 35 Da (for Alanine) to 150 Da (for Tryptophan) to the bead representing the side chain.
In the following, we will present results for an hybrid HNM model, whereby the above three features shall be switched on and off in the calculation of vibrational entropies. Our aim is to understand how the corresponding three physical properties affect vibrational spectra in general and vibrational entropy in particular.
III Results and discussion
It is our aim to explore the correlation of vibrational entropy with secondary structure content across the whole database. More precisely, the fil rouge of our analysis is to check whether entropic contributions might favor the formation of -sheets at high temperatures, thus in turn disfavoring -helices. In view of the positive correlation existing between the and contents, (see again Fig. 2) we shall consider in the following the correlation of entropy with a global structural indicator defined as (-content -content), which we shall refer to as -preference. Positive correlation of this quantity with entropy leads to a negative correlation with free energy at high temperatures, that will in turn favor the formation of -like structures. Conversely, a negative correlation would signal a preference towards helices. Importantly, in order to compare proteins of different lengths, we shall always consider intensive observables, namely entropies per residue.
A first analysis of the vibrational entropy of the PDBselect structures performed by means of a standard ANM model yields somewhat unintuitive results. The intensive vibrational entropy does not correlate with the -helical content (correlation coefficient 0.14) and anti-correlates very weakly with the -sheet content (correlation coefficient 0.34). This result, implying that -sheet are mildly stiffer than -helices, is manifestly at odds with the well documented rigidity of -helices. We conclude that the ANM model, although reliable at the low-frequency end of the vibrational spectra does not include a sufficient amount of detail to realistically reproduce full vibrational entropies.
III.1 The HNM model: quasi-additivity of vibrational spectra
As a first trial towards increasing the level of detail, we consider the bare HNM model, that is we introduce a three-level hierarchy of spring strengths in the framework of the standard ANM scheme as from point (i) above. Moreover, we shall switch on the different force constants one at a time first, in order to investigate the effects of the different physical interactions upon vibrational entropies. A first observation is that a roughly ten-fold separation in the intensity of force strengths is enough to induce quasi-additivity of the vibrational spectrum. In Fig. 3, we show how the vibrational spectrum of sequences 1KFM (a purely -helical protein), 1QJ9 (a -barrel) and 1LSX (36% and 36% ) change upon sequentially switching on the three different interactions.
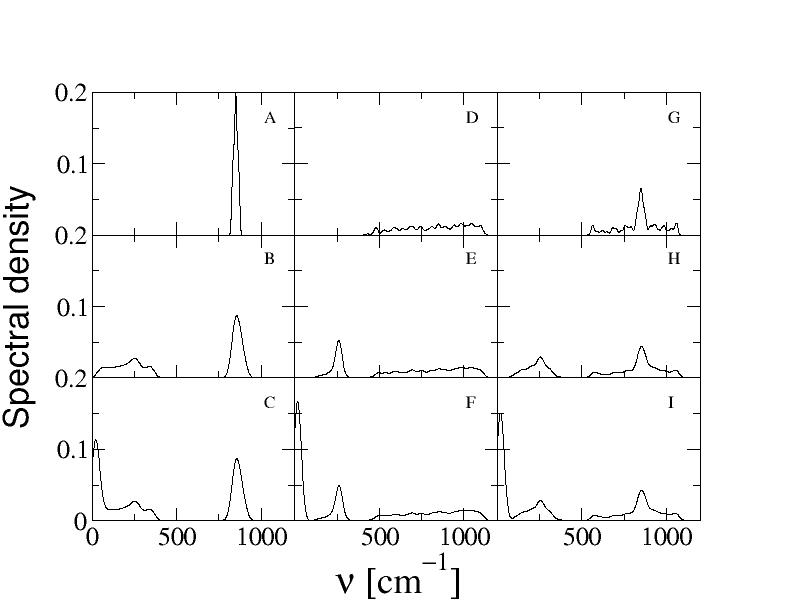
As a general remark, we observe that, for all types of structure, the bare covalent chain has only modes with non-zero frequency. More in detail, we see that the structure with dominant -helical character has a very distinctive peak at high frequency. Moreover, such feature shows to be robust with respect to the nature of residue-residue interactions. A peak is also seen to emerge in the structure as soon as the connectivity matrix starts having its off-diagonal regions populated due to HBs and VW interactions.
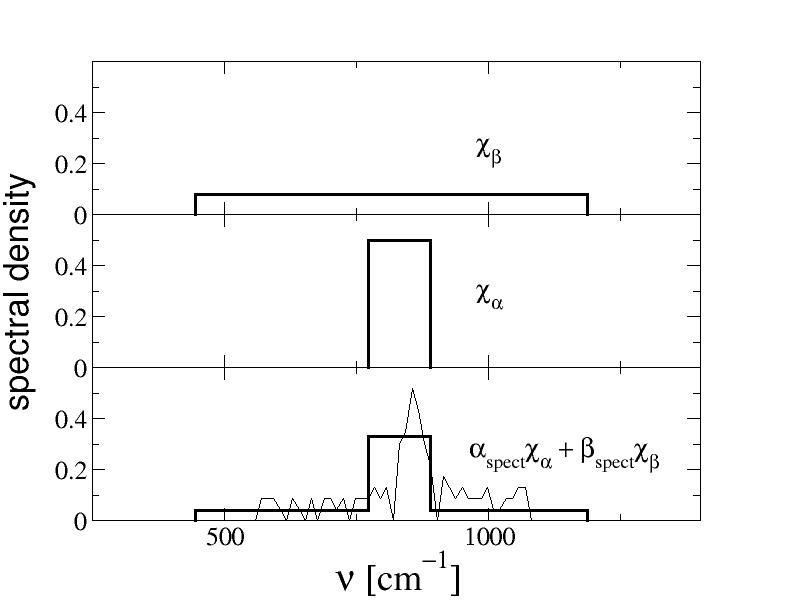
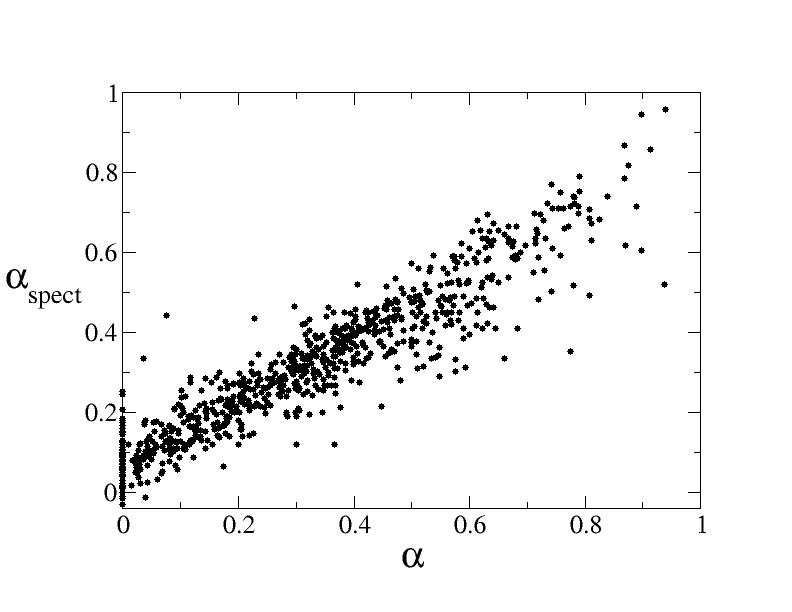
More quantitatively, we found that the high-frequency part of the spectra across all the PDBselect could be well reproduced by a linear combination of two normalized step functions and , with supports lying, respectively, in the cm-1 and cm-1 intervals as shown in Fig. 4. The two resulting coefficients and sum up to unity and might be regarded as a spectral estimate of the actual and contents. At a closer inspection, it turns out that only is a good approximation of the actual -content of the protein (see Fig. 5), while is observed to be large not only when the protein has an high beta content but also when it has no pronounced secondary structural features at all. In other words, while the -peak is a clear distinctive feature of -helices, -sheets are rather spectrally indistinguishable from unstructured regions (see the appendix for a quantitative explication of the -peak).
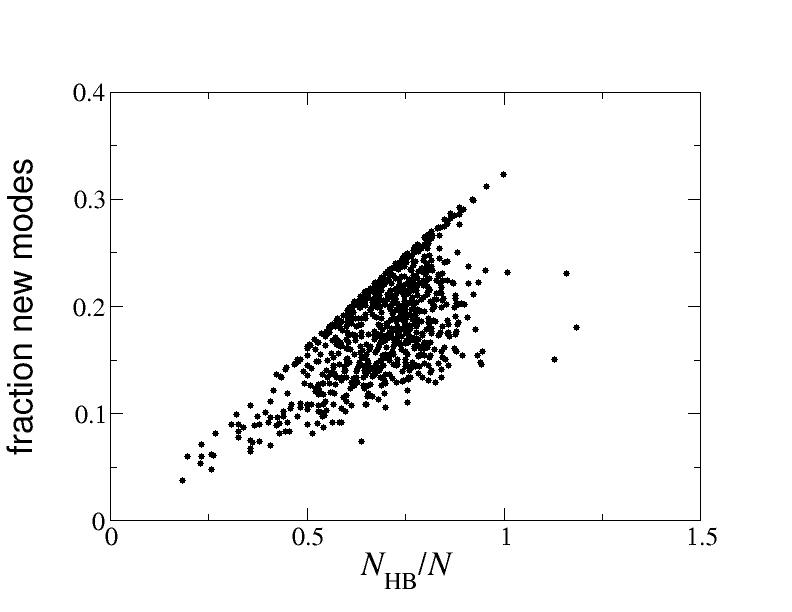
If we now turn the HBs on, vibrational spectra acquire a varying amount of new vibrational modes (between 5% and 30%), on average 18% of the total number of degrees of freedom on the entire PDB select. Perhaps not surprisingly, the quantity of such new modes turns out to be linearly correlated with the number of HBs (see Fig. 6). Furthermore, we see that the appearance of the new HB part of the vibrational spectrum only slightly modifies the spectral density at higher frequencies (compare panels B and C, E and F or H and I in Fig. 3).
Finally, adding the Lennard-Jones contribution, all the remaining modes are filled, with the exception of the expected six zero-frequency modes corresponding to rigid translations and rotations. Once again, due to the lower intensity of their driving interaction, the new LJ modes occupy the low-frequency end of the spectrum and do not modify appreciably the spectral density at higher frequencies.
III.2 The full model: entropy- secondary structure correlations
The marked differences in the spectra of and proteins described so far through the HNM Cα model do not show up in the same clear-cut fashion if one examines how the vibrational entropy depends on the type of secondary structure of the proteins: the intensive entropy shows no correlation at all with -preference (data not shown).
At a deeper thought, this is scarcely surprising, since the only detectable spectral differences between proteins of different secondary organization have already seen to be located at high frequencies, which in turn results in a negligible contribution to vibrational entropy. What is more, that part of the spectrum is also the most sensitive to the structural details of the system and consequently the least reliably captured by a coarse-grained model. In order to test the solidity of our conjectures, we must then increase the level of descriptive accuracy of the model. We have devised two ways to accomplish this, by adding additional degrees of freedom representing the side chains or adding the full sequence of aminoacid masses.
We found that both additional features independently produce the same effect, namely destroy the clear -peak versus -band picture illustrated above. However, the spectral additivity is preserved and, all the more significantly, a good correlation between intensive vibrational entropy and -preference appears, as can be clearly seen in Fig. 7 where the two observables are scatter-plotted for the full, weighted HNM model with side chains.
A systematic analysis reveals that such correlation is shaped by a complex interplay between the features that distinguish our model from the basic ANM scheme. In table 1 the arousal of the correlation between entropy and -preference is summarized by reporting both the correlation coefficient and the slope of the first order least-square fit to the data. The two best correlations achieved are reported in bold.
The best correlation is obtained when all levels of detail are present. In order to quantify their different contribution, it is useful to compute the average correlation coefficients over the four instances where a single feature is always present. For example, the average correlation coefficient is only 0.27 when side-chain coordinates are included (last four rows of table 1) and 0.29 in the four cases where true masses are taken into account (rows 2,4,6,8). On the contrary, the average correlation coefficient of 0.39 obtained by sticking to realistic interaction strengths points to a crucial role of the protein dynamical heterogeneity in reproducing vibrational modes associated with different secondary structure motifs.
Overall, the same conclusions can be drawn by calculating the correlation drops resulting from the individual elimination of single features from the complete model (last row in table 1). In particular the importance of force hierarchy is confirmed (a correlation drop of about 0.5 from rows 8 to 6). Moreover, this analysis reveals that considering equal masses also leads to the same correlation drop (rows 8 to 7). On the contrary, the elimination of side chains appears less traumatic with a limited loss of correlation (rows 8 to 4).
In summary, concerning the interplay between secondary organization and vibrational properties, the three levels of detail introduced can be ranked as follows: the hierarchy of physical interactions proves to be the most important feature, followed by mass heterogeneity and, finally, inclusion of side-chain (coarse-grained) degrees-of-freedom.
| SC | Hierarchy | Mass | Correlation | Slope |
|---|---|---|---|---|
| coefficient | ||||
| 0.239 | 0.546 | |||
| 0.123 | 0.244 | |||
| 0.261 | 0.588 | |||
| 0.555 | 0.954 | |||
| 0.253 | 0.639 | |||
| 0.106 | 0.322 | |||
| 0.106 | 0.514 | |||
| 0.634 | 1.747 |
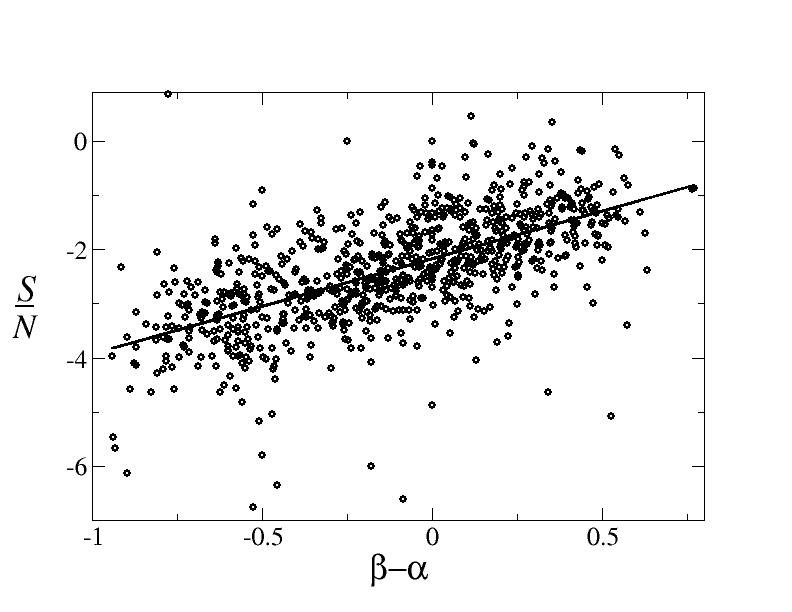
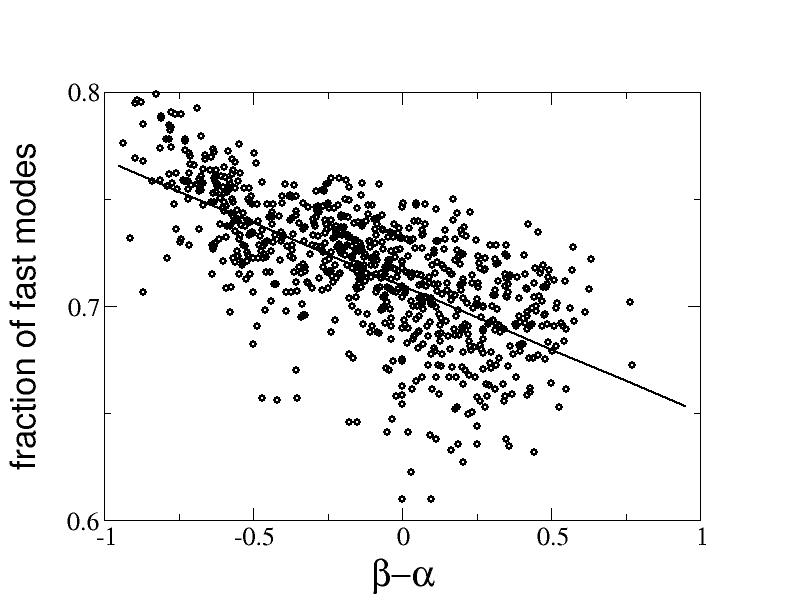
This correlation reflects a tendency of -rich architectures to host more low-frequency modes. This mechanism can better illustrated by switching off the weakest force constant in the complete model, that is shut down LJ bonds. In this case the vibrational modes with non-zero frequency describe the oscillations of the network of interactions determined by HBs and covalent bonds alone, and represent all the oscillations with wavelength shorter than or equal to the typical size of secondary structure motifs. The ratio , with the number of non-zero frequency vibrational modes in the full mode might be regarded as the fraction of modes determined by the HB and covalent interactions. This assumption appears reasonable in view of the spectral quasi-additivity discussed above. More precisely, we expect that zero-frequency modes will be filled when recovering LJ interactions, without significantly affecting the high-frequency portion of the vibrational spectrum. Fig. 8 shows that correlates negatively with the -preference. Thus, protein structures with large -preference host fewer high-frequency modes and accordingly more low-frequency ones. This, in turn, leads to larger vibrational entropies for -rich structures.
More explicitly, we have shown that eliminating all contacts but those contributed by secondary structure motifs a clear separation of and -like vibrational spectra emerges. This is further illustrated by switching off both Van der Waals interactions and HBs (data not shown). In this case we no longer observe a correlation between and -preference. Thus, chain topology alone does not introduce any clear spectral signature of secondary structure organization.
IV Conclusions and outlook
In this work we have scrutinized a wide database of non-homologous protein structures, with the aim of assessing to what extent vibrational entropy is a sensitive measure of organization at the secondary structure level. To this end, we have introduced a minimally featured coarse-grained model, that we have coined Hierarchical Network Model (HNM). At variance with current, stat-of-the-art schemes, our recipe (i) includes a hierarchy of physical interactions separating the strongest, short-range forces from the weaker, long-range ones, (ii) expands the number of degrees of freedom with the inclusion of side-chain coordinates and (iii) accounts for the appropriate aminoacid masses.
A thorough analysis of all the structures in the data set has allowed us to unveil and quantify the correlation existing between the vibrational entropy of native folds and their specific secondary structure arrangement. More precisely, we found that all the three above-listed features of the HNM are essential in order to spotlight and quantify such correlation. Remarkably, the statistical significance associated with the mixed spectral-structural signature attains its maximum value only for the full-featured scheme. Of remarkable interest is the special role played by the requirement of force heterogeneity. In fact, we have proved that the presence of a realistic hierarchy of force constants accounts for the largest contribution to the observed correlation.
As a final observation, it is interesting to discuss our results in the perspective of the widespread, yet still much debated phenomenon of protein aggregation. More precisely, concerning what physical effect could be held responsible for the overwhelming preference of mature peptidic aggregates Eisenberg et al. (2006).
The lack of clear signatures of the aggregation propensity at the sequence level Ventura (2005) suggests that the phenomenon should be governed by rather general laws, uniquely related to the dynamical properties of poly-peptide chains in solution. In particular, in view of the rather slow time-scales characteristic of aggregation, it is reasonable to postulate a mechanism of thermodynamic origin, that would favor the growth of structures rich in -content under quite generic conditions. Of course, forces of enthalpic origin represent the strongest interactions along typical aggregation pathways. However, there is no reason a-priori for the strongest forces to also encode the observed bias toward -rich structures. In fact, a composite structure developing from the aggregation of poly-peptides would likely show a tendency toward non-specific organization at the secondary structure level, thus realizing minimal frustration architectures Banavar et al. (2003).
In view of the above facts, it is tempting to rationalize the aggregation pathway as driven by strong, non-specific forces but biased toward high content of -type motifs by contributions to the total thermodynamic force that are weaker in magnitude but favor -rich architectures due to their higher density of vibrational modes at low frequencies. Hence, based on the results reported in this paper, one may speculate that the existing bias toward -rich mature aggregation products be provided by a free-energy gain in vibrational entropy. Following this speculation, the bulk of the free-energy changes occurring during aggregation would be mainly determined by increase of residue-residue contacts and decrease of solvent-exposed surface, while even tiny differences in vibrational entropy could be able to steer an aggregating system toward a -rich configuration.
Appendix A The -peak
In order to rationalize the emergence of the -peak in the HNM-Cα model, we diagonalize the Hessian matrix around a class of regular chain configurations that include both -helices and beta sheets: those characterized by fixed values of both the bond and dihedral angle. The configurations of a linear polymer composed of consecutive residues can be described by a vector
| (6) |
or ,alternatively, once is known, by means of the three vectors with . Let us now define a configuration of known dihedral angle according to the following three rules,
| (7) |
| (8) |
(bond angle must be constant) and
| (9) |
(dihedral angle must be constant). Once , and are known, can be found solving the system of two linear equations 8 and 9 and than by imposing the constraint 7. In the simplest case, , the shortest chain on which a dihedral angle can be defined, one can easily show that the eigenvalues of the Hessian of the potential
| (10) |
are nine null ones plus
| (11) |
In other words they only depend on the bond angle and they tend to peak at for . This last feature nicely explains the -peak and the -band, being the average Cα-Cα bond angle in an -helix just slightly lower than , while it is around for a -sheet.
Acknowledgements.
This work has been partially supported by EU-FP6 contract 012835 (EMBIO).References
- Ma et al. (2000) B. Ma, C.-J. Tsai, and R. Nussinov, Biophysical Journal 79, 2739 (2000).
- Tama and Sanejouand (2001) F. Tama and Y. H. Sanejouand, Protein Engineering Design and Selection 14, 1 (2001).
- Kabsch and Sander (1983) W. Kabsch and C. Sander, Biopolymers 22, 2577 (1983).
- Ventura (2005) S. Ventura, Microbial Cell Factories 4, 11 (2005).
- Hobohm and Sander (1994) U. Hobohm and C. Sander, Protein Science 3, 522 (1994).
- Tirion et al. (1995) M. Tirion, D. ben Avraham, M. Lorenz, and K. Holmes, Biophys. J. 68, 5 (1995).
- Tirion (1996) M. M. Tirion, Physical Review Letters 77, 1905 (1996).
- Doruker et al. (2000) P. Doruker, A. R. Atilgan, and I. Bahar, Proteins: Structure, Function, and Genetics 40, 512 (2000).
- Bahar et al. (1997) I. Bahar, A. R. Atilgan, and B. Erman, Folding and Design 2, 173 (1997).
- Eyal et al. (2006) E. Eyal, L.-W. Yang, and I. Bahar, Bioinformatics 22, 2619 (2006).
- Zheng and Brooks (2005) W. Zheng and B. R. Brooks, Biophys. J. 88, 3109 (2005).
- Tama et al. (2002) F. Tama, W. Wriggers, and C. L. Brooks, Journal of Molecular Biology 321, 297 (2002).
- Delarue and Sanejouand (2002) M. Delarue and Y.-H. Sanejouand, J. Mol. Biol. 320, 1011 (2002).
- De Los Rios et al. (2005) P. De Los Rios, F. Cecconi, A. Pretre, G. Dietler, O. Michielin, F. Piazza, and B. Juanico, Biophysical Journal 89, 14 (2005).
- Hinsen et al. (2005) K. Hinsen, N. Reuter, J. Navaza, D. L. Stokes, and J. J. Lacapere, Biophys. J. 88, 818 (2005).
- Hinsen (1998) K. Hinsen, Proteins 33, 417 (1998).
- Sciretti et al. (2009) D. Sciretti, P. Bruscolini, A. Pelizzola, M. Pretti, and A. Jaramillo, Proteins: Structure, Function, and Bioinformatics 74, 176 (2009).
- Zacharias (2003) M. Zacharias, Protein Sci 12, 1271 (2003).
- Eisenberg et al. (2006) D. Eisenberg, R. Nelson, M. R. Sawaya, M. Balbirnie, S. Sambashivan, M. I. Ivanova, A. O. Madsen, and C. Riekel, Accounts of Chemical Research 39, 568 (2006).
- Banavar et al. (2003) J. Banavar, F. A., M. D., A. Maritan, and T. A., ComPlexUs 1, 4 (2003).