11email: ankaramp@phys.uoa.gr 22institutetext: Institute for Astronomy and Astrophysics, National Observatory of Athens, P.O. Box 20048, GR-11810 Athens, Greece 33institutetext: Instituto de Astrofísica de Andalucía (CSIC), Apartado 3004, 18080 Granada, Spain
Star complexes and stellar populations in NGC 6822
Abstract
Aims. The star complexes (large scale star forming regions) of NGC 6822 were traced and mapped and their size distribution was compared with the size distribution of star complexes in the Magellanic Clouds (MCs). Furthermore, the spatial distributions of different age stellar populations were compared with each other.
Methods. The star complexes of NGC 6822 were determined by using the isopleths, based on star counts, of the young stars of the galaxy, using a statistical cutoff limit in density. In order to map them and determine their geometrical properties, an ellipse was fitted to every distinct region satisfying this minimum limit. The Kolmogorov-Smirnov statistical test was used to study possible patterns in their size distribution. Isopleths were also used to study the stellar populations of NGC 6822.
Results. The star complexes of NGC 6822 were detected and a list of their positions and sizes was produced. Indications of hierarchical star formation, in terms of spatial distribution, time evolution and preferable sizes were found in NGC 6822 and the MCs. The spatial distribution of the various age stellar populations has indicated traces of an interaction in NGC 6822, dated before 350 50 Myr.
Key Words.:
Galaxies: stellar content – Galaxies: structure – Galaxies: individual: star complexes1 Introduction
Stars are considered to be born inside stellar groupings, the lowest in size being OB associations. Bigger groupings, containing star clusters, OB associations, HII regions and individual bright stars, are star complexes, with an age of up to 100 Myr (Efremov 1978, 1979). Star complexes seem to be part of a continuous star formation hierarchy, in which stars form in hierarchically clustered systems from sub-parcec to kiloparcec scales, following the hierarchical distribution of the gas (Elmegreen & Efremov 1996). The study of the positions and ages of Cepheid variables in the Large Magellanic Cloud (Elmegreen & Efremov 1996) and star clusters of the same galaxy (Efremov & Elmegreen 1998), results in that star formation is not only hierarchical in space, but in time as well. Larger star forming regions have higher average ages than smaller regions, forming stars over a longer period. The above suggestions (hereafter Efremov & Elmegreen model) are confirmed in subsequent studies of the Large Magellanic Cloud (Maragoudaki et al. 1998, Livanou et al. 2006) and the Small Magellanic Cloud (Maragoudaki et al. 2001, Livanou et al. 2007). According to their sizes, star complexes are empirically divided (Efremov 1987, Maragoudaki et al. 1998, Livanou et al. 2007) into stellar aggregates, stellar complexes and stellar supercomplexes, with sizes from 150 pc to 300 pc, 300 pc to 1 kpc and greater than 1 kpc, respectively. Their properties seem to be universal, revealing their importance in the studies of star formation in galaxies and galaxy evolution.
NGC 6822 is a Local Group dwarf irregular galaxy, discovered by Barnard in 1884. It is located in a relatively isolated position of the Local Group of Galaxies, being a member of the so-called ”Local Cloud” of dwarf Irregulars (Mateo 1998), at a distance of 500 kpc. The general properties of NGC 6822 are given in Table 1.
The stellar content of NGC 6822 forms a stellar halo extended more than one degree, with the young population in a bar-like structure (P.A. 10°, Hodge 1977) and the old population elliptically distributed (Demers et al 2006). The Star Formation Rate (SFR) of NGC 6822 is supposed to have been relative low and constant during the past, but increased recently, especially in the bar. Gallart et al. (1996b) argue for an increasing SFR during the last 400 Myr in comparison to the past, which is more obvious for the last 100-200 Myr, mainly in the bar, while Wyder (2001) detects the beginning of this increase back to 600 Myr. Furthermore, Hodge (1980) has discovered an increased star cluster Formation Rate during the last 75-100 Myr and Skillman (1989) traced a low value of the N/O ratio, which is characteristic of low metallicity, active star forming dwarf galaxies.
Almost vertical to the elliptical structure of the old stellar population lies the highly disturbed elongated disk of atomic hydrogen (P.A. 130°, Weldrake et al. 2003). The most striking features of the gas disk are the 1 kpc-size Giant Hole (Hodge et al. 1991; de Blok, & Walter 2000), the SE tidal Arm and the NW Cloud (de Blok, & Walter 2000). An upper limit of 130 Myr is set for the kinematical age of the Giant Hole, while the same quantity is estimated for the tidal Arm to be around 140 Myr (de Blok, & Walter 2003, 2006).
The NW Cloud is considered by de Blok, & Walter (2000; 2006) to be a companion galaxy of NGC 6822. This ”companion” galaxy together with NGC 6822 are involved by the same authors in an interaction scenario during the last 300 Myr, giving a possible explanation to the recent Star Formation excess described above, since a strong interaction is unlikely due to the isolation of NGC 6822. The same argument is used by Weldrake et al. (2003) against a cuspy Dark Matter halo in NGC 6822. However, Valenzuela et al. (2007) argue that the rotation curve of this galaxy is consistent with a cuspy Dark Matter halo.
On the other hand, the vertical arrangement of the old stellar population of NGC 6822 respecting to the gas disk and their different kinematical properties, lead to the possibility of NGC 6822 being a Polar Ring galaxy (Demers et al. 2006). For the formation of Polar Rings strong interactions are required. The strong interaction necessary for NGC 6822 to become a Polar Ring galaxy is placed by the same authors well before 500 Myr.
The structure of this paper is as follows: Section 2 provides a description of the data we used. Section 3 contains the steps for the detection of star complexes of NGC 6822, while Section 4 deals with the size distribution of these complexes and provides a comparison with the Magellanic Clouds. Section 5 refers to the spatial distribution of the different age stellar populations of NGC 6822. Discussion and Conclusions are in Sections 6 and 7, respectively.
| Type | |
|---|---|
| R.A. (center) | |
| Dec. (center) | a |
| Dimensions | a |
| Distance | kpc b |
| Distance modulus | mag c |
| mag b | |
| E(B-V) | mag d |
| Z | |
| SFR | f |
-
a
NASA/IPAC Extragalactic Database
-
b
van den Bergh 2000
-
c
Gallart et al. 1996a
-
d
Massey et al. 2007
-
e
Skillman 1989
-
f
Mateo 1998, Israel et al. 1996
2 Data
We used the NGC 6822 stellar catalogue from the ”Local Group Survey” project (Massey et al. 2007), available on the web (ftp://ftp.lowell.edu/pub/massey/lgsurvey), based on observations using the 4-m Blanco telescope (CTIO). The catalogue includes position and UBVRI magnitudes of 51877 stars observed in, at least, the B, V and R bands. The camera consists of eight CCDs, forming a mosaic. The Field of View is about , while the scale is pixel-1. Consequently, the stellar catalogue covers the vast majority of the large scale structures of NGC 6822.
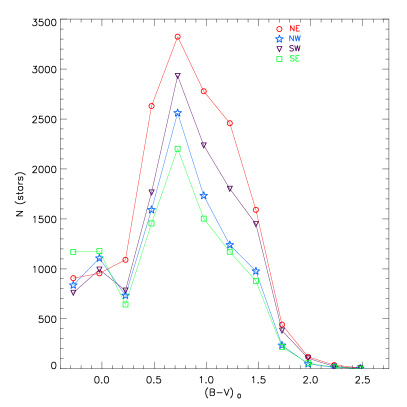
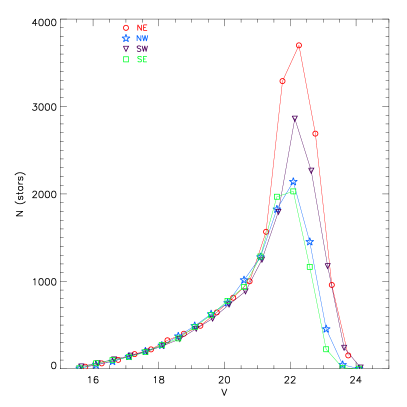
However, exposures with different Point-Spread Function (PSF) and chip-to-chip PSF variations and color responses (Massey et al. 2006), may give an erroneous spatial distribution. Therefore, we divided the catalogue of stars in four subgroups according to their relative location in the camera and produced their distribution both in colour and magnitude (Figure 1). Indeed, it appears that the detection of red and faint stars is not homogeneous across the field of the galaxy, being more efficient in the NE and SW areas of the camera. This has to be taken into account where comparing the spatial distribution of different stellar populations. On the contrary, there is not such an effect in the blue and bright stars used to determine the star complexes.
The CMD diagram of NGC 6822 is shown in Figure 2. Thirty stars were randomly selected from the stellar catalogue to illustrate the photometric uncertainties. For the majority of the stars the uncertainties are very low. However, there are considerable uncertainties in the determination of magnitude and colours of some stars, especially in the faint part of the CMD (see also Table 14 in Massey et al. 2007). Finally, the luminosity function of the stars according to their relative location in the camera (Figure 1) provides an estimation of the completeness of the data. The stellar catalogue is quite complete until .
3 Determination of Star Complexes
The Colour-Magnitude Diagram (CMD) of NGC 6822 was constructed using the ”Local Group Survey” stellar catalogue and adopting the values of 23.49 mag for the distance modulus (Gallart et al 1996a) and 0.25 mag for the reddening (Massey et al. 2007). In order to select young Main Sequence stars with an age of no more than about 100 Myr to study star complexes, there is a need for colour and magnitude cutoff limits to define a proper selection slice of the CMD. After properly fitting theoretical isochrones (Girardi et al. 2002) of Z=0.004 to the Main Sequence, we adopted the ranges and for the magnitude and the colour, respectively. The CMD diagram of NGC 6822, with the selected slice and its characteristic theoretical isochrones are shown in Figure 2. In the same Figure the photometric uncertainties are illustrated by the colour and magnitude error bars of 30 stars randomly selected from the stellar catalogue (see Section 2).

In order to properly use our data to identify the star complexes, we produced the stellar density map of the young stars of NGC 6822, which was constructed by counting stars in bins of ( pc2) and by applying a () mean-smoothing. The binning mentioned above was chosen after several tests, as the best compromise between spatial resolution and statistical significance.
To detect the star complexes of NGC 6822 we computed a density background. By using the pixels of the density map with a value greater than zero we localize the background calculation so as to be characteristic of the star formation and to avoid areas outside the galaxy which artificially lower the background value. The calculation of the background was carried out by using the method with respect to the median value. The median and standard deviation values are initially computed for all the (non zero) pixels. Then, pixels with values higher than are excluded and median and are recalculated. This procedure continues until convergence, usually after very few iterations. The final value is considered to be the minimum density cutoff limit.
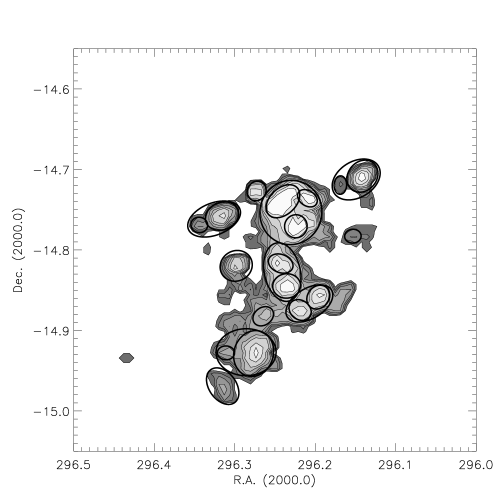
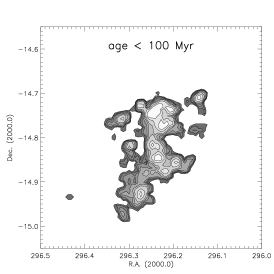
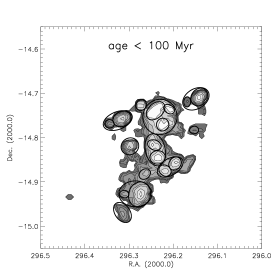
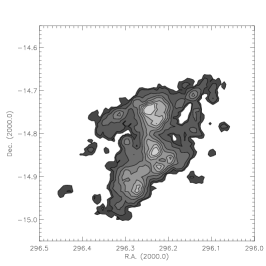
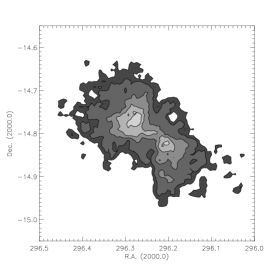
In order to map the star complexes of NGC 6822, we fitted ellipses to the external isopleth of every distinct structure or substructure above the minimum density cutoff limit. The isopleths were drawn from this limit to the maximum value of the density map with a step of one and a density range of more than two , to avoid the selection of random or controversial concentrations. In some cases optimization led us to the compromise of taking into account two subsequent isopleths to fit an ellipse. In Figure 2 the ellipses that represent the star complexes of each galaxy are over plotted on the isopleths. The center coordinates and major axis length of the ellipses are considered to be the position and size of the star complexes they outline, respectively. Table 2 lists the center coordinates (, ) and the size of each one of the detected star complexes of NGC 6822, sorted in descending order of the right ascension. They are conventionally named as NGC6822-SC-i, where SC stands for Star Complex and i ranges from 1 to 24.
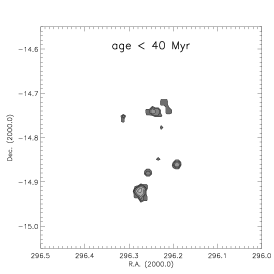
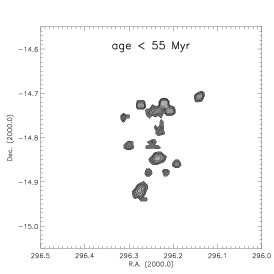
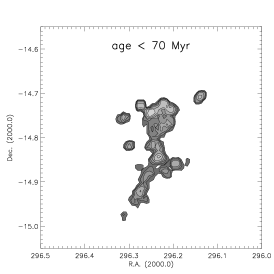
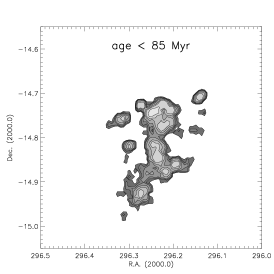
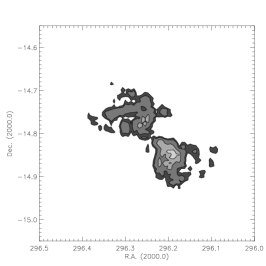
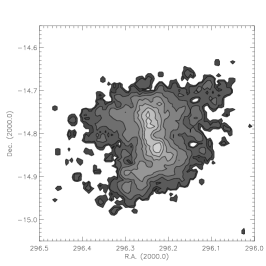
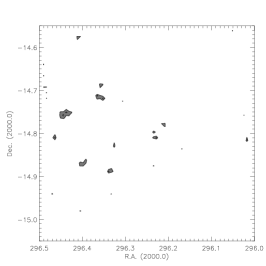
Figure 3 shows the spatial distribution of young Main Sequence stars of different maximum age, ranging from 40 Myr to 100 Myr in time bins of 15 Myr. The last plot shows the ellipses outlining the detected star complexes of NGC 6822. Structures younger than 55 Myr are clearly less extended than structures containing stars with age up to 100 Myr.
| Name | Size | ||
|---|---|---|---|
| (h m s) | (° ′ ″) | (pc) | |
| NGC6822-SC-1 | 19 45 22.58 | -14 46 08.15 | 182 |
| NGC6822-SC-2 | 19 45 18.16 | -14 45 41.62 | 600 |
| NGC6822-SC-3 | 19 45 15.80 | -14 45 28.33 | 372 |
| NGC6822-SC-4 | 19 45 15.60 | -14 58 09.05 | 440 |
| NGC6822-SC-5 | 19 45 14.62 | -14 55 40.15 | 186 |
| NGC6822-SC-6 | 19 45 11.57 | -14 49 10.96 | 356 |
| NGC6822-SC-7 | 19 45 08.62 | -14 55 37.20 | 650 |
| NGC6822-SC-8 | 19 45 06.36 | -14 55 43.11 | 504 |
| NGC6822-SC-9 | 19 45 05.48 | -14 43 36.30 | 220 |
| NGC6822-SC-10 | 19 45 03.52 | -14 52 56.50 | 240 |
| NGC6822-SC-11 | 19 44 58.30 | -14 49 00.62 | 276 |
| NGC6822-SC-12 | 19 44 57.81 | -14 49 38.96 | 643 |
| NGC6822-SC-13 | 19 44 57.62 | -14 44 21.98 | 425 |
| NGC6822-SC-14 | 19 44 56.54 | -14 50 40.89 | 302 |
| NGC6822-SC-15 | 19 44 55.26 | -14 45 12.13 | 699 |
| NGC6822-SC-16 | 19 44 53.78 | -14 46 14.05 | 251 |
| NGC6822-SC-17 | 19 44 52.51 | -14 52 28.49 | 256 |
| NGC6822-SC-18 | 19 44 50.34 | -14 44 08.74 | 232 |
| NGC6822-SC-19 | 19 44 49.75 | -14 51 59.00 | 561 |
| NGC6822-SC-20 | 19 44 47.10 | -14 51 31.00 | 275 |
| NGC6822-SC-21 | 19 44 40.52 | -14 43 09.73 | 200 |
| NGC6822-SC-22 | 19 44 36.78 | -14 46 58.26 | 179 |
| NGC6822-SC-23 | 19 44 35.79 | -14 42 44.68 | 561 |
| NGC6822-SC-24 | 19 44 33.93 | -14 42 29.95 | 371 |
4 Size distribution of star complexes - Comparison with the Magellanic Clouds
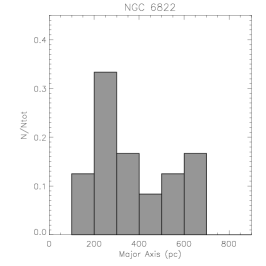
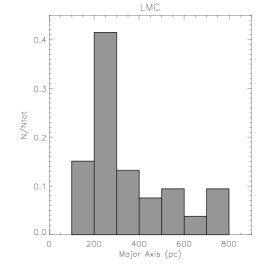
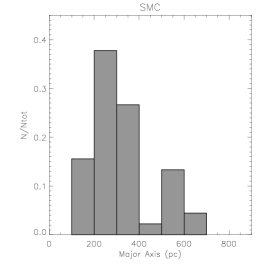
Since the star complexes have been detected, what is examined next is the distribution of their size (as it was defined in Section 3). In Figure 4 the histogram of the size distribution of detected star complexes of NGC 6822 is shown, with the same plots for the Large Magellanic Cloud (Maragoudaki et al. 1998; Livanou et al. 2006), based on optical observations, and the Small Magellanic Cloud (Livanou et al. 2007), based on infrared observations, with a common bin size of 100 pc. A few regions of the MCs with size 900 pc have been excluded for reasons of homogeneity and statistical significance. The MCs were chosen for comparison for two reasons: (a) They are our nearest neighbors in the Local Group and their star complexes are well investigated, and (b) these complexes were detected, in principal, with the same method we use in this paper. In Figure 5 the sizes of the detected star complexes of NGC 6822 and the MCs are presented, sorted in ascending order. The error for each size value was assumed to be the 10% of this value for NGC 6822 (this work) and the Magellanic Clouds (Livanou et al 2006, 2007). These plots aim to contribute in a supplementary way to the histograms described above, since they could better reveal the limits, if any, between different size groups. When carefully observing these diagrams, two main size groupings can be distinguished for the three galaxies. The first group ranges from 150 pc to 300-400 pc and the second up to 800 pc. We briefly refer to them as Group I and Group II, respectively. In order to investigate whether these size groupings are indicative of preferable size ranges of star formation in these galaxies, we compared them statistically.


If an apparently distinct group is indeed distinct, it is assumed that the size values it contains should be distributed in a uniform random way. Similarly thinking, if we combine two true distinct groups, which are self-characterized by a uniform random distribution (), their combination should not be characterized by this property any more. If it could maintain this property, then these two groupings would actually be one, in contradiction with the hypothesis that they are two different groups. So, we compared the two main apparent groupings and their combination with an equal number of uniformly random size values, limited to the same range, for NGC 6822 and the Magellanic Clouds. The comparison was repeated a thousand times to limit the impact of some possible extreme cases of random distributions.
Having to compare two equally unknown data sets of continuous data as a function of a single variable (the size), the two-tailed Kolmogorov-Smirnov (K-S) test is the most appropriate. The Null Hypothesis is that the two data sets are drawn from the same distribution. We performed these tests and compared the mean value of the significance level for each pair. Low values of this probability indicate that the two data sets are significantly different, while high values indicate that they are probably consistent with a single distribution. The results for NGC 6822 and the Magellanic Clouds are listed in Table 3.
As an extra control and verification of the procedure described above we did the following: (a) We compared two uniform random distributions a thousand times to check the mean value of the significance level, which turned up to be . This can be considered as a satisfactory value for two data sets, one being random, to be drawn from the same distribution. (b) We cut the first grouping of the LMC in half and found no consistency between these sub groupings ( significance level). This is a sufficient indicator of restriction to the apparent size groupings.
| Group I | Group II | Group I+II | |
|---|---|---|---|
| NGC 6822 | 72.7 | 72.9 | 26.2 |
| LMC | 49.7 | 64.3 | 0.2 |
| SMC | 48.5 | 72.5 | 2.1 |
The derived values of significance levels show that the apparent size groupings of the detected star forming regions could be real distinct groupings: When we compare the size values of Group I with an equal number of uniformly random size values, limited to the same range, they seem to be drawn from the same distribution. Similarly, when we compare the size values of Group II with the corresponding uniform random size values, again the Null Hypothesis seems to be correct. This is not the case when we consider Group I and Group II as one group and compare them with the corresponding uniform random distribution. Note that Group I is considered to range up to 300 - 350 pc for NGC 6822 and up to 350 - 400 pc for the MCs. Trials of the Kolmogorov-Smirnov test closely around these limits do not change the results significantly. This difference in the upper limit of the first Group between NGC 6822 and the MCs could be due to selection effects (optical or infrared data) and size determination uncertainties.
5 Stellar populations
As described in section 3, a proper selection of the young (age ) MS stars from the CMD allowed us to produce the spatial distribution of the star complexes and determine them to further investigate some of their geometrical properties. Proceeding the same way, we selected stellar populations of various ages to compare their spatial distribution. The final selection was the result of several tests aiming to trace differences in the spatial distribution of stellar populations, and to cover the most important features of the Colour-Magnitude Diagram, like the Main Sequence and the Red Giant Branch. Figure 6 shows the selected regions from the CMD outlined on it. The overplotted 300, 350 and 400 Myr theoretical isochrones are used to illustrate the separation between the young and the older populations of NGC 6822 (see also Figure 7). Table 4 lists the colour, magnitude and age limits and the dominant stellar component of the selected CMD slices.

| Selected | age | Stellar | ||
|---|---|---|---|---|
| Region | (mag) | (mag) | (Myr) | Content |
| I | - | - | MS a | |
| II | - | - | MS a | |
| III | - | - | Post MS b | |
| IV | - | - | MW stars c | |
| V | - | - | Post MS b | |
| VI | - | - | Post MS b | |
| VII | - | - | MW stars c | |
| VIII | - | - | MW stars c | |
| IX | - | - | RGs d |
-
a
Main Sequence stars.
-
b
Post Main Sequence stars.
-
c
Mostly Milky Way stars. The age range in Col. 4 is referring to NGC 6822 stars.
-
d
Red Giants.
Following the steps described in Section 3, density maps were constructed by counting stars in bins of and by applying a mean-smoothing. Isopleths were drawn for densities higher than the background level, computed using the method in respect with the median value. Figure 7 quotes the spatial distribution of the different stellar populations.
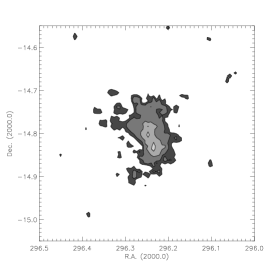
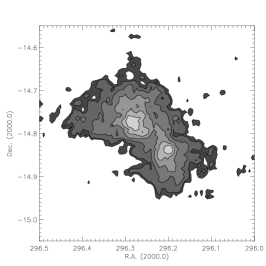
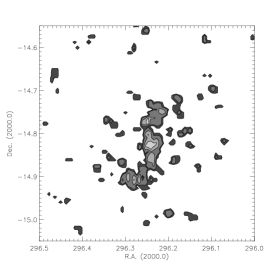
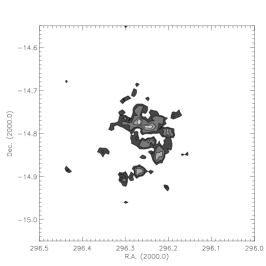
The slices I, III and V, containing young stars with an age of less than roughly 400 Myr, present the characteristic N-S bar-like structure of the young stellar content of NGC 6822. On the other hand, the slices II, VI and IX, containing older stars with an age of more than roughly 300 Myr, present the characteristic NE-SW ellipsoidal spatial distribution of the old stellar content of NGC 6822. This leads to a subdivision of the stellar populations of this galaxy into two different stellar components, according to their spatial distribution. The first one contains stars younger than 350 50 Myr, while the second one contains stars older than this age. In Figure 2, the theoretical isochrones of 300, 350 and 400 Myr illustrate this subdivision. Finally, slices IV, VII and VIII are dominated by background stars of our Galaxy and they do not have an adequate number of NGC 6822 stars to produce any particular structure.
After observing the elliptical spatial distributions of slices II, VI and IX, it is clear that there are two distinct components in the NE and SW regions of the camera, even though old populations are supposed to be dominated by the long-lasting effects of stellar mixing, resulting in smooth features. This is due to the fact that red and faint stars are expected to appear mainly in the NE and SW regions of the camera due to variations of the PSF and the color responses, affecting the spatial distribution, as it was mentioned in Section 2. Nevertheless, the general direction of the old stellar ellipse is probably unaffected, being in agreement with the Red Giants’ distribution found by Demers et al. (2006).
6 Discussion
6.1 Hierarchical star formation
The spatial distribution of the star complexes of NGC 6822, which have been detected as described above, seem to follow The hierarchical star formation scenario, in terms of the distribution of star forming regions in space and their evolution in time. Star complexes are mainly found inside larger star complexes (Figure 2). Additionally, structures younger than 55 Myr are clearly less extended than structures containing stars with age up to 100 Myr (Figure 3). These findings are in agreement with the Efremov & Elmegreen model, where star complexes are part of a continuous star formation hierarchy, following the hierarchical distribution of the gas (Elmegreen & Efremov 1996), and star formation proceeds slower in larger star forming regions than in smaller ones (Elmegreen & Efremov 1996, Efremov & Elmegreen 1998). Similar conclusions were drawn from previous studies of the LMC (Maragoudaki et al. 1998, Livanou et al. 2006) and the SMC (Maragoudaki et al. 2001, Livanou et al. 2007). However, it is not clear from this study whether the first group of detected star complexes, extended from 150 pc to 300-400 pc, is characterized by lower average ages than the second one, extended from 400 pc to 800 pc. Nevertheless, it is clear that younger star forming regions are found to be more concentrated than older ones.
Moreover, the presence of distinct groupings favors the existence of hierarchical star formation, in terms of preferable sizes, in NGC 6822 and the Magellanic Clouds. There is probably consistency with the empirically extracted hierarchy of stellar aggregates, stellar complexes and stellar supercomplexes, within a small range in the size limits between the first two groupings. From the lower scale groupings to the higher, size range increases while number of star complexes decreases. This conclusion refers to young stellar structures and it remains to be tested also for the smallest ones (OB associations). These structures were not found due to resolution restriction of the observations. If the above scheme is correct and OB associations consist another distinct group, it could be assumed that they would span a shorter size range and they would contain much more members. Both have been confirmed observationally in the MCs (Livanou 2007, PhD Thesis).
Assuming that there are preferable size groupings, it is quite clear that they cannot be detected easily from the histograms of the size distribution of star complexes, especially in the case of the LMC. This is not surprising, since there is usually a kind of arbitrariness in selecting the histogram’s bins and, in any case, binning is itself a loss of information. What they can offer most is to indicate the peak values of the size distributions. On the other hand, diagrams with sizes sorted in ascending order together with the Kolmogorov-Smirnov statistical tests, seem capable to visualize groupings, stochastically study their self-consistency and reveal their limits, providing both a qualitative and quantitative approach. Having done this procedure, histograms of size distribution of detected star complexes could be re-examined. For example, the controversial LMC bimodal structure (Figure 4) with its peaks centered on 550 pc and 750 pc is probably real.
A few very large structures with size 900 pc were also found in the MCs, three of them in the LMC and five in the SMC. Such structures were not found in NGC 6822. Whether this is related to some particular property of the galaxies, it is not clear from this investigation.
6.2 A possible strong interaction
The examination of how the different stellar populations are distributed in space reveals two different structures: The N-S bar-like structure of young stars and the NE-SW elliptical structure of the old stars. The non similar spatial distribution of young and old stars has been pointed out by previous studies (Hodge 1977; de Blok, & Walter 2003; Komiyama et al. 2003; Battinelli et al. 2003; Demers et al. 2006). What is not commented is the unlikelihood of a smooth transition from the younger structure to the older one by stellar dissemination. In a quiescent and undisturbed galaxy, one would expect that the stars, after their creation, would drift and/or participate to the expansion of the OB associations in which they were born. This would probably result in an old population embracing the observed star forming regions. In the case of NGC 6822, star formation is taking place in a large scale, along the North-South direction. The extended old stellar component, however, does not embrace the star forming regions, but it has a rather different alignment. This probably means that the huge young structure is too young to have already produced an old ’halo’ around it. This very recent and spatially extended star formation, together with the presence of the highly perturbed gas disk, bring up the possibility of a past strong event (Demers et al. 2006). Given the lack of a nearby massive galaxy to NGC 6822 which could tidally disrupt it after one or more close encounters, a merging event could be a reasonable scenario. Such an event could be responsible for the excess of the recent star formation and the asymmetric gas disk.
Whatever its nature, a strong interaction could have a lot of consequences to what has been concluded up to nowadays for NGC 6822. The interaction scenario between NGC 6822 and the NW Cloud (de Blok, & Walter 2000, 2006) could be insufficient to explain such large differences between the young and the old stellar populations. The mass of the Cloud is (de Blok, & Walter 2000), only 5 % of the total observed baryonic mass of NGC 6822 (, Weldrake et al. 2003). The suggestion that the Cloud is a separated galaxy has to be treated with caution. One of the main arguments supporting this is that the NW half of atomic hydrogen contains 20% more mass than the SE half, as measured with respect to a minor axis passing through the geometrical center. This was based on the assumption of an intrinsically symmetric gas disk (de Blok, & Walter 2000). However, from the same work it is revealed for the first time that the gas disk of NGC 6822 is highly perturbed. Additionally, if NGC 6822 has undergone a strong interaction in the past, the assumption of a symmetric gas disc could be questionable. Whether this gas Cloud is a separated galaxy needs further investigation. The indication of a strong past interaction also strengthens the argument of NGC 6822 being a Polar Ring galaxy (Demers et al. 2006), as it provides the most important prerequisite for its formation.
The young large scale structure of NGC 6822 (7) is associated with stars younger than 350 50 Myr, while the old large scale structure (which is misaligned with respect to the young one) is associated with stars older than 350 50 Myr, dating the possible strong interaction before that time. This timescale is in a satisfactory agreement with the timescales of the increase of the recent SFR and the formation of the tidal gas features (see Introduction). Furthermore, Demers et al. (2006) place the strong interaction necessary for the formation of the Polar Ring well before 500 Myr. The validity of the 350 50 Myr timescale is also confirmed by the fact that the stars of NGC 6822 probably need 400 Myr or even 500-600 Myr to mix (Wyder 2001). Thus, the time limit between the young and the old large scale structures is probably unbiased by stellar mixing.
Although from the present study there are indications that NGC 6822 could have undergone a strong and not a weak interaction in the past, it is not possible to derive certain conclusions from our data. Further investigation is needed towards a more definite answer.
7 Conclusions
We used the ”Local Group Survey” stellar catalogue of NGC 6822 to identify its star complexes. These regions were detected from the isopleths, based on counts of the young stars, above a statistical cutoff limit, resulting in a list of the positions and sizes of star complexes.
Indications of hierarchical star formation were found in NGC 6822, in terms of spatial distribution and time evolution. Star complexes are mainly found inside larger star complexes, and younger star forming structures are clearly less extended than the older ones. These findings add support to the Efremov & Elmegreen model (Elmegreen & Efremov 1996, Efremov & Elmegreen 1998), where star complexes are part of a continuous star formation hierarchy, following the hierarchical distribution of the gas, and star formation proceeds slower in larger star forming regions than in smaller ones. Additionaly, indications of hierarchical star formation in terms of preferable sizes of the star complexes were found in NGC 6822 and the Magellanic Clouds. The diagrams of the sizes of all the detected star complexes of NGC 6822 and the Magellanic Clouds, sorted in ascending order, were used along with the two-tailed Kolmogorov-Smirnov statistical test to search for different size groups: Two main groups were identified, the first one ranging from 150 pc to 300-400 pc and the second up to 800 pc. This is probably consistent with the empirically extracted hierarchy of stellar aggregates, stellar complexes and stellar supercomplexes. The smallest size groups, like OB associations, remain to be tested whether they form a distinct group.
The large scale structures of the NGC 6822 galaxy were studied by selecting stellar populations of various ages from the Colour-Magnitude Diagram and projecting their stellar content in space. It was found that the old population does not contain the young one, but rather they form two distinct structures rotated in position angle. A possible strong interaction could explain this misalignment and, given that NGC 6822 is relatively isolated in space, a merging event could be considered as a reasonable scenario. The traces of the possible strong interaction on the spatial distribution of the stellar populations are dating before 350 50 Myr, being in agreement with the recent star formation excess of this galaxy.
Acknowledgements.
We are grateful to the anonymous referee for comments and suggestions that significally improved this paper. This work was supported by the Special Account for Research Grants of the National and Kapodistrian University of Athens. We would like to thank the Local Group Survey Team for publicly releasing their data. We are also grateful to C. Gallart (Instituto de Astrofísica de Canarias, La Laguna, Spain) who kindly offered her data for tests.References
- Battinelli et al. (2003) Battinelli, P., Demers, S., & Letarte, B. 2003, A&A, 405, 563
- de Blok & Walter (2000) de Blok, W. J. G., Walter, F. 2000, ApJ, 537, L95
- de Blok & Walter (2003) de Blok, W. J. G., Walter, F. 2003, MNRAS, 341, L39
- de Blok & Walter (2006) de Blok, W. J. G., Walter, F. 2006, AJ, 131, 343
- Demers et al. (2006) Demers, S., Battinelli, P., Kunkel, W. E. 2006, ApJ, 636L, 85
- Elmegreen & Efremov (1996) Elmegreen, B. G., Efremov, Yu.N., 1996, ApJ, 466, 802
- Efremov (1978) Efremov, Yu. N. 1978, PAZh, 4, 125
- Efremov (1979) Efremov, Yu. N. 1979, PAZh, 5, 21
- Efremov (1987) Efremov, Yu. N. 1987, Ap&SS, 135, 119
- Efremov & Elmegreen (1998) Efremov, Yu.N., Elmegreen, B. G., 1998, MNRAS, 299, 588
- (11) Gallart, C., Aparicio, A., & Vìlchez, J. M. 1996a, AJ, 112, 1928
- (12) Gallart, C., Bertelli, G., & Chiosi. C. 1996b, AJ, 112, 2596
- Girardi et al. (2002) Girardi, L., Bertelli, G., Bressan, A., et al. 2002, A&A, 391, 195
- Hodge (1977) Hodge, P. W. 1977, ApJS, 33, 69
- Hodge (1980) Hodge, P. W. 1980, ApJ, 241, 125
- Hodge (1991) Hodge, P. W., Smith, T., Eskridge, P., Mac Gillivray, & H., Beard, S. 1991, ApJ, 379, 621
- Komiyama et al. (2003) Komiyama, Y., Sadanori, O., Masafumi, Y. et al. 2003, ApJ, 590, L17
- Livanou et al. (2006) Livanou, E., Kontizas, M., Gonidakis, I., et al. 2006, A&A, 451, 431
- Livanou PhD Thesis (2007) Livanou, E., 2007, PhD Thesis, National and Kapodistrian University of Athens
- Livanou et al. (2007) Livanou, E., Gonidakis, I., Kontizas, et al. 2007, AJ, 133, 2179
- Maragoudaki et al. (1998) Maragoudaki, F., Kontizas, M., Kontizas, E., Dapergolas, A., & Morgan, D. H. 1998, A&A, 338, L29
- Maagoudaki et al. (2001) Maragoudaki, F., Kontizas, M., Morgan D. H., et al. 2001, A&A, 379, 864
- Massey et al. (2006) Massey, P., Olsen, K. A. G., Hodge, P. W. et al 2006, AJ, 131, 2478
- Massey et al. (2007) Massey, P., Olsen, K. A. G., Hodge, P. W. et al 2007, AJ, 133, 2393
- Mateo (1998) Mateo, M.L. 1998, ARA& A, 36, 435
- Skillman et al. (1989) Skillman, E. D., Terlevich, R., Melnick, J. 1989b, MNRAS, 240, 563
- Valenzuela et al. (2007) Valenzuela, O., Rhee, G., Klypin, A. et al. 2007, ApJ, 657, 773
- Weldrake et al. (2003) Weldrake, D. T. F., de Blok, W. J. G., Walter, F. 2003,MNRAS, 340, 12
- Wyder (2001) Wyder, T. K. 2001, AJ, 122, 2490