Functional characteristics of a double positive feedback loop coupled with autorepression
Abstract
We study the functional characteristics of a two-gene motif consisting of a double positive feedback loop and an autoregulatory negative feedback loop. The motif appears in the gene regulatory network controlling the functional activity of pancreatic -cells. The model exhibits bistability and hysteresis in appropriate parameter regions. The two stable steady states correspond to low (OFF state) and high (ON state) protein levels respectively. Using a deterministic approach, we show that the region of bistability increases in extent when the copy number of one of the genes is reduced from two to one. The negative feedback loop has the effect of reducing the size of the bistable region. Loss of a gene copy, brought about by mutations, hampers the normal functioning of the -cells giving rise to the genetic disorder, maturity-onset diabetes of the young (MODY). The diabetic phenotype makes its appearance when a sizable fraction of the -cells is in the OFF state. Using stochastic simulation techniques, we show that, on reduction of the gene copy number, there is a transition from the monostable ON to the ON state in the bistable region of the parameter space. Fluctuations in the protein levels, arising due to the stochastic nature of gene expression, can give rise to transitions between the ON and OFF states. We show that as the strength of autorepression increases, the ONOFF state transitions become less probable whereas the reverse transitions are more probable. The implications of the results in the context of the occurrence of MODY are pointed out..
P.A.C.S. Nos.: 87.18Cf, 87.18Tt, 87.18Vf
Department of Physics, Bose Institute, 93/1, A. P. C Road, Kolkata-700009, India
1 Introduction
Positive and negative feedback loops are frequently-occurring motifs in gene transcription regulatory networks and signaling pathways [1, 2]. The components of a feedback loop are genes, proteins and other molecules which are connected by regulatory interactions. Depending on the components and their interactions, feedback loops have distinct roles in diverse regulatory systems. A regulatory interaction is positive (negative) if an increase in the amount or activity of one component increases (decreases) the amount or activity of its interaction partner. A feedback loop is positive (negative) if the number of repressing interactions is zero or even (odd). A large number of experiments and theoretical studies elucidate the major functional characteristics of feedback loops with simple structure [1, 2, 3, 4, 5, 6, 7, 8]. Positive feedback in a gene transcription regulatory network (GTRN) tends to enhance protein levels whereas negative feedback favours homeostasis ,i.e., maintenance of proteins at a desired level. The simplest feedback loop has only one component which is thus self-regulating. For such a motif in a GTRN, a protein promotes / represses its own production via autoactivation / autorepression of the expression of its gene. A positive feedback loop with two components and two regulatory interactions is of two types: double negative and double positive. Again, considering a GTRN, the protein products of the two genes in a double negative feedback loop repress each other’s synthesis. The construction of a synthetic circuit, the genetic toggle, is based on this motif [9]. The double positive feedback loop is defined by two genes, the protein products of which promote each other’s synthesis. There are several examples of two-component positive feedback loops in natural cellular networks [1, 2], a prominent example being the cell division cycle, the regulatory network of which contains both double positive and double negative feedback loops [10]. In this case, the loops control enzymatic activity. The double negative feedback loop, because of its more common occurrence, has been extensively studied in contrast to the double positive feedback loop.
The next stage of complexity in feedback loops involves linked positive and negative feedback loops [2, 11, 12, 13]. The key variables in the dynamics of feedback loops are the concentrations of the component molecules. In the case of a GTRN, these may be the protein concentrations. In a deterministic description, the time evolution of the concentrations is determined by solving a set of coupled differential equations, the number of equations being equal to the number of variables. In reality, the biochemical events associated with gene expression are probabilistic in nature and this is reflected in the presence of fluctuations (termed noise) around mean protein levels [14]. A stochastic description of time evolution is thus more appropriate. A single positive feedback loop has a tendency to amplify noise, also the time taken to reach the steady state protein level is longer than that in the case of an unregulated gene [1, 2]. Interlinking of two positive feedback loops with slow and fast dynamics results in a switch with rapid activation and slow deactivation times and a marked resistance to noise in the upstream signaling pathway [11]. Addition of a single negative feedback loop leads to rapid deactivation in the absence of the signal which activates the switch [12]. The combination of positive and negative feedback loops may give rise to excitability with transient activation of protein levels. Recent experiments suggest that competence development in B. subtilis is achieved via excitability [15].

In this paper, we study the functional characteristics of a two-gene double positive feedback loop coupled with autorepression of the expression of one of the genes. The major motivation for studying this specific motif is its presence in the GTRN controlling the pancreatic -cell function [16]. The hormone insulin is a small protein that is synthesized in the -cells and secreted when an increase in the blood glucose level is sensed. Glucose metabolism releases energy needed by cells to do useful work. Insulin is necessary to metabolize glucose and thereby control its level in the blood. Diabetes occurs due to an excessive accumulation of glucose in the blood brought about by an insufficient production of or reduced sensitivity to insulin. The core of the -cell transcriptional network consists of a double positive feedback loop in which the transcription factors and , belonging to the nuclear hepatocyte family, activate each other’s synthesis. There is also some evidence that autorepresses its own synthesis [16]. Mutations in the transcription factors and give rise to a type of diabetes known as maturity-onset diabetes of the young (MODY) which has an early onset with age less than usually years. There are six different forms of MODY of which MODY 1 and MODY 3 are caused by mutations in the genes and respectively [17]. The structure of the regulatory network, of which the two genes and are integral components, is not fully known. A partial structure of the complex network is shown in [16, 17] involving the genes and The genes collectively control the transcription of a number of important genes involved in glucose metabolism in the cell. These include the glucose transporter ( gene, the glucokinase gene encoding the glycolytic enzyme glucokinase which acts as glucose sensor and also the insulin gene. Odom et al. [18] combined chromatin immunoprecipitation assays with promoter microarrays to gain insight on the regulatory circuits formed by and Both the proteins are found to control the activity of a large number of target genes in the cell. This recent finding as well as earlier experiments [16] indicate that the and genes play a prominent role in the pancreatic cell function. Mutations in the genes give rise to MODY resulting in the impairment of glucose-stimulated insulin secretion. Several experiments [16] provide clues on the possible molecular origins of MODY. The cross-regulatory interactions between and are switched on as pancreatic -cells receive the signals to differentiate. The double positive feedback loop has the potential for bistability, i.e., two stable steady states. The two states are a basal state in which the two genes have low activity and an activated state which corresponds to high protein levels. The states are analogous to the OFF and ON states of a switch. Normal functioning of the pancreatic -cells requires the two-gene feedback loop to be in the ON state. The circuit operation is, however, vulnerable to decreased gene dosage caused by mutations (in a diploid organism each gene has two identical copies). Genetic disorders, termed haploinsufficiency, are known to occur due to reduced gene dosage resulting in decreased protein levels [19, 20, 21, 22]. Gene expression noise increases the probability that a protein level falls below a threshold value so that the protein amount is insufficient for meaningful activity. The loss of vital protein functions is responsible for the occurrence of genetic disorders. MODY, brought about by reduced gene dosage, is thus an example of haploinsufficiency [16]. We construct a mathematical model to study the dynamics of the core circuit consisting of a double positive feedback loop coupled with autorepression of the gene. We use both deterministic and stochastic approaches to identify the functional features of the motif and discuss their possible relevance in the occurrence of MODY
2 Deterministic Approach
The circuit diagram of the motif to be studied is shown in the figure 1. and represent the genes and respectively. The arrow sign denotes activation by the appropriate protein product and the hammerhead sign denotes repression. The chemical kinetic schemes corresponding to the expression of genes and are shown in figures 2(a) and 2(b). The protein products of and are denoted by and . We assume that the regulation of gene expression is mediated by the protein dimers and , and being the binding constants of dimerization. For each gene, there are two rates of protein synthesis: a basal rate ( rate constants and ) and an activated rate ( rate constants and ). In the second case, protein synthesis occurs in the activated state of the gene ( and ) attained via the binding of protein dimers and to the genes and respectively. The associated binding constants are and . The rate constants for protein degradation are and with denoting the degradation product. Dimer degradation is not taken into account as its rate is few-fold lower than the degradation rate of protein monomers. For the gene , there is an extra biochemical event representing autorepression. The dimers and bind the promoter region of the gene GS competitively, i.e., the binding of one type of dimer excludes the binding of the other type. When the dimer binds at , there is complete repression. The binding constant is denoted by .

The protein concentrations and are the dynamical variables in the system. The time scale of binding events, in general, is much faster than that of protein synthesis and degradation. The bound complexes thus reach the steady state at an earlier time point. Taking this into account, the differential rate equations describing the time evolution of the protein concentrations and are:
| (1) |
| (2) |
with
| (3) |
| (4) |
There are two conservation equations for the total concentrations and of the genes and .
| (5) |
| (6) |
After an appropriate change in variables
| (7) |
the differential rate equations (1) and (2) are transformed into
| (8) |
| (9) |
The different parameters are given by
| (10) |
The variable is dimensionless whereas the variables and have the dimensions of concentration expressed in units of [nm]. The parameters and are dimensionless while the parameters , and are expressed in units of . The dimensions of and are in units of with one gene copy corresponding to approximately . From now on, the units will not be explicitly mentioned. Table 1 displays all the parameters and rescaled parameters of the two-gene model as well as their meanings and defining formulae.


We use the software package XPPAUT [23] to probe the dynamics of the double positive feedback loop and the effect of autorepression of the proteins on the dynamics . We focus on how the steady state value of u (rescaled concentration of proteins) changes as a function of the different parameters in equations (8) and (9). In the steady state, the rates of change and are zero. Figure 3(a) shows a plot of versus when the autorepression strength given by is zero. The other parameters have values = , , , and . The plot shows that a region of bistability separates two region of monostability. The two stable states in the bistable region correspond to low and and high values of . In this region and at a specific value of , the choice between the stable steady states is history-dependent, i.e., depends on initial conditions [24]. If the value of is initially low, the system ends up in the low state. As increases, the system enters the region of bistability but continues to be in the low expression state till a bifurcation point is reached. At this point, a discontinuous jump to the high state occurs and the system becomes monostable. Bistability is accompanied by hysteresis , i.e., the value of at which the switch from the low to the high expression state occurs is greater than the value of ( the lower bifurcation point ) at which the reverse transition takes place. The two stable branches are separated by a branch of unstable steady states (dash-dotted line) which are not experimentally accessible. There are now several known systems in which bistability and hysteresis have been observed experimentally [9, 13, 25, 26, 27, 28, 29]. Figure 3(b) shows the plot of versus for the same parameter values as in figure 3(a) except that the copy number of the gene is reduced from two to one, i.e., has the value . A comparison of figures 3(a) and (b) shows that with reduced copy number the extent of the region of bistability in considerably increased. The same conclusion is reached when the steady state values of are plotted versus the parameter The region of bistability is lower in extent when the parameter a measure of the autorepression strength, is increased from zero. The value of is changed by modifying the value of (equation (10)), the binding constant for repressor binding at the gene. Figure 4 shows the phase portrait corresponding to equations (8) and (9) with the parameter values and The system is bistable for the parameter values quoted. The nullclines, obtained by putting intersect at three points, the fixed points of the dynamics. The lower and upper fixed points are stable whereas the intermediate fixed point is unstable, in fact, a saddle node [30]. The stable manifold of the saddle node divides the phase space into two basins of attraction. Trajectories starting in the lower (upper) basin of attraction end up at the lower (upper) stable fixed point as shown in figure 4. A trajectory initiated on the stable manifold stays on it and ends at the saddle node. A typical trajectory asymptotically approaches the unstable manifold as A trajectory is obtained by plotting the values of and at different time points, determined by solving equations (8) and (9). The arrow direction on a trajectory denotes increasing time.
| Parameter/Rescaled Parameter | Meaning/Defining Formula |
| Rate constants for basal protein synthesis | |
| Rate constants for activated protein synthesis | |
| Binding constants of protein dimers and | |
| Binding constants for the binding of protein dimers and at the genes and | |
| Rate constants for protein degradation | |
| Binding constant for repressor dimer binding at gene thus denotes the strength of repression | |
| , ratio of activated and basal rate constants for synthesis of S proteins | |
| ratio of activated and basal rate constants for synthesis of proteins | |
| with and kept fixed, can be varied by changing thus providing a measure of repression strength | |
| abbreviations defined in equations (3) and (4) |
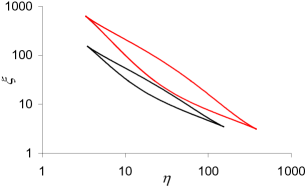
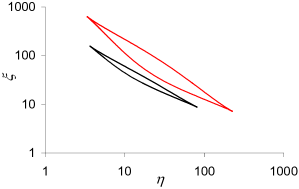
Figures 5(a) shows the plot of versus exhibiting regions of monostability and bistability. The parameter values are the same as before with and . The regions of bistability, enclosed within the red and black curves, correspond to and respectively. The difference in the locations of the two loops in the logarithmic plots clearly shows that the bistable region is of greater extent when the gene copy number is reduced from two to one. The region of bistability is decreased in extent when autorepression is taken into account (Figure 5(b) with Figure 6 shows the plot with the regions of bistability falling within the red () and black () curves respectively. The value of is changed by varying (equation 10) with .

A major advantage of combining a double positive feedback loop operating between two genes with autorepression of the expression of one of the genes lies in dosage compensation [16]. This relates to the fact that the fall in steady state protein levels, brought about by a reduction in the gene copy number, is less when autorepression is included, compared to the case when there is no autorepression. A measure of dosage compensation is provided by the quantity , termed percentage gain, defined as
| (11) |
where denotes the steady state concentration of proteins when the copy number of the gene, , is one. The parameter is a measure of the repression strength. is calculated by keeping the mean level of proteins to be the same in the two cases and when . This is achieved by adjusting the binding constant contained in the parameter in equation (10). The other parameter values are , , and . Figure 7 shows the plot of versus for the parameter values mentioned. As increases from zero, there is initially a sharp increase in the value of G followed by a slower growth which ultimately leads to a near-saturation of G values. The results obtained in the deterministic approach provide insight on the advantages of autorepression in the non-occurrence of the genetic disorder MODY. The normal functioning of pancreatic -cells requires the and protein levels to be high, i.e., the two-gene system should be in the ON state. The genesis of MODY lies in a substantial fraction of the -cells being in the OFF state. This is brought about by mutations in the and genes giving rise to a fall in the steady state protein levels. In terms of the two-gene model studied by us, the monostable high state, in which the levels of the P and S proteins are both high, represents the ON state of normal -cells. The system may enter a region of bistability, in which both the ON and OFF states are possible, due to the loss of a gene copy brought about by mutations. We will show in the next section that fluctuations in the protein levels are responsible for transitions between the ON and OFF states. In the deterministic scenario, the major advantages of the autorepressive feedback loop appear to be dosage compensation (figure 7) as well as a lesser possibility of the system being in the bistable region due to a reduction in gene copy number. The continuance of the system in the monostable high state ensures the normal functioning of cells. Similar conclusions are reached if the gene copy number is reduced from two to one. There is, however, an asymmetry in the and protein levels as the expression of the gene is not autorepressed.


3 Stochastic Approach
Consider the two-gene network to be originally in the monostable high state. In the deterministic formalism, the system continues to be in the high, i.e., ON state even if it enters the region of bistability due to the loss of a gene copy. This is due to history dependence, since the system is initially in the ON state it continues to be in the ON state in the bistable region. The protein levels corresponding to the ON state are, however, lower in magnitude in the bistable region. In the pancreatic -cells, the occurrence of MODY is possible only when a sizable fraction of cells is in the OFF state. The ONOFF and OFFON transitions can be understood only when stochasticity in gene expression is taken into account. We now give a simple physical picture of the origin of stochastic transitions [6]. In the case under consideration, the dynamical variables are the protein concentrations and . In the case of deterministic time evolution, trajectories starting in individual basins of attraction stay confined to the specific basins with no possibility of a trajectory crossing from one basin to another. In the stochastic approach, the trajectories are no longer deterministic as the dynamical variables and are fluctuating. In the deterministic case, given the initial state defined by , the trajectory is fixed in the -phase space. In the stochastic case, different trajectories are generated in repeated trials. A transient fluctuation, if sufficiently strong, switches the system dynamics from one basin to the other brought about by the excursion of the trajectory across the boundary separating the two basins of attraction. In terms of the pancreatic -cells, the switch to the OFF state hampers the normal functioning of the cells.


For proper regulatory functions as transcription factors, the and protein levels are high with an optimal value as excessive protein amounts are known to be harmful rather than beneficial [16]. In this context, it is pertinent to undertake a comparison of the functional characteristics of two-gene network models with and without the autorepressive loop and with the mean protein levels kept at the same high values in the two cases. The last condition ensures the normal functioning of the cells in both the cases. In section 2, we have identified certain advantages of the autorepressive loop as regards the system dynamics in a deterministic framework. Our goal is now to identify the desirable features of the model incorporating both a double positive feedback loop and an autorepressive loop taking the stochastic aspects of the dynamics into consideration. This is done with the help of a detailed computer simulation based on the Gillespie algorithm [31]. The algorithm enables one to keep track of the stochastic time evolution of the system. The different biochemical reactions considered in the simulation are depicted in figures 2(a) and 2(b). The reactions are sixteen in number and are given by
| (12) |
| (13) |
| (14) |
| (15) |
| (16) |
| (17) |
| (18) |
| (19) |
| (20) |
| (21) |
| (22) |
| (23) |
| (24) |
| (25) |
| (26) |
| (27) |
The different symbols are as explained in section 2. The stochastic rate constants, associated with the reactions, are C(i), i=1,…,16, in the appropriate units. The results of the simulation are shown in figures 8-9. Figures 8(a)-(d) show the distribution of protein levels, , in an ensemble of 4500 cells for repressor strengths and respectively after a simulation time of time units. The gene copy numbers are and so that the system is in the region of bistability. The values of the stochastic rate constants are ,,,, . The value of is changed by varying the stochastic rate constant . The value of the rate constant is changed to keep the mean protein levels to be the same when for all values of . The value implies that only the double positive feedback loop contributes to the dynamics. The distribution is found to be bimodal, i.e., has two distinct peaks corresponding to the OFF and ON states. In all the cases, the cells are in the ON state at time One finds that the fraction of cells in the OFF state decreases as the value of increases. In fact, when the number of cells which are in the OFF state is larger than that in the ON state. Since initially all the cells are in the ON state, a large number of ON OFF state transitions occur during the simulation time. For the reverse transition is, however, much rarer. The role of the autorepressive loop thus appears to be to reduce the number of stochastic transitions from the ON to the OFF state. This makes the occurrence of MODY, brought about by a sizeable fraction of the cell population existing in the OFF state, less probable. There are two distinct time scales over which protein fluctuations occur. The probability distribution versus has a two-peaked structure. Fluctuations on a short time scale confine the values to lie predominantly within individual peaks. The long time scale corresponds to the time at which large fluctuations occur bringing about transitions between states belonging to different peaks. The “escape time” is often very large and a quantitative measure is provided by the mean first passage time [32]. In the present case, the values of and are quite large for different values of The maximum simulation time is time units for all values of For is around time units whereas is even larger. As increases, increases whereas decreases. For is as large as Because of large escape times, the probability distribution versus is metastable on a large time scale [32]. Over shorter periods of time, the shape of the distribution remains more or less invariant.
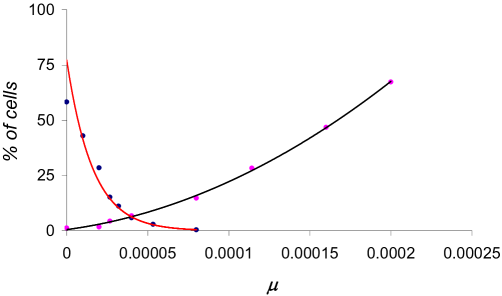
The plots in figure 9 are obtained for an ensemble of 4500 cells. For gene copy numbers and , the mean protein levels are adjusted to be the same irrespective of the values of . The parameter values are so chosen that the system is in the monostable high region. On reduction of to (one copy of the GS gene), the system enters the region of bistability and is in the ON state at time . After a period time units of stochastic time evolution, the percentage of cells in the OFF state is determined. The red curve shows this percentage as a function of the repression strength . The drop in the percentage of cells in the OFF state is found to be exponential. The black curve shows the percentage of cells in the ON state after time units, with all the cells being initially in the OFF state. One finds that with increasing , the fraction of cells in the ON state becomes larger. The autorepressive loop has the effect of making the ON state more stable and the OFF state more unstable. This feature enhances the probability of the nonoccurrence of MODY as there are infrequent transitions from the ON to the OFF state. On the other hand, the system has a lesser probability of remaining stuck in the OFF state compared to the case when there is no autorepressive loop.
4 Conclusion and Outlook
In this paper, we have studied the functional characteristics of a motif consisting of a double positive feedback loop operating between two genes and a negative feedback loop in which the protein product of one gene represses its own synthesis. The motif appears in the gene regulatory network controlling the pancreatic -cell function [16]. Loss of a gene copy due to mutations has been shown [16] to be responsible for abnormal -cell function resulting in MODY. We have studied the effect of reduced gene copy number on the dynamics of the model describing the two-gene motif. In a deterministic formalism based on differential rate equations, we identified regions of bistability in appropriate parameter regions. The stable steady states, designated as the OFF and ON states, correspond respectively to low and high protein levels. The normal -cells are expected to be in the monostable ON state. The occurrence of MODY is brought about by a fraction of -cells being in the OFF state. The ONOFF switch can occur only in the bistable region. Negative feedback reduces the extent of the bistable region making it less likely that the cellular state falls in this part of the phase diagram. The region of bistability, however, increases in size on reduction of the gene copy number making the ONOFF transitions more probable. Negative feedback also produces a mechanism of dosage compensation (figure 7). The results hold true for a wide range of parameter values. Since switching to the OFF state is detrimental, one would have thought, from an evolutionary point of view, that two genes which are constitutively ON would be more appropriate. In reality, the genes and form a positive feedback loop. Cross-regulation between the two genes is established when the pancreatic cells receive signals to differentiate [16]. The positive feedback loop provides a stable mechanism of gene expression since the two genes reset each other’s activity to the functional state under physiological perturbations. This serves to self-perpetuate the activity of the two genes and their targets in the pancreatic cells. Normal functioning of these cells requires both the protein levels to be high. The system of two genes that are constitutively ON are less robust under physiological perturbations since there is no resetting mechanism by which both the genes are in the functional ON state. The theoretical suggestions of bistability due to the existence of a positive feedback loop [16, 18], backed up by the results of our mathematical model, should be tested in actual experiments.
The ONOFF switch is brought about by protein fluctuations the origin of which lies in stochastic gene expression. Our major finding is that negative feedback makes the ONOFF transitions less probable and the OFFON transitions more probable. Thus the function of the negative feedback appears to be to protect the normal -cell function since the cell is more likely to be in the ON state in this case. The asymmetric response to fluctuations prevents switching off and facilitates switching on of the high expression state. In the deterministic scenario, one finds that the difference between the ON state and the unstable steady state protein level increases as the autorepression strength is increased whereas the difference between the unstable steady state and OFF state protein levels decreases on increasing the autorepression strength. This may explain the asymmetry in the ONOFF and OFFON switches when stochasticity is taken into account. For moderate strengths of autorepression, the system is locked in the ON state for extremely long times. In our simulations, we did not encounter ONOFF switches for very long trajectories ( seconds) with . This translates into lifetimes measured in years and explains the delayed onset of the diabetic phenotype [16]. The phenotype generally appears after several years indicating that the activation of the ONOFF switch is rare. The average age at which MODY is manifest could thus be dictated by the probability that a sufficient number of -cells is locked in the OFF state. We have considered the simplest form of negative autoregulation in our two-gene model. There are recent suggestion that negative autoregulation of the HNF-4 gene in the pancreatic -cells may be more complex [33]. Also, the number of transcription factor binding sites of the two genes is not known with certainty. Cooperative binding at multiple sites is expected to promote the stability of the gene expression states. Our two-gene motif constitutes a minimal model which seeks to explains the desirable features of combining a double positive feedback loop with an autorepressive loop vis-á-vis the normal functional activity of -cells. The insight gained from the model study is expected to provide a basis for the investigation of more complex cases.
References
- [1] Alon U 2007 Network motifs: theory and experimental approaches Nat. Rev Genet. 8 450-61
- [2] Mitrophanov A Y and Groisman E A 2008 Positive feedback in cellular control systems Bioessays 30 452-55
- [3] Becskei A and Serrano L 2000 Engineering stability in gene networks by autoregulation Nature 405 590-93
- [4] Becskei A, Seraphin B and Serrano L 2001 Positive feedback in eukaryotic gene networks: cell differentiation by graded to binary response conversion EMBO J. 20 2528-35
- [5] Maeda Y T and Sano M 2006 Regulatory dynamics of synthetic gene networks with positive feedback J. Mol. Biol. 359 1107-24
- [6] Karmakar R and Bose I 2007 Positive feedback, stochasticity and genetic competence Phys. Biol. 4 29-37
- [7] Hornung G and Barkai N 2008 Noise propagation and signaling sensitivity in biological networks: a role for positive feedback PLOS Coputatational Biology 4 0055-61
- [8] Stekel D J and Jenkins D J 2008 Strong negative self regulation of prokaryotic transcription factors increases the intrinsic noise of protein expression BMC Systems Biology 2
- [9] Gardner T S, Cantor C R and Collins J J 2000 Construction of a genetic toggle switch in Escherichia coli Nature 403 339-42
- [10] Tyson J J, Chen K and Novak B 2001 Network dynamics and cell physiology Nat. Rev. Mol. Cell Biol. 2 908-16
- [11] Brandman O, Ferrell J E, Li R and Meyer T 2005 Interlinked fast and slow positive feedback loops drive reliable cell decisions Science 310 496-8
- [12] Kim D, Kwon Y K and Cho K H 2007 Coupled positive and negative feedback circuits form an essential building block of cellular signalling pathways Bioessays 29 85-90
- [13] Acar M, Becskei A and van Oudenaarden A 2005 Enhancement of cellular memory by reducing stochastic transitions Nature 435 228-32
- [14] Kaern M, Elston T C, Blake W J and Collins J J 2005 Stochasticity in gene expression: from theories to phenotypes Nat. Rev. Genet. 6 451-64
- [15] Süel G M, Garcia-Ojalvo J, Liberman L M and Elowitz M B 2006 An excitable gene regulatory circuit induces transient cellular differentiation Nature 440 545-50
- [16] Ferrer J 2002 A genetic switch in pancreatic -cells: Implications for differentiation and haploinsufficiency 51 2355-62
- [17] Kulkarni R N and Kahn C R 2004 HNFs- linking the liver and pancreatic islets in diabetes Science 303 1311-12
- [18] Odom D T et al. 2004 Control of pancreas and liver gene expression by HNF transcription factors Science 303 1378-1381
- [19] Veitia R A 2002 Exploring the etiology of haploinsufficiency Bioessays 24 175-84
- [20] Fodde R and Smits R 2002 A matter of dosage Science 298 761-3
- [21] Cook D L, Gerber A N and Tapscott S J 1998 Modelling stochastic gene expression: Implications for haploinsufficiency Proc. Natl. Acad. Sci. 95 15641-6
- [22] Bose I and Karmakar R 2005 The Biology of Genetic Dominance (Georgetown, T X: Landes Bioscience) Chapter 6
- [23] XPPAUT (http://www.math.pitt.edu/~bard/xpp/xpp.html)
- [24] Ferrell J E 2002 Self-perpetuating states in signal transduction: positive feedback, double-negative feedback and bistability Curr. Opin. Cell Biol. 14 140-8
- [25] Sha W, Moore J, Chen K, Lassaletta A D, Yi C S, Tyson J J and Sible J C 2003 Hysteresis drives cell-cycle transitions in Xenopus laevis egg extracts Proc. Natl. Acad. Sci. 100 975-80
- [26] Pomerening1 J R, Sontag E D and Ferrell J E 2003 Building a cell cycle oscillator: hysteresis and bistability in the activation of Cdc2 Nature Cell Biol. 5 346 - 51
- [27] Ozbudak E M , Thattai M, Lim H N, Shraiman B I, Oudenaarden van A 2004 Multistability in the lactose utilization network of Escherichia coli Nature Vol. 427 737-40.
- [28] Kramer B P and Fussenegger M 2005 Transgene control engineering in mammalian cells Methods Mol Biol. 308 123-43
- [29] Karmakar R and Bose I 2007 Positive feedback, stochasticity and genetic competence Phys. Biol. 4 29-37
- [30] Strogatz S H 1994 Nonlinear Dynamics and Chaos: with Applications to Physics, Biology, Chemistry and Engineering (Cambridge: Perseus Books)
- [31] Gillespie D T 1977 Exact stochastic simulation of coupled chemical reactions J. Phys. Chem. 81 2340-61
- [32] Van Kampen N G 1997 Stochastic processes in Physics and Chemistry 2nd edn (Amsterdam: North-Holland)
- [33] Magenheim J, Hertz R, Berman I, Nousbeck J and Jacob Bar-Tana J Negative autoregulation of HNF-4 gene expression by HNF-41 Biochem. J 384
Figure Captions
Fig1. The two-gene network model. The protein products of the and genes activate each other’s synthesis. There is also an autorepressive loop in which the proteins of the gene repress their own synthesis.
Fig2. The reaction kinetic scheme of the two-gene model. The meanings of the symbols are explained in the text.
Fig3. versus curves showing bistability and hysteresis. The solid (dashed) lines represent stable (unstable) steady states for gene copy numbers (a) , and (b) , . The parameter , a measure of the autorepression strength, is zero.
Fig4. Phase portrait described by equations (8) and (9). The dark and light solid lines represent the nullclines intersecting at three fixed points. The stable and unstable fixed points are denoted by solid and empty circles respectively. The stable manifold divides the phase space into two basins of attraction. Some typical trajectories are shown with arrow directions denoting increasing time.
Fig5. Plots of versus showing regions of monostability and bistability when the parameter a measure of the autorepression strength, is zero (a) and 0.005 (b). The regions of bistability are enclosed within the red and black curves with gene copy numbers , and , respectively.
Fig6. phase diagram with the regions of bistability falling within the red (, ) and black (, ) curves respectively.
Fig7. Plot of percentage gain (equation 11) versus , a measure of the autorepression strength.
Fig8. Distribution of steady state protein levels, , in an ensemble of cells for repressor strengths (a) , (b) , (c) and (d) respectively.
Fig9. For gene copy numbers and after a time interval time units of stochastic time evolution, the percentage of cells in an ensemble of cells in the OFF state (red curve) versus the repression strength with all the cells being in the ON state at time . The black curve shows the percentage of cells in the ON state versus with all the cells being in the OFF state at .