The discovery of an M4+T8.5 binary system
Abstract
We report the discovery of a T8.5 dwarf, which is a companion to the M4 dwarf Wolf 940. At a distance of 12.50 pc, the angular separation of 32″ corresponds to a projected separation of 400 AU. The M4 primary displays no H emission, and we apply the age-activity relations of West et al. to place a lower limit on the age of the system of 3.5 Gyr. Weak H absorption suggests some residual activity and we estimate an upper age limit of 6 Gyr. We apply the relations of Bonfils et al for and to determine the metallicity, for Wolf 940A, and by extension the T8.5 secondary, Wolf 940B. We have obtained NIRI spectroscopy and photometry of Wolf 940B, and use these data, in combination with theoretical extensions, to determine its bolometric flux, and thus its luminosity . Using the age constraints for the system, and evolutionary structural models of Baraffe et al. we determine K and for Wolf 940B, based on its bolometric luminosity. This represents the first determination of these properties for a T8+ dwarf that does not rely on the fitting of T-dwarf spectral models. This object represents the first system containing a T8+ dwarf for which fiducial constraints on its properties are available, and we compare its spectra with those of the latest very cool BT-Settl models. This clearly demonstrates that the use of the (,) spectral ratios (used previously to constrain and ) would have over-estimated by K.
keywords:
surveys - stars: low-mass, brown dwarfs1 Introduction
The advent of the most recent generation of large imaging surveys (e.g. Lawrence et al. 2007; Delorme et al. 2008b, and soon the VISTA surveys) has facilitated the identification of brown dwarfs with later spectral types than the latest T dwarfs found using 2MASS, DENIS or SDSS. For example, the UKIRT Infrared Deep Sky Survey (UKIDSS) Large Area Survey (LAS; see Lawrence et al. 2007), which as of Data Release 4 (DR4) probes nearly 3 times the searchable volume of 2MASS for such objects, contains at least four T dwarfs with spectral types later than T8 (in addition to that identified in this work), which have recently been classified by Burningham et al. (2008): the T9 dwarfs ULAS J003402.77-005206.7 (hereafter ULAS 0034), CFBDS J005910.90-011401.3 (CFBDS 0059)and ULAS J133553.45+113005.2 (ULAS 1335); and the T8.5 dwarf ULAS J123828.51+095351.3 (ULAS 1238) (Warren et al. 2007; Delorme et al. 2008a; Burningham et al. 2008). The physical properties of these objects have been estimated by fitting various model spectra to near- and mid-infrared data (where available). Effective temperature () estimates vary from as cool as 500–550 K for ULAS 1335 (Leggett et al. 2009) to as warm as 600–650 K for ULAS 0034 (Warren et al. 2007). Since parallax determinations are not yet available for these objects, these estimates are somewhat uncertain, based as they are on early generations of atmospheric models that are still under development. Also, current indications are that surface gravity and metallicity are largely degenerate as far as near-infrared spectral fitting is concerned, which adds another layer of uncertainty to the parameters derived for such objects to date.
Since the low-temperature extreme of the brown dwarf regime is of particular interest for determining the form of the substellar initial mass function (e.g. Burgasser 2004), it is extremely desirable that atmospheric models in this regime are robustly constrained. Furthermore, the sub-600 K temperature regime overlaps with the warm-exoplanet regime, and such cool brown dwarfs provide excellent laboratories for improving the substellar atmospheric models which will be key to interpreting observations over the coming years. The discovery of T8+ dwarfs in binary systems with stellar primaries is of central importance for improving the current generation of atmospheric models, since we can use the properties of the primary star as fiducial constraints on the properties of the substellar secondary (e.g. Pinfield et al. 2006; Burgasser et al. 2005).
The term “benchmark” is broadly applied to objects for which at least some properties may be determined with minimal reference to models (although the degree of reference to models that is required to determine their properties varies). With the exception of a few T dwarfs whose ages and metallicities may be gleaned from studies of the young clusters or moving groups of which they are members (e.g. Hyades - Bouvier et al. 2008), the majority of T dwarf benchmarks have been found in binary systems. Indeed, one of the first unequivocally confirmed brown dwarfs, Gl229B (Nakajima et al. 1995), was found as a companion of an early type M dwarf, studies of which have yielded improved constraints on the system properties (Leggett et al. 2002). Other notable T dwarfs in such systems include HN PegB (T2.50.5) and HD 3651B (T7.50.5) (Mugrauer et al. 2006; Luhman et al. 2007), which are companions to well studied main sequence stars (G0V and K0V, respectively).
The multiple systems Gl 570 (K4V, M1.5V, M3V & T7.5; Burgasser et al. 2000; Geballe et al. 2001) and Indi (K4.5V, T1 & T6; Scholz et al. 2003; McCaughrean et al. 2004) also have well constrained ages from studies of the K and M dwarf members of the systems. The Indi Ba,Bb system offers the prospect of dynamical mass estimates for the T dwarf components through direct observation of the orbital motion within its short, 15 year, period (McCaughrean et al. 2004).
Liu et al. (2008) have suggested that brown dwarf binaries with dynamical mass determinations can serve as benchmark systems with comparable, or better, constraints on the brown dwarf gravities than in the case of wide companions of known age. They have demonstrated this approach with the first mass determination for a T dwarf binary, the T5+T5.5 system 2MASS 1534-2952AB, though the long orbital periods ( years) mean that some patience will be needed until a larger sample of this type of benchmark is available.
We report here on the discovery of a T8+ object, identified as a low-mass companion to the M4 dwarf Wolf 940, and explore its potential use as a benchmark object.
2 A new T8+ dwarf
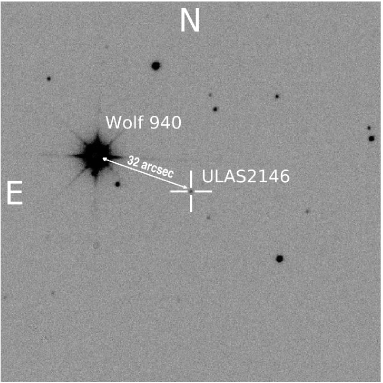
Our searches of the UKIRT Infrared Deep Sky Survey (UKIDSS) Large Area Survey (LAS; see Lawrence et al. 2007) have been successful at identifying late-type T dwarfs (e.g. Lodieu et al. 2007b; Warren et al. 2007; Pinfield et al. 2008; Burningham et al. 2008). Using the same search methodology as previously described in detail in Pinfield et al. (2008), we identified ULAS J214638.83-001038.7 (hereafter ULAS 2146) as a candidate very late-T dwarf, with colours reminiscent of other T8+ dwarfs (it was undetected in ). The source was observed as part of the LAS in for 40 seconds in each filter (see Lawrence et al. 2007), and the results of these observations are summarised in Table 1. The subsequent photometric and spectroscopic follow-up, which resulted in its classification as a T8.5 dwarf, are described in the following sub-sections. Figure 1 shows a UKIDSS -band finding chart for this object.
2.1 Near-infrared photometry
Near-infrared follow-up photometry was obtained using the UKIRT Fast Track Imager (UFTI; Roche et al. 2003) mounted on UKIRT , and the Long-slit Infrared Imaging Spectrograph (LIRIS; Manchado et al. 1998) mounted on the William Herschel Telescope on La Palma. Image mosaics were produced using sets of jittered images, with individual exposure times, jitter patterns and number of repeats given in Table 1. The data were dark subtracted, flatfield corrected, sky subtracted and mosaiced using ORAC-DR for the UFTI data, and LIRIS-DR for the LIRIS data.
We calibrated our UFTI observations using UKIRT Faint Standards (Leggett et al. 2006), with a standard observed at a similar airmass for each target. All UFTI data were obtained under photometric conditions, with seeing better than 0.9″. Photometry was performed using apertures with radii approximately times the seeing, which was stable between standard star and target frames to within less than 0.5 pixels (0.045 ″).
The wider field LIRIS data were obtained in a mixture of photometric conditions with stable seeing, and thin cirrus in variable seeing (0.8 - 1.2″). Absolute photometry for ULAS 2146, and for a number of fiducial stars, was obtained during photometric conditions and calibrated using a UKIRT Faint Standard star (FS29) observed at a similar airmass. The zero points for observations obtained in non-photometric conditions were then determined using these fiducial stars.
We used the spectra of T dwarf spectral standards for types T2-T9 to synthesise a transformation between the LIRIS -band filter and the MKO -band filter as a function of spectral type (ST). We find that :
with a scatter of (where etc. for T2,T3,T4 etc.). For earlier type stars (e.g. standards with ) we find that the transformation between the two filters is negligible. All -band magnitudes presented here were either measured in, or transformed into, . LIRIS uses a filter, and we transformed the standard star’s magnitude to using the relations of Carpenter (2001). The magnitude for ULAS 2146 was transformed to the MKO system using the transform derived by Pinfield et al. (2008). In both the case of the - and the -band, transforms were applied using a spectral type of T8.5 for ULAS 2146 (see Section 2.4).
We obtained multiple observations of ULAS 2146 in several bands to assess any level of variability. Table 1 summarises our photometry for ULAS 2146. It can be seen that the -band is stable to 5% over timescales of up to a year, with the exception of the UKIDSS survey magnitude (which is 15% brighter). We do not consider that the discrepancies between the follow-up data and the UKIDSS/WFCAM data are significant. The -band follow-up data, however, do not agree well, and could reflect some underlying variability. However, the latter measurement derives from a LIRIS observation, and although the conversion to MKO has been well characterised for earlier spectral types, this may not be the case for T8+ dwarfs. As such, we defer any detailed discussion of this discrepancy until multiple measurements on the same system have been obtained. Overall, we consider that our observations are consistent with a source that is stable at the % level.
2.2 Optical photometry
We have also obtained optical -band photometry using the ESO Faint Object Spectrograph and Camera (EFOSC2) mounted on the New Technology Telescope at La Silla, Chile under program 082.C-0399. These observations are summarised in Table 1. For this optical follow-up we used a gunn -band filter (ESO Z#623). The data were reduced using standard IRAF packages, and then multiple images of the target were aligned and stacked to increase signal-to-noise.
We synthesised Sloan , and EFOSC2 Gunn photometry for stars with spectral types between B1V and M4V using spectra drawn from Gunn & Stryker (1983). The resulting synthetic colours were then used to derive the transform:
This allowed the zero-point in our images to be determined by using SDSS stars as secondary calibrators. The uncertainty we quote for our -band photometry incorporates a scatter of in the determined zero-points. The results of our ground-based follow-up photometry are given in Table 1, which also gives the original WFCAM survey photometry. In all cases we take the measurement with the lowest uncertainty as our “final” value for use elsewhere in the paper.
| Filter | Magnitude | Instrument | UT Date | Total integration time | breakdown | Photometric? |
|---|---|---|---|---|---|---|
| EFOSC2 | 2008 Oct 08 | 3600s | (j = 1,r = 6, = 600s) | n | ||
| WFCAM | 2007 Oct 12 | 40s | (j = 2, r = 1, = 40s) | y | ||
| LIRIS | 2008 Sep 15 | 1000s | (j = 5, r = 5, = 40s) | y | ||
| WFCAM | 2007 Oct 12 | 40s | (m = 4, j = 2, r = 1, = 5s | y | ||
| UFTI | 2008 Jul 01 | 300s | (j = 5, r = 1, = 60s) | y | ||
| LIRIS | 2008 Sep 15 | 600s | (j = 5, r = 3, = 40s) | y | ||
| LIRIS | 2008 Sep 17 | 1200s | (j = 5, r = 6, = 40s) | n | ||
| WFCAM | 2007 Oct 06 | 40s | (j = 4, r = 1, = 10s) | y | ||
| UFTI | 2008 Jul 01 | 900s | (j = 5, r = 3, = 60s) | y | ||
| UFTI | 2008 Jul 24 | 900s | (j = 9, r = 2, = 60s) | y | ||
| LIRIS | 2008 Sep 15 | 1800s | (j = 5, r = 18, = 20s) | y | ||
| NIRI | 2008 Oct 20 | 1730s | (j = 4, r = 22.5, = 24x0.8s | y |
2.3 L’-band photometry
-band imaging of ULAS 2146 was obtained using the Near InfraRed Imager and Spectrometer (NIRI; Hodapp et al. 2003) on the Gemini North Telescope on Mauna Kea under program GN-2008B-Q-29 on the night of the 20th October 2008 under photometric conditions. Individual images were made up of 24 co-added 0.8 second exposures, which were repeated over a four point offset pattern. In total 90 images were recorded for ULAS 2146, with a further 8 images obtained of the faint standard HD201941. Each image had its temporally closest neighbour subtracted from it to remove the rapidly varying and structured sky background. The sky subtracted images were then flatfielded using a flatfield frame constructed by median stacking the entire set of images of ULAS 2146. The resulting images were offset to the position of the first image, and median combined to produce the final image. These observations, and the resulting -band magnitude, are summarised in Table 1.
2.4 Near-infrared spectroscopy
Spectroscopy in the -bands was obtained for ULAS 2146 using NIRI on the Gemini North Telescope on Mauna Kea (under program GN-2008B-Q-29). All observations were made up of a set of sub-exposures in an ABBA jitter pattern to facilitate effective background subtraction, with a slit width of 1″. The length of the A-B jitter was 10″. The observations are summarised in Table 2.
The NIRI observations were reduced using standard IRAF Gemini packages. A comparison argon arc frame was used to obtain a dispersion solution, which was applied to the pixel coordinates in the dispersion direction on the images. The resulting wavelength-calibrated subtracted AB-pairs had a low-level of residual sky emission removed by fitting and subtracting this emission with a set of polynomial functions fit to each pixel row perpendicular to the dispersion direction, and considering pixel data on either side of the target spectrum only. The spectra were then extracted using a linear aperture, and cosmic rays and bad pixels removed using a sigma-clipping algorithm.
Telluric correction was achieved by dividing the extracted target spectra by that of the F4V star HIP103801, observed just before the target, in the case of the - and -band spectra, whilst for the -band the A0V star HIP 112179 was used. Prior to division, hydrogen lines were removed from the standard star spectrum by interpolating the stellar continuum. Relative flux calibration was then achieved by multiplying through by a blackbody spectrum with K for the F4V standard, and 10,400 K for the A0V standard. Data obtained for the same spectral regions on different nights were co-added after relative flux calibration, each weighted by their exposure time.
| Object | UT Date | Integration time | Instrument | Spectral region |
|---|---|---|---|---|
| ULAS 2146 | 2008 Aug 18 | 12x300s | NIRI | |
| 2008 Aug 21 | 12x300s | NIRI | ||
| 2008 Aug 23 | 16x224s | NIRI |
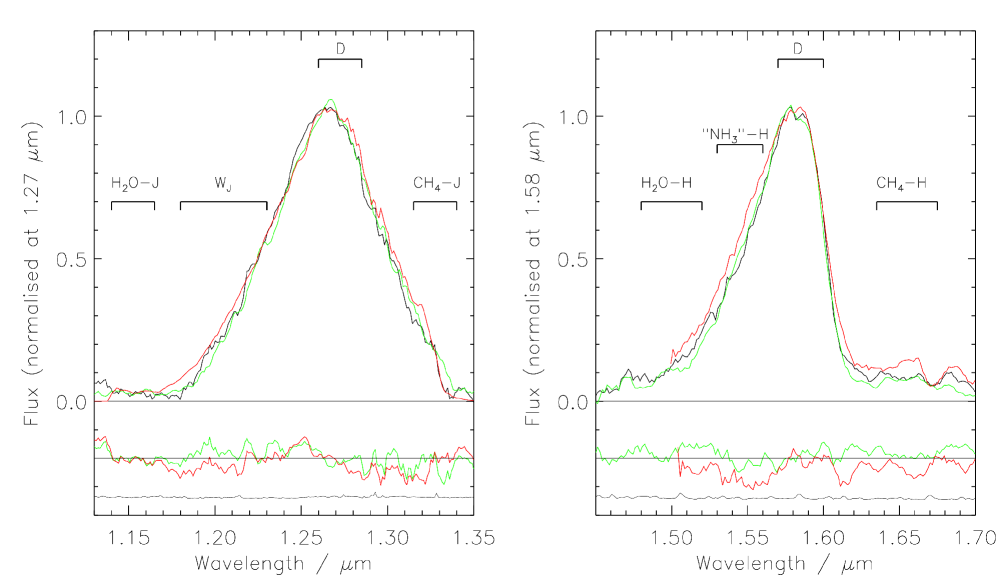
The spectra were then normalised using the measured near-infrared photometry to place the spectra on an absolute flux scale. The UFTI photometry was used for this purpose since all three bands were obtained on the same instrument, with MKO filters, within the shortest interval available in our data for all three bands (see Table 1). The normalised spectrum was rebinned by a factor of three to increase the signal-to-noise, whilst avoiding under-sampling of the spectral resolution. The resultant spectrum for ULAS 2146 is shown in Figure 2.

To derive a spectral type for ULAS 2146 we follow the method outlined in Burningham et al. (2008) for very late T dwarfs. Figure 3 shows the normalised -and -band111Normalised to unity at 1.27m and 1.58m respectively spectra of ULAS 2146 compared to those for the T8 and T9 spectral templates (Burgasser et al. 2006; Burningham et al. 2008). It can be seen from the trace of the residuals between the template spectra and those of ULAS 2146 that the latter appears to be intermediate between the two spectral types.
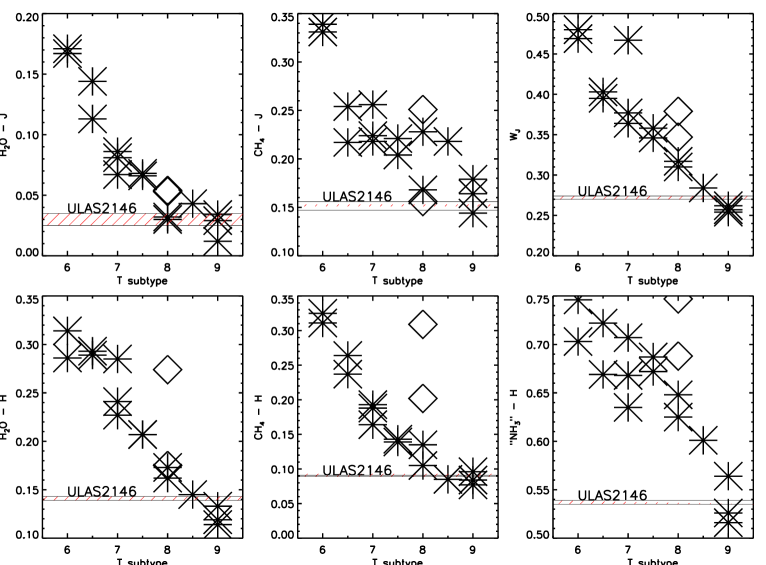
The T dwarf spectral type indices for ULAS 2146 are given in Table 3. In Figure 4 we reproduce Figure 7 from Burningham et al. (2008), with the spectral type indices for ULAS 2146 indicated along with those of previously published T6-T9 dwarfs. As discussed in Burningham et al. (2008), the H2O-J, CH4-J and CH4- indices are largely degenerate with type for T8 and T9 dwarfs, whilst the NH3- is not yet well understood. As such, we base our classification on the H2O- and indices. It can be seen that the values for its indices are consistent with classification between T8 and T9, we assign it the type T8.5 ( subtypes).
| Index | Ratio | Value | Type |
|---|---|---|---|
| H2O-J | T8 | ||
| CH4-J | T8 | ||
| T9 | |||
| H2O- | T8/T9 | ||
| CH4- | T8 | ||
| NH3- | … | ||
| CH4-K | … |
2.5 Keck Laser Guide Star Adaptive Optics Imaging
To search for possible unresolved binarity, we imaged ULAS 2146 on 03 November 2008 UT using the laser guide star adaptive optics (LGS AO) system (Wizinowich et al. 2006; van Dam et al. 2006) of the 10-meter Keck II Telescope on Mauna Kea, Hawaii. Conditions were photometric with average seeing. We used the facility IR camera NIRC2 with its wide field-of-view camera, which produces an image scale of mas/pixel. The LGS provided the wavefront reference source for AO correction, with the exception of tip-tilt motion. Tip-tilt aberrations and quasi-static changes in the image of the LGS as seen by the wavefront sensor were measured contemporaneously with a second, lower-bandwidth wavefront sensor monitoring the mag nearby star Wolf 940, located 32″ away from ULAS 2146. The sodium laser beam was pointed at the center of the NIRC2 field-of-view for all observations.
We obtained a series of dithered images, offsetting the telescope by a few arcseconds, with a total integration time of 360 seconds. We used the filter, which has a central wavelength of 1.592 m and a width of 0.126 m. This filter is positioned around the -band flux peak emitted by late-T dwarfs (see Tinney et al. 2005). The images were reduced in a standard fashion. We constructed flat fields from the differences of images of the telescope dome interior with and without continuum lamp illumination. Then we created a master sky frame from the median average of the bias-subtracted, flat-fielded images and subtracted it from the individual images. Images were registered and stacked to form a final mosaic, with a full-width at half-maximum of 0.10″. No companions were detected in a region centered on ULAS 2146.
We determined upper limits on the brightness of potential companions from the direct imaging by first convolving the final mosaic with an analytical representation of the PSF’s radial profile, modeled as the sum of multiple elliptical gaussians. We then measured the standard deviation in concentric annuli centered on the science target, normalized by the peak flux of the targets, and adopted 10 as the flux ratio limits for any companions. These limits were verified with implantation of fake companions into the image using translated and scaled versions of the science target.
Figure 5 presents the final upper limits on any companions. We employed the COND models of Baraffe et al. (2003) to convert the limits into companion masses, for an assumed age of 5 Gyr and a distance estimate of 12.5 pc (see Section 3). We assumed any cooler companions would have similar colors to ULAS 2146.

2.6 Proper motion
The photometric follow-up observations that were carried out for ULAS 2146 provided a second and third epoch of imaging data, showing the position of the source 0.72 years and 0.93 years after the original LAS image was measured. Although the second epoch data covers only a relatively small area of sky (the UFTI mosaic is 135″ on each side), we were able to accurately measure the positions of eight reference stars spread throughout the image, and match these to their counterparts measured in the LAS images. We used the same set of reference stars for the LIRIS data.
We used the IRAF task GEOMAP to derive spatial transformations from the UFTI and LIRIS -band images into the LAS -band image in which ULAS 2146 is well detected. The transform allowed for linear shifts and rotation, although the rotation that was required was negligible. We then transformed the UFTI and LIRIS pixel coordinates of ULAS 2146 into the LAS images using GEOXYTRAN, and calculated its change in position (relative to the reference stars) between the epochs. The root-mean-square (rms) scatter in the difference between the transformed positions of the reference stars and their actual measured positions was 0.2 pixels for the UFTI data and 0.3 pixels for the LIRIS data (corresponding to 0.04″ and 0.06″ in the -band LAS image). Assuming that the cardinal axes of the UKIDSS LAS image are aligned perfectly with the celestial , axes, we thus determined the proper motion (neglecting parallax) to be mas/yr, mas/yr. These uncertainties likely represent an under-estimate, since they do not include any systematic effects that may be present in data such as these that were not initially optimised for astrometric use.
As described in Section 3, ULAS 2146 appears to be a common proper motion companion to the M4 dwarf Wolf 940, which lies at a distance of 12.50 pc. We have thus repeated our proper motion determination incorporating into the solution the effect of the mas parallax measured for Wolf 940 (Harrington & Dahn 1980). Our revised proper motion estimate for ULAS 2146 is thus mas/yr, mas/yr, which incorporates additional uncertainty introduced by the measured parallax. For reasons discussed in Section 3, we consider this latter proper motion estimate our final value (see also Table 5).
3 A wide binary system
A visual comparison between the LAS imaging data and older Schmidt plate images of the region around ULAS 2146 revealed the presence of a high proper motion star just 32″ away from the T dwarf. This neighbouring source was identified (using the Simbad Database at CDS) as Wolf 940, a nearby (12.5pc) M4 dwarf with a total proper motion of 970 mas/yr. The properties of this dwarf are given in Table 4, and it can be seen that Wolf 940 and ULAS 2146 have proper motions that agree to within 1.0. In order to establish if this pair are a genuine physical binary system (as might be inferred from their common proper motion), we have calculated the expected number of high proper motion stars that might masquerade as common proper motion companions to LAS very late T dwarf discoveries.
Including ULAS 2146, there are now five T8+ dwarfs known with estimates ranging down to 550–600 K. Only ULAS 2146 is known to have a common proper motion companion. In general these objects all have 18, and we can thus consider ULAS 2146 as a typical example. Distance constraints can be estimated based on spectral type and magnitude, ignoring at this stage the association with Wolf 940. A typical T8 dwarf has =16.260.37 (Liu et al. 2006) and 750 K (e.g. Saumon et al. 2007), which provides a useful upper limit for a dwarf with T8.50.5 spectral type. Models (e.g. Baraffe et al. 2003) suggest that 750-550 K objects could have 19 (dependent on age, mass and radius), and for =15.89–19 the distance constraint for ULAS 2146 (=18.21) is 7-29pc. However, we also allow for the possibility that such late T dwarfs could be unresolved binaries, and thus potentially 0.75 magnitudes brighter than a single T dwarf. If MJ=15.14–19, one obtains a more conservative distance constraint of 7-41pc. Note that the known distance of Wolf 940 lies within these broad distance constraints, and thus the observable properties of ULAS 2146 (spectral type and brightness) are consistent with companionship.
Separations out to 1 arcminute from the new T8+ population and a distance range of 7-41pc, corresponds to a space volume of only 0.03 pc3. The local luminosity function measured out to distances of between 8 and 25 pc (e.g. Reid et al. 2007) suggests space densities of 0.06–0.11 stellar systems pc-3, and thus 0.0018–0.0033 stars actually contained within this volume. However, the likelihood of finding a star that had a common proper motion decreases this number still further. We examined all Hipparcos stars from 7-41pc in the direction of ULAS 2146 (45 degs in R.A. and Dec) and found that only three out of 619 were contained within a 200 mas/yr ()error circle centered on the proper motion of the T dwarf. This represents a 0.480.28% probability of finding a common proper motion source by chance in such a volume. We therefore conclude that we would expect (128) stars to masquerade as common proper motion companions to the T8+ dwarfs discovered in the UKIDSS LAS to date. This represents a vanishingly small probability, and we thus unambiguously consider that Wolf 940 and ULAS 2146 (here-after Wolf 940B) are a physical binary system.
3.1 The properties of Wolf 940A
This high proper motion M4 dwarf star was first presented by Wolf (1919), and was first recognised as a high proper motion object by Rodgers & Eggen (1974). Its properties are summarised in Table 4. It has a measured parallax distance of 12.50 pc (Harrington & Dahn 1980), and a mass and metallicity of 0.270.03 M⊙ and -0.060.20 dex respectively, as estimated from fits to it’s M and V-K colour using the relations presented in Bonfils et al. (2005).
The kinematics of Wolf 940 are listed in Table 4, and appear to be consistent with membership of the old disk population - kinematically defined to have an eccentricity in the UV plane 0.5 and lie outside of the young disk ellipsoid (where the young disk ellipsoid is defined as , , , see Eggen 1969; Leggett 1992). The Besançon Galactic population synthesis model (Robin et al. 2003) reproduces the stellar content of the Galaxy using various input physical assumptions and a simulated scenario of formation and evolution. This model has been tuned by comparison against relevant observational data as described in Haywood et al. (1997). The disk component of the model comprises numerous sub-populations including a 3–5 Gyr population with [Fe/H]=-0.070.18 dex. The metallicity and kinematic constraints for Wolf 940A are thus consistent with an age in the region of 3–5 Gyr. However, since such kinematic and compositional arguments apply only to populations of objects, this line of argument falls short of effectively constraining the age of Wolf 940A.
The study of M dwarf activity by Gizis et al. (2002) revealed that Wolf 940 has H in absorption, with an equivalent width of 0.262Å. West et al. (2008) more recently demonstrated that the drop in activity fraction (as traced by H) as a function of the vertical distance from the Galactic plane can be explained by a combination of thin-disk dynamical heating and a rapid decrease in magnetic activity. The timescale for this rapid activity decrease changes according to the spectral type, and they calibrate this via model fits to a population of 38,000 SDSS M dwarfs. For M4 dwarfs the activity life-time is determined to be 4.5 Gyr, and we are thus able to put a lower limit of 3.5 Gyr on the age of Wolf 940A from its lack of H emission.
This limit comes with the caveat that the activity life-times were derived for a bulk population, and it is not possible to rule out variability in individual stars. Additionally, uncertainty in the spectral type contributes another source of uncertainty. Although the spectral type of Wolf 940A appears to be reliably determined, we will consider a worst case scenario to examine the impact this may have on the age limit. For example, were the spectral type of Wolf 940A in error by a whole subtype, and it was actually an M5 dwarf, we would find a lower limit on the age of 6.5 Gyr. Alternatively, were Wolf 940A an M3 dwarf, the lower age limit would be 1.5 Gyr. Since the uncertainty in the spectral type is certainly much less than 1 subtype (Hawley et al. 1997), we adopt the limit implied by a spectral type of M4.
M dwarf atmospheres are too cool to produce H absorption in the photosphere (Cram & Mullan 1979; Pettersen & Coleman 1981), and the presence of H absorption thus implies the presence of a hot chromosphere (i.e. magnetic activity, Cram & Mullan 1985; Walkowicz & Hawley 2008). Therefore, the presence of H absorption in Wolf 940 indicates that it is still active at some level. Indeed, the relative numbers of H active and inactive M4 dwarfs in SDSS suggests an M4 age no more than 6 Gyr. The activity age estimate for Wolf 940 is thus 3.5-6 Gyr, consistent with the indications from kinematics and metallicity.
| Wolf 940A | |
|---|---|
| R.A. (ep=2000 eq=2000) | 21 46 40.47 |
| Dec (ep=2000 eq=2000) | -00 10 25.4 |
| R.A. (ep=2007.78 eq=2000) | 21 46 40.89 a |
| Dec (ep=2007.78 eq=2000) | -00 10 29.5 a |
| PMαcosδ | mas/yr b |
| PMδ | mas/yr b |
| Spectral type | M4 c |
| 12.70 c | |
| 1.61 c | |
| 8.360.02 d | |
| 0.530.04 d | |
| 0.340.04 d | |
| 5.21 | |
| 79.84.5 mas c | |
| Distance | 12.50 pc |
| m-M | 0.490.13 |
| M | 7.000.13 |
| V | km/s e |
| U | km/s e |
| V | km/s e |
| W | km/s e |
| Galactic speed | 185.38.7 km/s e |
| -0.060.20 f | |
| Mass | 0.270.03 M⊙ f |
| HαEW | 0.262 Åg |
| Age | 3.5–6.0 Gyr h |
| a Epoch of the UKIDSS LAS observation | |
| b Harrington & Dahn (1980) | |
| c Reid et al. (1995) | |
| d From 2MASS database | |
| e Dawson & De Robertis (2005) | |
| f Based on polynomial relationships (functions of | |
| V-Ks and M) from Bonfils et al. (2005) | |
| g Gizis et al. (2002) | |
| h Derived from activity life-time information presented | |
| in West et al. (2008) | |
3.2 The properties of Wolf 940B (ULAS 2146)
As a companion, Wolf 940B will share the same distance as the M4 primary (12.50 pc), and the two objects thus have a projected line-of-sight separation of 400AU. The actual semimajor axis of the binary depends on its orbital parameters. Following the method of Torres (1999), we assume random viewing angles and a uniform eccentricity distribution between 0 1 to derive a correction factor of 1.10 (68.3% confidence limits) to convert projected separation into semimajor axis. At a distance of 12.50 pc, this results in a semimajor axis of 440 AU. For a total mass of 0.27 M⊙ (i.e. neglecting the mass of Wolf 940B), this corresponds to an orbital period of 18000 years. This is quite typical when compared to other brown dwarfs in widely separated binary systems (e.g. Burgasser et al. 2005; Pinfield et al. 2006).
It has been known for some time that the degree of multiplicity amongst very young stars is greater than that of the more evolved field star populations (Duquennoy & Mayor 1991; Leinert et al. 1993), and thus that the majority of binary systems form together in their nascent clouds. Binary components can therefore generally be assumed to share the same age and composition, and we therefore assume that Wolf 940B also has an age of 3.5-6 Gyr and a composition of =-0.060.20.
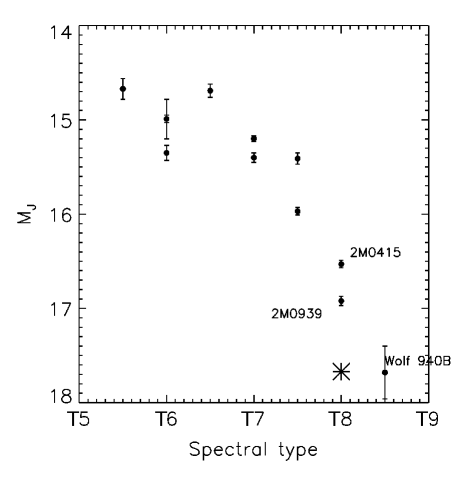
Since we have an accurate distance for Wolf 940B we can determine its absolute magnitude, and values for , and are given in Table 5. Figure 6 shows MJ plotted against spectral type for this and other T dwarfs with reliably determined parallaxes. The very faint nature of Wolf 940B is apparent, suggestive of a very low . 2MASS J0939-2448, which has recently been suggested as an equal mass binary system with component K (Burgasser et al. 2008), is indicated. The inferred = 17.67 for the individual components of 2MASS J0939-2448 is strikingly similar to that observed for Wolf 940B.
To determine the bolometric flux, , from Wolf 940B, we have combined our observed spectra (flux calibrated using our UFTI follow-up photometry) with model spectra that allow us to estimate the flux contributions from regions shortward and longward of our near-infrared spectral coverage. We scaled the m portion of the model spectra to match the short wavelength end of our -band spectrum, whilst we used our -band photometry to scale the m portion of the model spectra. We then joined them to our observed spectra and estimated the bolometric flux, assuming all flux emerges between 0.5 m and 30m. Provided the measured -band photometry is in a band where the level of emitted flux is relatively high (compared to the unmeasured wavelength regions), and that the theoretical models can be relied upon to provide a “reasonable” approximation to the shape of the spectral energy distribution (c.f. Mainzer et al. 2007; Cushing et al. 2006; Roellig et al. 2004), then this approach should provide valid results.
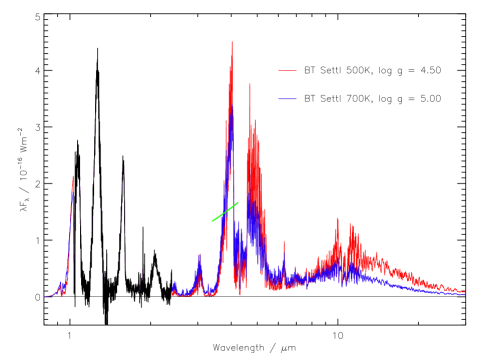
We have used the latest BT-Settl solar metallicity model spectra covering the 500–700K temperature range, with log g = 4.5–5.0, to provide the normalised shorter and longer wavelength spectral extensions to the observed near-infrared spectrum. We then took the median as our final value for . The scatter in values was taken as an estimate of the systematic uncertainty associated with our use of these normalised theoretical extensions. Figure 7 shows the scaled spectra for two extremes of our theoretical extension parameter space, along with our observed spectrum for Wolf 940B. It can be seen that the optical region contributes a very small portion of the total flux (2%), and its associated uncertainty is thus of only minor significance. Longward of the -band, however, the contribution to the overall flux is greater, with 60% of the flux emitted with m. We found that experimenting with the range of normalised theoretical spectra introduced an uncertainty of %. The uncertainties in our photometry used for scaling the model spectra introduced an additional % uncertainty to our bolometric flux estimate, dominated by the contribution from our -band measurement. Our total uncertainty in is thus %, with a final value of Wm-2. The luminosity of Wolf 940B then comes directly from the bolometric flux and distance, allowing for uncertainties in both (see Table 5).
To place constraints on the mass and radius of Wolf 940B we rely on theoretical structure models and infer these properties from the luminosity and age information. This requires an assumption about the multiplicity of Wolf 940B. Section 2.5 shows that Wolf 940B is unresolved at an angular resolution of 0.1” corresponding to a spatial resolution of 1.2 AU at the distance of the system. So although there is evidence (Burgasser et al. 2005) that the binary fraction of brown dwarfs (as resolved at such resolutions) in widely separated stellar-brown dwarf multiple systems is notably higher (45%) than that of field brown dwarfs in analogous samples (18%), Wolf 940B is not one of these systems. To assess the likelihood that it may be a tighter unresolved binary system we considered the analysis of Maxted & Jeffries (2005), who use Monte Carlo simulation techniques to assess radial velocity survey data and find that a Gaussian separation distribution with a peak at 4AU and a standard deviation correctly predict the number of observed binaries (radial velocity variables). Their estimated total binary fraction is 32-45%, consistent with estimates from open cluster studies (e.g. Lodieu et al. 2007a; Pinfield et al. 2003). For a Gaussian separation distribution of this type, we would expect at most a 10-20% binary fraction for systems with separation 1.2AU.
The metastudy by Allen (2007) estimates the binary fraction for objects later than M6 in the field as 20–22%, using bayesian methods, and 6% for systems with seperations less than 1 AU. Similarly, Joergens (2008) find a binary fraction for low-mass stars and brown dwarfs of 10–30% in the Chameleon I star forming region, with a frequency of less than 10% for binary separations of 1 AU.
Since the binary fraction of a magnitude limited survey, such as UKIDSS, will be increased by unresolved binaries, which are seen to greater distances, caution must be used when assessing the likelihood of binarity for an object from such a survey. For this reason we do not derive a formal likelihood of unresolved binarity for Wolf 940B. However, based on the results described above, it is possible to state that it is likely that Wolf 940B is a single object, and we proceed with our analysis on this basis.
Assuming evolution of the mass-luminosity and radius-luminosity relations from Baraffe et al. (2003) isochrones, we used linear interpolation (between isochrones) to derive theoretical mass and radius estimates appropriate for the measured luminosity and age constraints of Wolf 940B. These parameters (including ) are given in Table 5.
We can use our estimate of the radius and the luminosity to determine . However, since the radius estimate depends strongly on the assumed age, so does the derived . As discussed in Section 3.1, the spectral type that is used for Wolf 940A influences the age constraints implied by its H absorption. The worst case scenarios of errors of subtype in spectral type would lead to age ranges of 1.5–10 Gyr, or 6.5–10 Gyr. The extremes of these alternatives would imply radii of for an age of 1.5 Gyr and for an age of 10 Gyr, and constraints of 4.50—5.1 respectively. Given our luminosity estimate, these extreme cases imply =540 K and =605 K respectively. Since the spectral type uncertainty is small, however, we adopt the range of values implied by the M4 classification, and the associated age estimate of 3.5–6 Gyr, in Table 5.
We thus obtain our best estimate of =57025 K and = 4.75–5.00 for Wolf 940B directly from the constraints we place on the luminosity and radius of this object.
| Wolf 940B (ULAS 2146) | |
|---|---|
| R.A. (ep=2000 eq=2000) | 21 46 38.41 |
| Dec (ep=2000 eq=2000) | -00 10 34.6 |
| R.A. (ep=2007.78 eq=2000) | 21 46 38.83 a |
| Dec (ep=2007.78 eq=2000) | -00 10 38.7 a |
| mas/yr | |
| mas/yr | |
| Spectral type | T8.50.5 |
| Separation | 32″ |
| 40022 AU b | |
| 18.160.02 | |
| 3.99 0.13 | |
| 0.810.04 | |
| -0.610.04 | |
| -0.080.05 | |
| -0.690.05 | |
| Bolometric flux | Wm-2 c |
| 17.680.28 b | |
| 18.290.28 b | |
| 18.370.28 b | |
| d | |
| Mass | 20–32 MJ e |
| Radius | e |
| 4.75–5.00 e | |
| K f | |
| a Epoch of the UKIDSS LAS observation | |
| b Inferring a distance of 12.50 from Wolf 940A | |
| c Integrating the measured flux from 1.0–2.4 microns | |
| and adding a theoretical correction at longer and | |
| shorter wavelength (see text). | |
| d Inferred from Wolf 940A | |
| e Constraints derived from structure models as a | |
| function of luminosity for ages 3.5–6 Gyr | |
| f Derived from the luminosity and radius constraints | |
4 Testing the models
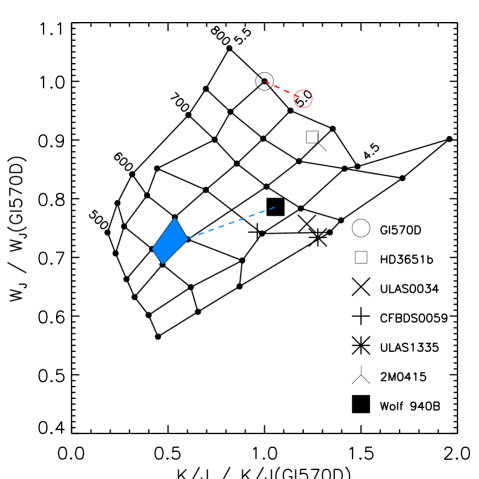
We now use our robust properties for Wolf 940B to make a direct comparison between observation and specific theoretical model predictions. We first apply the (,) analysis described by Warren et al. (2007) for ULAS 0034, and since repeated for CFBDS 0059 (Delorme et al. 2008a) and ULAS 1335 (Burningham et al. 2008). In Figure 8 we plot a grid of the and flux ratios for a recent set of solar metallicity BT-Settl models, along with the same ratios for a group of late-T dwarfs, including three T9s, the benchmark T dwarfs HD 3651B and Gl 570D, along with the T8 dwarf 2MASS 0415. It is immediately clear that there are large differences between the model predictions and the values derived from the objects’ spectra.
To assess the ability of the model spectra to make relative predictions for objects’ properties, we replot the same grid in Figure 9, however in this case we anchor the grid to values for the benchmark T dwarf Gl 570D. We have adopted the values derived by Saumon et al. (2006) of K and , and use the metallicity found by Geballe et al. (2001) of [M/H] . For the purposes of anchoring the solar metallicity (,) grid we associated Gl 570D with the model values for K, and . Even with such correction this diagram still fails to correctly identify the properties of Wolf 940B. The model spectra under-predict the ratio in absolute terms (Figure 8), and also predict a greater decrease in its value on going from K to K than is observed from Gl570D and Wolf 940B (Figure 9). In the case of the value the absolute prediction is an over-estimate, whilst the predicted decrease between K and K is close to reality. As a result of these effects, in the case of Wolf 940B, a simple (,) analysis would have over-estimated the temperature by K.

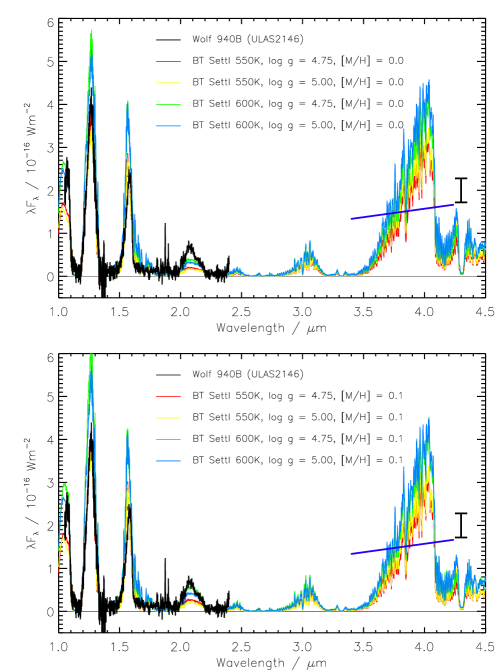
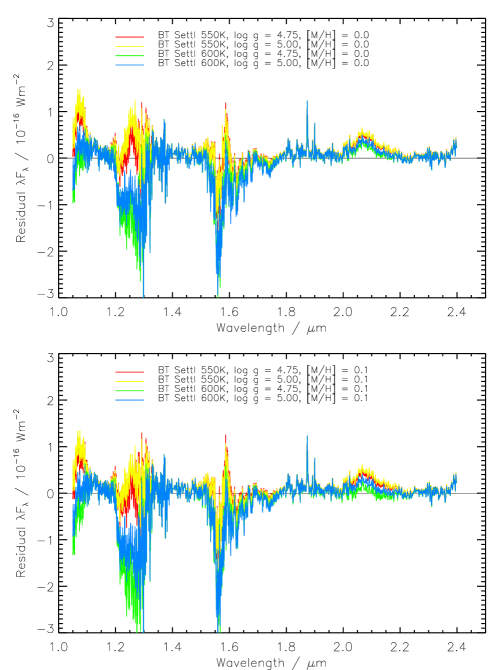
In Figure 10 we plot the comparison of the observed spectrum of Wolf 940B with those of the models that bracket its derived properties, scaled for the distance of 12.5pc and a radius 0.094 , and in Figure 11 we plot the residuals between model spectra and our data. The reason for the offsets in the (,) plots is demonstrated here. The low predicted value of in both the un-anchored and the anchored plots appear to be driven by systematic underestimate of the -band flux suggesting problems with the opacity due to collisionally induced absorption (CIA) by H2. The only model that does not underestimate the -band peak is that for K, , [M/H] = +0.1. However, this model spectrum overestimates the -and -band peaks by the greatest extent. Since model spectra for the low-metallicity parameter space are yet to be computed, we are unable to explore the full range of possibilities for this object’s metallicity. In fact, Liu et al. (2007) have found that the relative changes in model spectra with metallicity do not agree very well with the available data for late-T dwarfs. We thus defer a more extensive model comparison to a future paper.
Examination of the strengths of the flux peaks, with reference to the trends in model spectra with metallicity, gravity and temperature is thought to be useful for identifying T dwarfs with unusual properties (e.g. Pinfield et al. 2008). The well constrained nature of Wolf 940B makes it a useful reference point for assessing such spectral sensitivities. We have calculated the flux peak ratios for Wolf 940B, and compare them to other very late-T dwarfs and the two late-T benchmarks Gl 570D and HD 3651B in Table 6. Flux peak ratios involving the -band peak must be neglected, however, since our spectrum for ULAS 2146 does not provide sufficient coverage.
As discussed in more detail by Pinfield et al. (2008), the most dramatic trends in the relative strengths of the flux peaks of the BT-Settl model spectra appear to be associated with varying gravity and metallicity, with -band suppression (decreasing ) seen with increasing gravity and decreasing metallicity. The -band peak is more weakly affected by varying these parameters, and has trends in the opposite sense to the -band, i.e. decreasing strength with decreasing gravity or metallicity (decreasing ). The flux peaks show a weaker response to varying , with -band strengthening with falling , and the -band weakening.
Direct comparison of the flux peak ratios of Wolf 940B with the other two benchmark objects in Table 6 must be rather cursory at this stage. The K difference in between the objects makes it impossible to disentangle the effects of gravity/metallicity from those due to differences. However, it does appear that the relative ratios of the three objects are broadly consistent with their properties and the trends described above.
| Object | Sp. Type | |||
| Wolf 940B (ULAS 2146) | T8.5 | 0.454 | 0.111 | 0.245 |
| ULAS 00341 | T9 | 0.475 | 0.126 | 0.266 |
| CFBDS 00592 | T9 | 0.580 | 0.095 | 0.164 |
| ULAS 13353 | T9 | 0.574 | 0.134 | 0.232 |
| 2MASS 04154 | T8 | 0.531 | 0.132 | 0.249 |
| 2MASS 09395 | T8 | 0.483 | 0.060 | 0.124 |
| 2MASS 07296 | T8p | 0.447 | 0.093 | 0.207 |
| ULAS 10173 | T8p | 0.411 | 0.119 | 0.288 |
| Gl 570D7 | T7.5 | 0.423 | 0.105 | 0.247 |
| HD 3651B8 | T7.5 | 0.454 | 0.131 | 0.289 |
| Original publications for source spectra: | ||||
| 1 Warren et al. (2007) | ||||
| 2 Delorme et al. (2008a) | ||||
| 3 Burningham et al. (2008) | ||||
| 4 Burgasser (2004) | ||||
| 5 Burgasser et al. (2006) | ||||
| 6 Looper et al. (2007) | ||||
| 7 Geballe et al. (2001) | ||||
| 8 Burgasser (2007) | ||||
5 Summary and conclusions
We have identified a T8.5 ( sub-types) dwarf in a common proper motion binary system with the M4 dwarf Wolf 940. We designate the M4 primary as Wolf 940A, and the T8.5 dwarf as Wolf 940B, which lies at a projected separation of 400AU. By using the properties of Wolf 940A to constrain those of Wolf 940B, and with reference to evolutionary structural models of Baraffe et al. (2003) we estimate that Wolf 940B has K, and [M/H] . This represents the first estimate of the properties for a T8+ dwarf that does not rest on the fitting of model spectra, although we do rely on the radius predicted by evolutionary models and an age estimate from the activity of the primary of 3.5–6.0 Gyr.
Our comparison of the near-infrared spectrum for Wolf 940B with the current generation of BT-Settl model spectra reveals that the strength of the -band flux peak is underestimated by the models. This is likely the driving factor behind the K temperature over-estimate implied by (,) spectral ratio analysis. This indicates that determined for late-T dwarfs from (,) analysis should be treated with extreme caution.
This system should be of significant benefit for improving understanding of K atmospheres. In the near future we expect Spitzer IRS spectroscopy and IRAC imaging to be obtained, which will allow a detailed examination of the predictions of a variety of very cool model spectra. Furthermore, intermediate resolution spectroscopy can be used to assess if Wolf 940B is a rapid rotator, whilst repeat observations can be used to search for close binarity via modulation of Wolf 940B’s radial velocity. Finally, it is highly desirable that we improve the metallicity constraints on this system. This requires both improvement in the understanding of metallicity indicators in M dwarfs, and a more detailed study of Wolf 940A. Repeat H measurements for Wolf 940A will reveal if its H absorption is stable, thus providing an indication of the reliability of our age constraint.
Acknowledgments
Gemini Observatory is operated by the Association of Universities for Research in Astronomy, Inc. (AURA), under a cooperative agreement with the NSF on behalf of the Gemini partnership: the National Science Foundation (United States), the Science and Technology Facilities Council (United Kingdom), the National Research Council (Canada), CONICYT (Chile), the Australian Research Council (Australia), Ministério da Ciência e Tecnologia (Brazil) and SECYT (Argentina).
SKL is supported by the Gemini Observatory, which is operated by AURA, on behalf of the international Gemini partnership of Argentina, Australia, Brazil, Canada, Chile, the United Kingdom, and the United States of America.
MCL and TJD acknowledge support for this work from NSF grant AST-0507833 and an Alfred P. Sloan Research Fellowship.
This research has made use of the SIMBAD database, operated at CDS, Strasbourg, France, and has benefited from the SpeX Prism Spectral Libraries, maintained by Adam Burgasser at http://www.browndwarfs.org/spexprism.
We gratefully acknowledge the Keck LGS AO team for their exceptional efforts in bringing the LGS AO system to fruition. It is a pleasure to thank Randy Campbell, Cynthia Wilburn, and the Keck Observatory staff for assistance with the observations.
References
- Allen (2007) Allen P. R., 2007, ApJ, 668, 492
- Baraffe et al. (2003) Baraffe I., Chabrier G., Barman T. S., Allard F., Hauschildt P. H., 2003, A&A, 402, 701
- Bonfils et al. (2005) Bonfils X., Delfosse X., Udry S., Santos N. C., Forveille T., Ségransan D., 2005, A&A, 442, 635
- Bouvier et al. (2008) Bouvier J., Kendall T., Meeus G., 2008, ArXiv e-prints
- Burgasser (2004) Burgasser A. J., 2004, ApJS, 155, 191
- Burgasser (2007) —, 2007, ApJ, 658, 617
- Burgasser et al. (2006) Burgasser A. J., Geballe T. R., Leggett S. K., Kirkpatrick J. D., Golimowski D. A., 2006, ApJ, 637, 1067
- Burgasser et al. (2000) Burgasser A. J., Kirkpatrick J. D., Cutri R. M., McCallon H., Kopan G., Gizis J. E., Liebert J., Reid I. N., Brown M. E., Monet D. G., Dahn C. C., Beichman C. A., Skrutskie M. F., 2000, ApJ, 531, L57
- Burgasser et al. (2005) Burgasser A. J., Kirkpatrick J. D., Lowrance P. J., 2005, AJ, 129, 2849
- Burgasser et al. (2008) Burgasser A. J., Tinney C. G., Cushing M. C., Saumon D., Marley M. S., Bennett C. S., Kirkpatrick J. D., 2008, ApJ, 689, L53
- Burningham et al. (2008) Burningham B., Pinfield D. J., Leggett S. K., Tamura M., Lucas P. W., Homeier D., Day-Jones A., Jones H. R. A., Clarke J. R. A., Ishii M., Kuzuhara M., Lodieu N., Zapatero Osorio M. R., Venemans B. P., Mortlock D. J., Barrado Y Navascués D., Martin E. L., Magazzù A., 2008, MNRAS, 391, 320
- Carpenter (2001) Carpenter J. M., 2001, AJ, 121, 2851
- Cram & Mullan (1979) Cram L. E., Mullan D. J., 1979, ApJ, 234, 579
- Cram & Mullan (1985) —, 1985, ApJ, 294, 626
- Cushing et al. (2006) Cushing M. C., Roellig T. L., Marley M. S., Saumon D., Leggett S. K., Kirkpatrick J. D., Wilson J. C., Sloan G. C., Mainzer A. K., Van Cleve J. E., Houck J. R., 2006, ApJ, 648, 614
- Dawson & De Robertis (2005) Dawson P. C., De Robertis M. M., 2005, PASP, 117, 1
- Delorme et al. (2008a) Delorme P., Delfosse X., Albert L., Artigau E., Forveille T., Reylé C., Allard F., Homeier D., Robin A. C., Willott C. J., Liu M. C., Dupuy T. J., 2008a, A&A, 482, 961
- Delorme et al. (2008b) Delorme P., Willott C. J., Forveille T., Delfosse X., Reylé C., Bertin E., Albert L., Artigau E., Robin A. C., Allard F., Doyon R., Hill G. J., 2008b, A&A, 484, 469
- Duquennoy & Mayor (1991) Duquennoy A., Mayor M., 1991, A&A, 248, 485
- Eggen (1969) Eggen O. J., 1969, PASP, 81, 553
- Geballe et al. (2001) Geballe T. R., Saumon D., Leggett S. K., Knapp G. R., Marley M. S., Lodders K., 2001, ApJ, 556, 373
- Gizis et al. (2002) Gizis J. E., Reid I. N., Hawley S. L., 2002, AJ, 123, 3356
- Gunn & Stryker (1983) Gunn J. E., Stryker L. L., 1983, ApJS, 52, 121
- Harrington & Dahn (1980) Harrington R. S., Dahn C. C., 1980, AJ, 85, 454
- Hawley et al. (1997) Hawley S. L., Gizis J. E., Reid N. I., 1997, AJ, 113, 1458
- Haywood et al. (1997) Haywood M., Robin A. C., Creze M., 1997, A&A, 320, 428
- Hodapp et al. (2003) Hodapp K. W., Jensen J. B., Irwin E. M., Yamada H., Chung R., Fletcher K., Robertson L., Hora J. L., Simons D. A., Mays W., Nolan R., Bec M., Merrill M., Fowler A. M., 2003, PASP, 115, 1388
- Joergens (2008) Joergens V., 2008, A&A, 492, 545
- Knapp et al. (2004) Knapp G. R., Leggett S. K., Fan X., Marley M. S., Geballe T. R., Golimowski D. A., Finkbeiner D., Gunn J. E., Hennawi J., Ivezić Z., Lupton R. H., Schlegel D. J., Strauss M. A., Tsvetanov Z. I., Chiu K., Hoversten E. A., Glazebrook K., Zheng W., Hendrickson M., Williams C. C., Uomoto A., Vrba F. J., Henden A. A., Luginbuhl C. B., Guetter H. H., Munn J. A., Canzian B., Schneider D. P., Brinkmann J., 2004, AJ, 127, 3553
- Lawrence et al. (2007) Lawrence A., Warren S. J., Almaini O., Edge A. C., Hambly N. C., Jameson R. F., Lucas P., Casali M., Adamson A., and thirteen co-authors, 2007, MNRAS, 379, 1599
- Leggett (1992) Leggett S. K., 1992, ApJS, 82, 351
- Leggett et al. (2006) Leggett S. K., Currie M. J., Varricatt W. P., Hawarden T. G., Adamson A. J., Buckle J., Carroll T., Davies J. K., Davis C. J., Kerr T. H., Kuhn O. P., Seigar M. S., Wold T., 2006, MNRAS, 373, 781
- Leggett et al. (2009) Leggett S. K., Cushing M. C., Saumon D., Marley M. S., Roellig T. L., Warren S. J., Burningham B., Jones H. R. A., Kirkpatrick J. D., Lodieu N., Lucas P. W., Mainzer A. K., Martin E. L., McCaughrean M. J., Pinfield D. J., Sloan G. C., Smart R. L., Tamura M., Van Cleve J., 2009, ArXiv e-prints
- Leggett et al. (2002) Leggett S. K., Hauschildt P. H., Allard F., Geballe T. R., Baron E., 2002, MNRAS, 332, 78
- Leinert et al. (1993) Leinert C., Zinnecker H., Weitzel N., Christou J., Ridgway S. T., Jameson R., Haas M., Lenzen R., 1993, A&A, 278, 129
- Liu et al. (2008) Liu M. C., Dupuy T. J., Ireland M. J., 2008, ApJ, 689, 436
- Liu et al. (2007) Liu M. C., Leggett S. K., Chiu K., 2007, ApJ, 660, 1507
- Lodieu et al. (2007a) Lodieu N., Dobbie P. D., Deacon N. R., Hodgkin S. T., Hambly N. C., Jameson R. F., 2007a, MNRAS, 380, 712
- Lodieu et al. (2007b) Lodieu N., Pinfield D. J., Leggett S. K., Jameson R. F., Mortlock D. J., Warren S. J., Burningham B., Lucas P. W., Chiu K., Liu M. C., Venemans B. P., McMahon R. G., Allard F., Baraffe I., Y Navascués D. B., Carraro G., Casewell S. L., Chabrier G., Chappelle R. J., Clarke F., Day-Jones A. C., Deacon N. R., Dobbie P. D., Folkes S. L., Hambly N. C., Hewett P. C., Hodgkin S. T., Jones H. R. A., Kendall T. R., Magazzù A., Martín E. L., McCaughrean M. J., Nakajima T., Pavlenko Y., Tamura M., Tinney C. G., Zapatero Osorio M. R., 2007b, MNRAS, 379, 1423
- Looper et al. (2007) Looper D. L., Kirkpatrick J. D., Burgasser A. J., 2007, AJ, 134, 1162
- Luhman et al. (2007) Luhman K. L., Patten B. M., Marengo M., Schuster M. T., Hora J. L., Ellis R. G., Stauffer J. R., Sonnett S. M., Winston E., Gutermuth R. A., Megeath S. T., Backman D. E., Henry T. J., Werner M. W., Fazio G. G., 2007, ApJ, 654, 570
- Mainzer et al. (2007) Mainzer A. K., Roellig T. L., Saumon D., Marley M. S., Cushing M. C., Sloan G. C., Kirkpatrick J. D., Leggett S. K., Wilson J. C., 2007, ApJ, 662, 1245
- Manchado et al. (1998) Manchado A., Fuentes F. J., Prada F., Ballesteros E., Barreto M., Carranza J. M., Escudero I., Fragoso-Lopez A. B., Joven-Alvarez E., Manescau A., Pi M., Rodriguez-Ramos L. F., Sosa N. A., 1998, in Presented at the Society of Photo-Optical Instrumentation Engineers (SPIE) Conference, Vol. 3354, Proc. SPIE Vol. 3354, p. 448-455, Infrared Astronomical Instrumentation, Albert M. Fowler; Ed., Fowler A. M., ed., pp. 448–455
- Maxted & Jeffries (2005) Maxted P. F. L., Jeffries R. D., 2005, MNRAS, 362, L45
- McCaughrean et al. (2004) McCaughrean M. J., Close L. M., Scholz R.-D., Lenzen R., Biller B., Brandner W., Hartung M., Lodieu N., 2004, A&A, 413, 1029
- McLean et al. (2003) McLean I. S., McGovern M. R., Burgasser A. J., Kirkpatrick J. D., Prato L., Kim S. S., 2003, ApJ, 596, 561
- Mugrauer et al. (2006) Mugrauer M., Seifahrt A., Neuhäuser R., Mazeh T., 2006, MNRAS, 373, L31
- Nakajima et al. (1995) Nakajima T., Oppenheimer B. R., Kulkarni S. R., Golimowski D. A., Matthews K., Durrance S. T., 1995, Nature, 378, 463
- Pettersen & Coleman (1981) Pettersen B. R., Coleman L. A., 1981, ApJ, 251, 571
- Pinfield et al. (2008) Pinfield D. J., Burningham B., Tamura M., Leggett S. K., Lodieu N., Lucas P. W., Mortlock D. J., Warren S. J., Homeier D., Ishii M., McMahon R. G., and 29 co-authors, 2008, MNRAS submitted
- Pinfield et al. (2003) Pinfield D. J., Dobbie P. D., Jameson R. F., Steele I. A., Jones H. R. A., Katsiyannis A. C., 2003, MNRAS, 342, 1241
- Pinfield et al. (2006) Pinfield D. J., Jones H. R. A., Lucas P. W., Kendall T. R., Folkes S. L., Day-Jones A. C., Chappelle R. J., Steele I. A., 2006, MNRAS, 368, 1281
- Reid et al. (2007) Reid I. N., Cruz K. L., Allen P. R., 2007, AJ, 133, 2825
- Reid et al. (1995) Reid I. N., Hawley S. L., Gizis J. E., 1995, AJ, 110, 1838
- Robin et al. (2003) Robin A. C., Reylé C., Derrière S., Picaud S., 2003, A&A, 409, 523
- Roche et al. (2003) Roche P. F., Lucas P. W., Mackay C. D., Ettedgui-Atad E., Hastings P. R., Bridger A., Rees N. P., Leggett S. K., Davis C., Holmes A. R., Handford T., 2003, in Presented at the Society of Photo-Optical Instrumentation Engineers (SPIE) Conference, Vol. 4841, Instrument Design and Performance for Optical/Infrared Ground-based Telescopes. Edited by Iye, Masanori; Moorwood, Alan F. M. Proceedings of the SPIE, Volume 4841, pp. 901-912 (2003)., Iye M., Moorwood A. F. M., eds., pp. 901–912
- Rodgers & Eggen (1974) Rodgers A. W., Eggen O. J., 1974, PASP, 86, 742
- Roellig et al. (2004) Roellig T. L., Van Cleve J. E., Sloan G. C., Wilson J. C., Saumon D., Leggett S. K., Marley M. S., Cushing M. C., Kirkpatrick J. D., Mainzer A. K., Houck J. R., 2004, ApJS, 154, 418
- Saumon et al. (2006) Saumon D., Marley M. S., Cushing M. C., Leggett S. K., Roellig T. L., Lodders K., Freedman R. S., 2006, ApJ, 647, 552
- Saumon et al. (2007) Saumon D., Marley M. S., Leggett S. K., Geballe T. R., Stephens D., Golimowski D. A., Cushing M. C., Fan X., Rayner J. T., Lodders K., Freedman R. S., 2007, ApJ, 656, 1136
- Scholz et al. (2003) Scholz R.-D., McCaughrean M. J., Lodieu N., Kuhlbrodt B., 2003, A&A, 398, L29
- Tinney et al. (2005) Tinney C. G., Burgasser A. J., Kirkpatrick J. D., McElwain M. W., 2005, AJ, 130, 2326
- Torres (1999) Torres G., 1999, PASP, 111, 169
- van Dam et al. (2006) van Dam M. A., Bouchez A. H., Le Mignant D., Johansson E. M., Wizinowich P. L., Campbell R. D., Chin J. C. Y., Hartman S. K., Lafon R. E., Stomski Jr. P. J., Summers D. M., 2006, PASP, 118, 310
- Walkowicz & Hawley (2008) Walkowicz L. M., Hawley S. L., 2008, ArXiv e-prints
- Warren et al. (2007) Warren S. J., Mortlock D. J., Leggett S. K., Pinfield D. J., Homeier D., Dye S., Jameson R. F., Lodieu N., Lucas P. W., Adamson A. J., and 14 co-authors, 2007, MNRAS, 381, 1400
- West et al. (2008) West A. A., Hawley S. L., Bochanski J. J., Covey K. R., Reid I. N., Dhital S., Hilton E. J., Masuda M., 2008, AJ, 135, 785
- Wizinowich et al. (2006) Wizinowich P. L., Le Mignant D., Bouchez A. H., Campbell R. D., Chin J. C. Y., Contos A. R., van Dam M. A., Hartman S. K., Johansson E. M., Lafon R. E., Lewis H., Stomski P. J., Summers D. M., Brown C. G., Danforth P. M., Max C. E., Pennington D. M., 2006, PASP, 118, 297
- Wolf (1919) Wolf M., 1919, Astronomische Nachrichten, 209, 11