Anisotropic phonon DOS: the application of Rietveld
and Mössbauer texture analysis in aligned powders
Abstract
While synthesizing the single crystals of novel materials is not always feasible, orienting the layered polycrystals becomes an attractive method in the studies of angular dependencies of inelastic scattering of x-rays or neutrons. Putting in use the Rietveld analysis of layered structures in novel manganites and cuprates we develop the studies of their anisotropic properties with oriented powders instead of single crystals. Densities of phonon states (DOS) and atomic thermal displacememts (ATD) are anisotropic in the A-site ordered manganites LnBaMn2Oy of both and series (Ln=Y, La, Sm, Gd). We establish the angular dependence of DOS on textures of arbitrary strengths, link the textures observed by x-ray and ray techniques, and solve the problem of disentanglement of Goldanskii-Karyagin effect (GKE) and texture in Mössbauer spectra.
pacs:
63.22.Np;76.80.+ypacs:
63.22.Np;76.80.+yTwo states of matter traditionally used in structure analysis are single crystals and polycrystalline powder. When synthesizing the single crystal is a stiff task the random polycrystalline materials or even polycrystals oriented on a surface conformably to their persistent crystal habitus can be employed. Via the method developed initially by RietveldRiet the refinement of texture, or preferred orientation, is a conventional procedure alongside with the refinement of atomic structure parameters. Randomization of the powders favors the perfect refinements of atomic parameters, therefore, any residual texture is usually not in line with the best sample preparation for x-ray profile analysis. There appears, however, a class of problems, in which the well-oriented powders of platy or acicular crystallites can replace the unavailable single crystals. To them belong the studies in anisotropic properties of materials, in electric, magnetic properties, and in lattice dynamics. The texture descriptions and determination of the preferred orientation parameters are thus becoming the issues of self-sustained interest.
Recently, orienting powders to make the samples with varied degree of crystallite alignment was suggestedEPL to be useful in vibrational spectroscopy of anisotropic materials. When the polycrystalline material is a ferromagnet or a superconductor it can be thoroughly subjected to texturing in an external magnetic field.
The vibrational properties in novel manganites and cuprates are anisotropic owing to their layered structure. Substitution of Fe into Jahn-Teller cation site perturbs the electronic system at small doping rate, and modifies the existing charge and/or orbital order. However, due to strong electron-phonon interactions the system keeps its attractiveness for high-resolution spectroscopies based on nuclear resonance. The Fe-doped samples allowed us to probe the anisotropy of the dopant vibrations due to GKE in 57Fe Mössbauer spectroscopyRCR . The same doping procedure is extremely valuable in the synchrotron radiation vibrational spectroscopy using the nuclear inelastic scattering (NIS) Review . In this work, we establish the relationships between the parameters of preferred orientation, the anisotropic phonon DOS, and the Mössbauer line intensities. Using these relationships we propose the novel technique of NIS on the oriented powder samples.
Previous works dealt with the texture manifestations in Mössbauer spectraPfan1 ; Pfan2 ; Gren . For a unpolarized Mössbauer source there occur two parameters of texture, which can be determined from spectra. These parameters define the so-called ”minimum texture function”(MTF). Our approach is to employ the March-DollaseDollase function (MDF) implemented in programs for diffraction profile analysisDBW ; Full . We establish the relation between Rietveld and Mössbauer textures in terms of MDF and MTF, using the example of quadrupole doublet spectra for the 57Fe nuclei occupying of Mn sites in paramagnetic state of novel manganites LnBaMn2O5 Millange and LnBaMn2O6NKU ; NKYOU ; WAR . The symmetries are tetragonal, except a monoclinic member YBaMn2O6, and measurements were made with azimuthal rotation. Our texture function was uniaxial, invariant (Fig.1).
In the proposed method, the DOS derivation is based on two NIS patterns and a Rietveld pattern. Owing to relationship between MTF and MDF, the Mössbauer spectra and Rietveld analysis become mutually complementary techniques. Indeed, the transmission (Mössbauer) and reflection (Bragg or NIS) data may diverge if there occur some in-depth variations of texture. The resonance wavelength (0.86 Å) is close to x-ray Mo Ka(0.7 Å), but the main component of NIS radiation collected by the avalanche photodiode detector (APD) is Fe (1.94 Å)Review , that is close to x-ray wavelength of Cu (1.54 Å).
In the NIS spectrum of an anisotropic crystal, the phonon DOS is weighted by squared projection of the phonon polarization vectors to the wave vector of the x-ray quantumKCR . Let the incident beam be launched under the angle with respect to preferred axis (-axis) of a plate- or a needle-like crystallite. The projected DOS for this crystallite is:
| (1) |
To introduce the averaging of the DOS over the ensemble of aligned crystallites we must integrate these two terms with the volume of crystallites whose z-axis lies within the cone shell element :
| (2) |
Here and the orientation distribution function (ODF) is normalized to unity. The polar ODF is to replace via the coordinate transform from the frame of the beam to the frame of the rotation stage. The ratio of angular elements is and the Jacobian of this transform is . Using we obtain for the uniaxial symmetry
| (3) |
Powder averaging can be expressed via Legendre function of the first kind :
| (4) |
Prior measuring the NIS spectra Mössbauer spectroscopy and Rietveld analysis provide the results in terms of MTF and MDF, respectively. Due to the axial symmetry, the texture function would have only even terms in the Legendre expansion series.
| (5) |
The observable quantities, , and asymmetries in Mössbauer spectra ( or , as denoted below) are fully determined by the integrals of , i.e., (4) and , therefore, the function consistent with experiment is not unique. The simplest function conforming the Eq. (4), is the so-called MTF Pfan2 , composed of a linear combination of and terms, i.e., the parabolic function of .
Rietveld analysisRiet ; DBW ; Full specifies the preferred orientation with two fit parameters and of the MDF Dollase :
| (6) |
The angle describes the misfit of the crystallite orientation with respect to the axis of the uniaxial texture (Fig.1, b), and is the fraction of the oriented phase. The March variable expresses the strength of the preferred orientation. In a sample made by pressing a layer of plates (needles) of the initial thickness down to the thickness , the degree of compression is Eric . The function conserves the scattering matter, therefore, it has a clearer physical sense than originally used by Rietveld Riet . MDF is thus a true normalized angular distribution, equally good to the textures made of crystallites with either platy or acicular habitusRiet ; DBW ; Full .
Ericsson and Wäppling have previously studied in chloriteEric the effect of texturing induced by compression of various degrees on the Mössbauer line area asymmetry. They have pointed out that their model ”represent an extreme case” and that less randomness were observed in chlorite samples than predicted by their one-parametric compression model. Nagy Nagy has introduced a second parameter taking into account the particle shape and assumed that the texturing behavior of the particles under compression is shape-dependent. For the platy chlorite flakes Nagy obtained the aspect ratio (cylindrical ) as large as 0.6 Nagy . The March-Dollase function implemented in the FULLPROF programFull is also two-parametric, however, the meaning of the second parameter is unrelated to the method of particle alignment. The unaligned random phase is just added with the fraction of . We show below that the Mössbauer line area asymmetry depends for small asymmetries only on the product . Difference of physical meanings between and manifests itself only in strongly asymmetric spectra.
Measurements with the rotated sample stage inclined to the incident beam (Fig.1, b) provide us with two components , of uniaxial DOS in terms of the angle and the parameters and . Using MDF (Eq.6), we obtain
| (7) | ||||
| (8) | ||||
| (9) | ||||
| (10) | ||||
| (11) | ||||
| (12) |
via substitution , into Eq.(3). Both and are imaginary for , however, is real for . The ranges , and correspond to platy and stalky habits, respectively.
Now from (5) we can express MTF through and :
| (13) |
It is shown in Fig.2 (a) that the Legendre series coefficients of the MDF are (all, except ) returning to zero at and that the MDF is well approximated by in some vicinity of random polycrystal , because for around .
We are ready for determination of both and . From Eq.(2) a couple of measurements of DOS and at the angles and leads to:
| (14) | ||||
| (15) |
, .
Now we turn to the asymmetry of Mössbauer spectra caused by texture with parameters and . First, the intensity ratio for a single crystallite is to be examined depending on the orientation of the wave vector of the incident x-ray quantum with respect to the axes of the electric field gradient (EFG) tensor at the site wherein the 57Fe nucleus is located. The -dependent Clebsch-Gordan coefficients determine the doublet line intensity ratio Pfan1 ; Pfan2 . We found that the quantity, which is proportional to the amount of the oriented phase is the deviation of relative line area from :
| (16) |
Powder averaging resolves, using Eq.(3), into
| (17) |
Eq.(17) remains true in scaled form, i.e. with in place of , and in place of . From Fig. 2(b) starting with one finds the MDF variable at any angle except magic angle .
When the measurement is done at the texture does not manifest itself in the spectra. In a simple normal incidence transmission Mossbauer spectrum , the expression for intensity ratio was formulatedPfan1 ,
| (18) |
however, the solutions were yet found either for texture effects, or for GKE, separately only. In the proposed synchrotron experiments on anisotropic powders, both are crucial, therefore, the combined effects of texture and GKE are of our interest. In (18) is the squared wave vector times the difference of mean-square vibrational displacements along , and in perpendicular direction, , Å-2. Here again, it is more convenient to work with . The replacement of with the MTF, Eq. 13, makes our expression for integrable and expressible via two simple sigmoid functions and :
| (19) |
with , , and
| (20) |
Here is the Kummer confluent hypergeometric function. The range of variation for both sigmoid functions and is between and ; for unoriented powder , and is the exact solution. The accuracy of the solution (19) is better than 1% only in the narrow range of slight textures ( and ), in which the MTF is a perfect approximation for MDF (Eq. 6). In the same range, the differs from merely by shift of sigmoid flexpoint:
| (21) |
The approximation (21) is as good as (19) for . The parameters and enter to in equivalent form, however, become nonequivalent if the approximation (21) is extended to a broader range of . We extend it by taking into account the narrowing sigmoid for stronger textures: . The accuracy of this approximation is better than 1% in the broad range of textures, . The and dependencies of and can be well fitted with and . The polynomials and could be expressed as dot products of coefficients vectors with the vector vectors . In practice, it is crucial to find the vibrational anisotropy starting from , therefore, is given using the function inverse of :
| (22) |
The function of variables is visualized via several 2D maps (slices, Fig.3). Total range, in which is defined, is , and the slices are shown for , , and . Linear slope is exact near , but its discrepancy reaches 10% already at . The parabolic model is better than in the range that covers the asymmetries observed in our spectra (Fig.4).
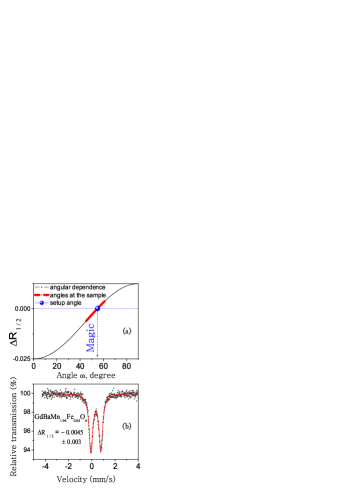
We have checked that the rotation of the sample around an axis perpendicular to the vector of the incident quantum induces a difference of the doublet asymmetry. The same as in Fig.4 absorber of GdBaMn1.96Fe0.04O6 was installed under the magic angle and the symmetric doublet was obtained. A very small residual asymmetry can be explained by the divergence of the incident beam (Fig.5).
Both oxygen-saturated and oxygen-depleted families of layered manganites show negative , although their left-to-right area ratio changes the sign between ”O5” and ”O6” series. This is because the main axis of EFG is perpendicular to layers and in the pyramid FeO5, but in the FeO6 octahedron compressed along axis. Since the sign of changes from ”O5” to ”O6” series the doublet lines swap their positions. remains negative according to its definition in Eq.(16). Therefore, in both panels of Fig.4, the stronger line is , and the weaker line is . In this respect, the layered manganites are quite similar to layered cuprates, wherein the ionic point charge model prescribes the same orientation and sign of HI .
The values of and for our samplesY refined from x-ray diffraction patternsFull are shown by spots in Fig.3, at slices of the same as shown in Fig.4. The value of increases with increasing size of Ln within either ”O5” or ”O6” series, however, the vibrational anisotropy is positive in pyramid FeO5 (), but negative in the compressed octahedron FeO6 (). This result is verifiable via refinement of the factors of anisotropic thermal displacements (ATD) of Mn from neutron diffraction data, however, till now such the data were refined with modelsNKYOU ; WAR . On the other hand, in a similar bilayered structure of YBaFeCuO5, the ATD of Fe shaped in FeO5 pyramid as prolate ’cigar’ was foundMom . Also, the oblate ’pancake’ is not unexpected shape of ATD in the oblate octahedron of LnBaMn2O6.
In conclusion, we have shown how the information contained in the x-ray diffraction full-profile patterns of the aligned powders can be used for finding the direction-projected components of the phonon DOS. This information is sufficient, in principle, to solve the problem of determination of two DOS components from at least two experiments either performed on two samples with different and non-zero degrees of alignment or conducted on one aligned-powder sample but under at least two different angles . The same information is contained in assymetry of Mössbauer line intensities, however, here the texture effect is entangled with GKE. Therefore, the useful for DOS or for other properties information can be disentangled from Mössbauer spectra in only cases when either GKE or ODF are characterized by some separate experiments. One possibility is to determine the GKE separately from the ATD refinement using neutron diffraction full-profile analysis superior in the accuracy of compared to x-ray Rietveld analysis. Another possibility is to employ the texture March-Dollase parameters. The latter possibility was realized in this work for two cases when the sign and orientation of uniaxial is known, namely, in LnBaMn2O5 () and in LnBaMn2O6 (). Our method is well applicable for these tetragonal structures, in which the axis of preferred orientation coincides with the direction perpendicular to layers and with the principal axis of electric field gradient. More complicated textured systems, such as non-uniaxial or magnetic textures were beyond the scope of the present work. It must be finally emphasized that the scope of possible applications of the present work is limited by the close correspondence between the distribution of March-Dollase, which is theoretically substantiated only in pressed samplesNagy , and the real ODF , which can be obtained experimentally with texture goniometers using several analytical methods, best of which combine the ODF calculation with the Rietveld structure refinementcombined . Our approach is also good for samples containing the randomly oriented phase, because we employed the extended (biparametric) MDF .
This work was supported by Asahi Glass Foundation and RFBR-JSPS (Grant 07-02-91201).
References
- (1) H.M. Rietveld, J. Appl. Cryst. 2, 65-71 (1969).
- (2) A. I. Rykov, Europhys. Lett. 85, 16003, p1-p6 (2009).
- (3) A. Rykov, V. Caignaert, and B. Raveau, J. Solid. St. Chem. 109, 295-306 (1994).
- (4) M. Seto, Y. Yoda , S. Kikuta , X.W. Zhang and M. Ando, Phys. Rev. Lett.74, 3828-3831 (1995).
- (5) H.-D. Pfannes and U. Gonser, Appl. Phys. 1, 93-102 (1973).
- (6) H.-D. Pfannes and H. Fisher, Appl. Phys. 13, 317-325 (1977).
- (7) J.-M. Greneche and F. Varret, J. Phys. C15, 5333-5344 (1982).
- (8) W.A. Dollase, J. Appl. Cryst. 19, 267-272 (1986).
- (9) R.A. Young and D.B. Wiles, Adv.X-ray Anal.24,1-23(1981).
- (10) J. Rodriguez-Carvajal. Physica B 192, 55-69 (1993); http://www-llb.cea.fr/fullweb/powder.htm.
- (11) F. Millange, V. Caignaert, B. Domengès, B. Raveau, and E. Suard, Chem. Mater. 10, 1974-1983 (1998).
- (12) T. Nakajima, H. Kageyama, Y. Ueda, J. Phys. Chem. Solids, 63, 913-916 (2002).
- (13) T. Nakajima, H. Kageyama, H. Yoshizawa, K. Ohoyama, and Y. Ueda, J. Phys. Soc. Jpn. 72, 3237-3242 (2003).
- (14) A.J. Williams, J.P. Attfield, and S.A.T. Redfern, Phys. Rev. B 72, 184426-1-13 (2005).
- (15) V.G. Kohn, A.I. Chumakov, R. Rüffer, Phys. Rev. B. 58, 8437-8444 (1998).
- (16) T. Ericsson and R. Wäppling, J. Phys. Colloque C6, 719-723 (1976).
- (17) D.L. Nagy, Appl. Phys. 17, 269-274 (1978).
- (18) Best fits were obtained for the following coefficient vectors: A1=(4.34,-12.3, 12.5,-5.35, 0.84), A2=(-5.27, 16.1,-17.9, 8.52,-1.47), A3=(2.35,-7.85, 9.47,-4.89, 0.903), B1=(11.5,-24.4, 19.7,-8.22, 1.33), B2=(-7.79, 24.2,-26.4, 11.8,-1.77), B3=(8.44,-29.6, 36.5,-18.6, 3.20).
- (19) A.I. Rykov, A. Ducouret, N. Nguyen, V. Caignaert, F. Studer and B. Raveau, Hyperfine Interact. 77 (1993) 277.
- (20) Since the structure of YBaMn2O6 was monoclinic, the refinement of texture parameters was not applicable.
- (21) A.W. Mombrú, K. Prassides, C. Christides, R.Erwin, M. Pissas, C. Mitros, and D. Niarchos, J. Phys.: Cond. Mat. 10, 1247-1258 (1998).
- (22) L. Lutterotti, D. Chateigner, S. Ferrari, J. Ricote, Thin Solid Films 450 (2004) 34-41.
I Figure Captions
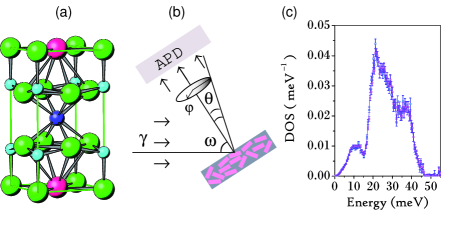
Fig.1. Structure of oxygen-deficient layered oxides, e.g., manganites LnBaMn2O5 (a); geometry of nuclear inelastic scattering of synchrotron radiation (b); phonon density of states of Fe in unoriented powder of TbBaFe2O5 (c).
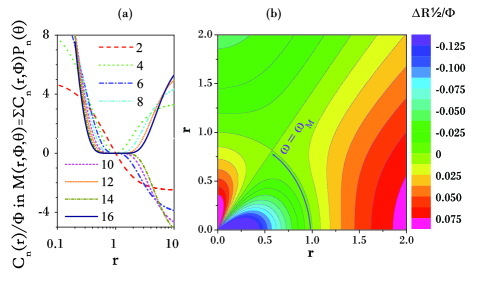
Fig.2. The dependence of the scaled coefficients of the Legendre series expansion of the MDF, Eq. 6 (a) and contour polar plot of the isotropic () site scaled spectra asymmetry in function of the strength of preferred orientation and incidence angle (b).
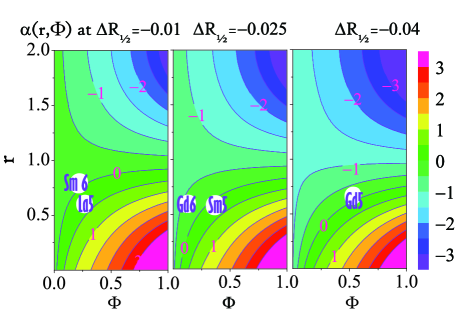
Fig.3. Vibrational anisotropy in function of three variables , Eq. 22 , is shown as three slices (contour plots) of . In each matched slice, the oriented samples of manganites LnBaMn2O5 and LnBaMn2O5 are shown by Ln symbols and oxygen index as spots with coordinates obtained from Rietveld refinement of parameters of preferred orientation.
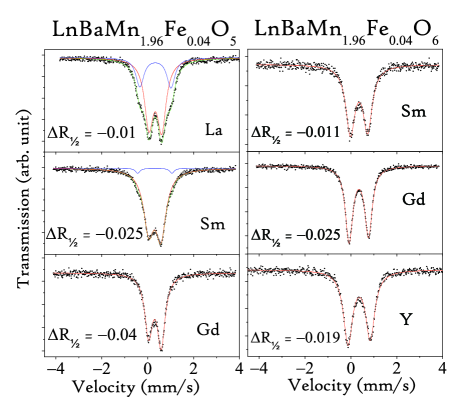
Fig.4. Mossbauer spectra in oriented samples of 57Fe-doped manganites. Two panels present the oxygen-poor and oxygen-rich series (”O5” and ”O6”). The spectra are fitted either with one or with two asymmetric doublets. Meltdowns of Mn2+/Mn3+ and Mn3+/Mn4+charge order in O5 and O6 series, respectively, are seen as single-site doublets. The occurrence of two sites for Fe in La and Sm members of the LnBaMn2O5 series is interpreted as remainder of unmolten charge order between Mn2+ and Mn3+. The asymmetries were fixed to be a single parameter of both doublets. This is because each crystallite contain both these sites and their direction and sign coincide according to structureMillange .
Fig.5. The angular dependence of the doublet asymmetry (a) as given by the Eq. (17) and the Mössbauer spectrum measured under the magic angle between the direction from source to detector and the normal to the GdBaMn1.96Fe0.04O6 sample absorber. The distance between source and the sample center was 4 cm and the illuminated area of the sample was 22 cm (). The angles at the absorber surface were thus varied between and . This range between =45∘ and is shown in (a) by bold line. A small residual asymmetry might have been resulted from the averaging in this range. The fitted value of R1/2 = 0.0045 is 5.5 times smaller than the normal-incidence value of R1/2 in Fig.4.