Simulation and Fitting of Multi-Dimensional X-ray Data
Abstract
Astronomical data generally consists of 2 or more high-resolution axes, e.g., X,Y position on the sky or wavelength and position-along-one-axis (long-slit spectrometer). Analyzing these multi-dimension observations requires combining 3D source models (including velocity effects), instrument models, and multi-dimensional data comparison and fitting. A prototype of such a ”Beyond XSPEC” (Noble & Nowak, 2008) system is presented here using Chandra imaging and dispersed HETG grating data. Techniques used include: Monte Carlo event generation, chi-squared comparison, conjugate gradient fitting adapted to the Monte Carlo characteristics, and informative visualizations at each step. These simple baby steps of progress only scratch the surface of the computational potential that is available these days for astronomical analysis.
MIT Kavli Institute, Cambridge, MA, USA
1. Multi-Dimensional X-ray Data and “Event-2D”
Modern astronomical data often consists of 2 high-resolution dimensions: e.g., {} for 2D sky images, {} for spectral images as from a long-slit (or slitless) spectrometer, and {} for time-resolved spectroscopy. There is also a growing body of 3D or 4D data sets, {}, being produced by instruments across the spectrum (Emsellem 2008). Here we focus on the needs of the High-Energy Transmission Grating (HETG) spectrometer on Chandra (Canizares et al. 2005): a slitless dispersive imaging spectrometer operating in the X-ray range of 0.3 to 8 keV, although the techniques and software (s/w) described here are applicable to other instruments as well.
For extended sources observed with the HETG, the dispersed data are 2D and combine spatial and spectral information (Dewey 2002). A block diagram of the Event-2D system used to analyze these data is shown in Figure 1.
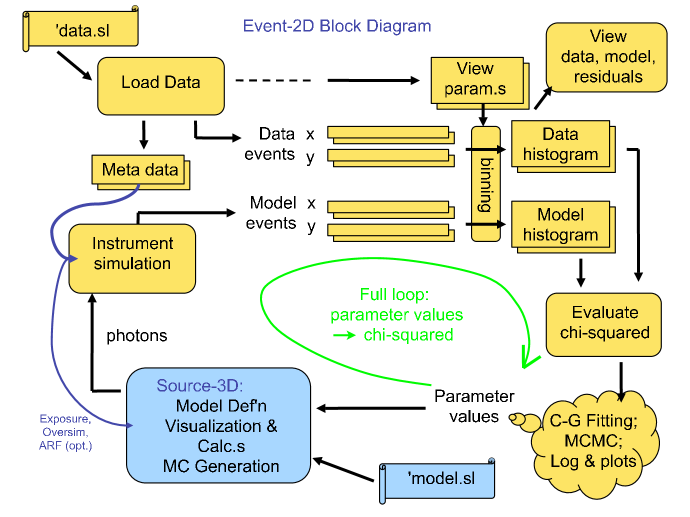
Some key ingredients are: the ability to model the 3D geometric-spectral properties of the source, appropriate instrument simulation to generate modeled 2D events from the source photons, the management and viewing of multiple 2D data sets, and a flexible and quantitative comparison of the real and modeled data.
Event-2D is written in S-Lang (http://www.jedsoft.org/slang/), a high-performance interpreted language which is also used in our general X-ray analysis system, ISIS (Houck & Denicola 2000). S-Lang/ISIS allows us to import (interface to) a wide variety of external modules (gsl, volpack, etc.) in order to extend available functionality (Noble & Nowak 2008). This HETG s/w falls under the large umbrella of the Hydra (http://space.mit.edu/hydra/) project at MIT. The following sections summarize the status of the main components of the current Event-2D system.
2. Source Model Definition
The Source-3D s/w allows models to be created as a combination of geometric components each having their own 3D geometry, spectral emission, and velocity properties. Examples of some of the geometric primitives provided by the v3d library are shown in Figure 2.
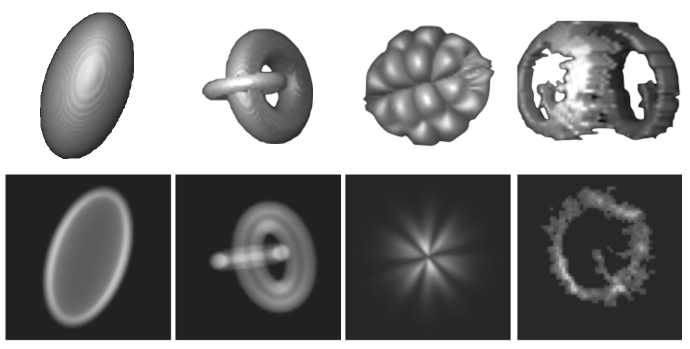
The v3d routines generate 3D arrays (data cubes) of values which can be combined, e.g., through union and intersection, to produce more complex geometries. The emission spectra associated with each component can be defined by the usual ISIS function specifications and “.par” files. Velocity properties including “Hubble-like” expansion and orbital rotation can be included in the components; these source motions are very important for the spectral imprints they leave via Doppler shifts. The user specification of a source model is most conveniently done through a custom S-Lang script file which includes definition of the model parameters and rules for updating the model based on the parameters. While this does require some “programming” on the users part, it is relatively simple and gives complete control of the model definition to the user: e.g., direct access to the structures that define the spectral and the geometric components. The source can include a foreground absorption component which is applied in the observer’s rest frame, along with an optional instrument effective area (or first approximation thereof) allowing the photon Monte Carlo (MC) generation and subsequent detection to be more efficient. Besides useful model visualizations, the main output of the model is the MC generation of “photons” with {} values; these can also be used outside of Event-2D for other applications, e.g., as input to an observatory’s simulator.
3. Data and Instrument Simulation
Data are loaded from Chandra FITS event files into internal structures by specifying the 2 desired event tags, e.g., {SkyX,SkyY} or {,TG_D}. Here also, it is convenient to create a user script to load the data sets. Several structures keep track of the instrument properties, the event data, and the viewing and binning parameters for each of the loaded data sets. Since these structures are user accessible, custom analyses are facilitated.
X-ray instrument simulation is done by MC ray-tracing of appropriate fidelity. The instrument knowledge is coarse but useful: an arf specifies effective area vs energy, a 2-Gaussian approximates the on-axis PSF, and the detector intrinsic energy resolution is specified by a simple equation, . Grating simulation includes period variation and cross-dispersion blurs. The appropriate 2 simulated tags are then loaded into the model events for comparison with the data events, Figure 1.
4. Data–Model Comparison and Fitting
The data and model can be compared by binning the events in a regular 2D grid (image) and calculating the usual of the residuals between them as shown for two cases in Figure 3.
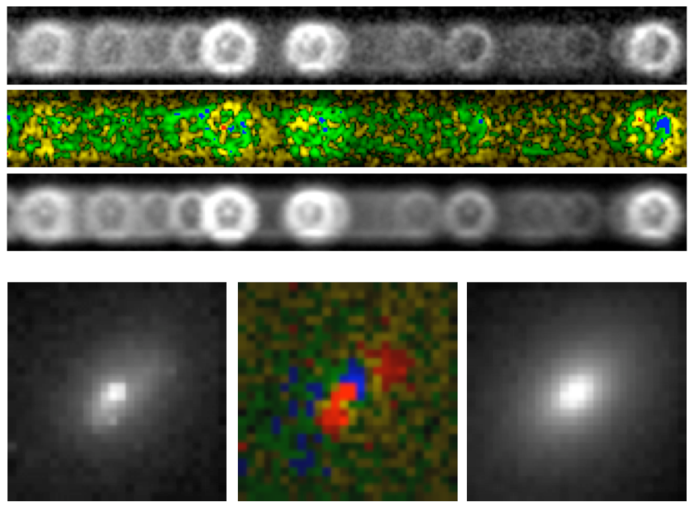
The specific feature of the model that is being fit often guides the range and binning size for the comparison. An important aspect of the fitting here is that the MC model itself contains “noise”: re-evaluation with the same input parameters does not give the identical model result. This MC noise can be reduced below scientific relevance by “over simulating”, generating more events than in the data and scaling appropriately. Even so, the fitting has to be noise-aware and noise-tolerant. A modified conjugate gradient fitting method and a Markov Chain MC method are available; each of these requires user guidance in the form of providing a ”should make a noticeable difference” size scale for each of the fitted parameters.
Acknowledgments.
Support for this work was provided by NASA through the AISRP grant NNG06GE58G and by NASA (NAS8-03060) via SAO contract SV3-73016 to MIT for support of the Chandra X-ray Center and Instruments.
References
Canizares, C.R. et al. 2005, PASP, 117, 1144.
Dewey, D. 2002, in High Resolution X-ray Spectroscopy with XMM-Newton and Chandra, ed. G. Branduardi-Raymont, 14.
Emsellem, E. 2008, Talk at “Gas and Stars in Galaxies”,
http://www.eso.org/sci/meetings/gal3D2008/program.html
Houck, J.C. & Denicola, L.A. 2000, in ASP Conf. Ser. 216, ADASS IX, ed. N. Manset, C. Veillet, & D. Crabtree (San Francisco: ASP), 591.
Noble, M.S. & Nowak, M.A. 2008, PASP, 120, 821.