FR II Quasars: Infrared Properties, Star Formation Rates, and Extended Ionized Gas
Abstract
We present Spitzer IRS spectra and MIPS photometry of 12 radio-loud QSOs with FR II morphologies at . Six of the sources are surrounded by luminous extended emission-line regions (EELRs), while the other six do not have such extended nebulae. The two subsamples are indistinguishable in their mid-infrared spectra and overall infrared spectral energy distributions (SEDs). For both subsamples, the mid-infrared aromatic features are undetected in either individual sources or their stacked spectra, and the SEDs are consistent with pure quasar emission without significant star formation. The upper limits to the star formation rate are sufficiently low that starburst-driven superwinds can be ruled out as a mechanism for producing the EELRs, which are instead likely the result of the ejection of most of the gas from the system by blast waves accompanying the launching of the radio jets. The FR II quasars deviate systematically from the correlation between host galaxy star formation rate and black hole accretion rate apparently followed by radio-quiet QSOs, implying little or no bulge growth coeval with the current intensive black hole growth. We also present a new Spitzer estimate of the star formation rate for the starburst in the host galaxy of the compact steep-spectrum radio quasar 3C 48.
Subject headings:
quasars: general — infrared: galaxies — galaxies: starburst1. Introduction
Giant extended emission-line regions (EELRs), with typical radii of 10–30 kpc, are found around roughly half of the low-redshift steep-radio-spectrum quasars with strong nuclear narrow-line emission (Stockton & MacKenty, 1987; Fu & Stockton, 2009). Although the most luminous EELRs at low redshifts are exclusively associated with steep-spectrum radio-loud quasars, the distribution of the ionized gas typically shows no obvious connection with the radio jets or lobes, or with host galaxy morphologies. These EELRs most likely comprise gas that has been driven out of the host galaxies by superwinds (Stockton et al., 2002; Fu & Stockton, 2006, 2007b, 2008, 2009). But are these superwinds mostly produced by starbursts or by the quasars themselves? We have found some evidence in favor of quasar-driven outflows from momentum considerations (Fu & Stockton, 2006) and from the lack of any optical spectroscopic evidence for a very recent starburst in the radio galaxy 3C 79, which shows both scattered light from a hidden quasar and a strong EELR (Fu & Stockton, 2008). However, to deal with this question more systematically, we need to work with a global star-formation indicator that we can apply to a larger sample of objects. In particular, for the present program, we have chosen carefully matched samples of steep-radio-spectrum quasars with and without luminous EELRs. Our main goal was to measure or to place strong upper limits to star formation rates (SFRs) in both subsamples of quasars.
A number of measures of SFR are available for galaxies in general. These include optical emission lines, such as H and [O ii] 3727 (e.g., Kewley et al., 2004, and references therein), mid-infrared (MIR) fine structure lines, notably [Ne ii] 12.8m (Ho & Keto, 2007), polycyclic aromatic hydrocarbon (PAH) emission in the MIR (Schweitzer et al., 2006; Shi et al., 2007), the far-infrared (FIR) continuum (e.g., Rowan-Robinson et al., 1997), and the radio continuum (e.g., Condon, 1992). Some of these measures are difficult or impossible to apply to host galaxies of luminous, radio-loud QSOs (i.e., quasars). For example, photoionization by the quasar UV continuum produces emission lines that will mask those from star formation, and radio emission from the non-thermal radio source can swamp that due to star formation. The PAH emission and the FIR continuum appear to offer the most promise for use with quasar host galaxies, and they have the additional advantage over any optical approaches that they can reveal even deeply obscured starbursts.
In this Paper, we present and discuss Spitzer MIR spectra and FIR photometry of 13 steep-radio-spectrum and/or FR II (Fanaroff & Riley, 1974) quasars at . Throughout we assume a cosmological model with km s-1 Mpc-1, , and .
| log | log | log | Size | log | log | |||||||
|---|---|---|---|---|---|---|---|---|---|---|---|---|
| Name | Designation | (erg s-1) | (erg s-1) | (W Hz-1) | (kpc) | (mJy) | (mJy) | (mJy) | (erg s-1) | (erg s-1) | ||
| (1) | (2) | (3) | (4) | (5) | (6) | (7) | (8) | (9) | (10) | (11) | (12) | (13) |
| CSS Quasar with EELR | ||||||||||||
| 3C 48 | 01373309 | 0.367 | 42.75 | 45.11 | 0.82 | 28.41 | 3 | 128.6 | 754.6 | 475.9 | 46.11 | 43.97 |
| FR II Quasars with EELRs | ||||||||||||
| 3C 249.1 | 11047658 | 0.312 | 42.82 | 45.52 | 0.84 | 27.63 | 137 | 43.9 | 60.2 | 14.0 | 44.84 | 42.70 |
| Ton 616 | 12252458 | 0.268 | 42.59 | 44.63 | 0.80 | 26.67 | 279 | 11.9 | 12.6 | 13.5 | 44.04 | 42.40 |
| Ton 202 | 14272632 | 0.366 | 42.32 | 45.19 | 0.62 | 26.94 | 1169 | 40.3 | 61.0 | 11.5 | 44.99 | 42.81 |
| 4C 37.43 | 15143650 | 0.371 | 42.97 | 45.27 | 0.80 | 27.36 | 276 | 30.0 | 35.0 | 13.0 | 44.76 | 42.84 |
| 3C 323.1 | 15472052 | 0.264 | 42.20 | 45.18 | 0.71 | 27.33 | 285 | 32.4 | 18.8 | 14.1 | 44.19 | 42.62 |
| PKS 2251+11 | 22541136 | 0.326 | 42.47 | 45.17 | 0.73 | 27.37 | 47 | 42.2 | 30.1 | 26.6 | 44.59 | 42.72 |
| FR II Quasars without EELRs | ||||||||||||
| 4C 25.01 | 00192602 | 0.284 | 40.95 | 45.11 | 0.66 | 26.82 | 204 | 67.8 | 116.4 | 53.6 | 45.06 | 42.82 |
| 4C 13.41 | 10071248 | 0.241 | 40.38 | 45.38 | 0.67 | 26.95 | 387 | 72.9 | 86.5 | 22.1 | 44.78 | 42.78 |
| 3C 246 | 10510918 | 0.344 | 40.92 | 45.21 | 0.78 | 27.68 | 415 | 20.5 | 20.0 | 15.8 | 44.46 | 42.56 |
| 4C 49.22 | 11534931 | 0.334 | 40.40 | 44.71 | 0.49 | 27.32 | 80 | 25.3 | 42.2 | 13.6 | 44.75 | 42.71 |
| 3C 351 | 17046044 | 0.372 | 41.29 | 45.40 | 0.74 | 27.85 | 282 | 99.2 | 173.7 | 68.2 | 45.47 | 43.08 |
| 4C 31.63 | 22033145 | 0.295 | 40.94 | 45.41 | 0.16 | 26.99 | 352 | 67.2 | 83.3 | 54.2 | 44.95 | 42.81 |
Note. — Col. (1): Common name. Col. (2): J2000.0 designation. Col. (3): Redshift. Col. (4): Extended [O iii] luminosity in logarithmic and upper limits for non-EELR quasars. Col. (5): Optical continuum luminosity under H. Col. (6): Radio spectral index () between 0.4 and 2.7 GHz. Col. (7): 178 MHz radio luminosity in logarithmic (The value for Ton 202 was interpolated between 151 and 365 MHz fluxes). Col. (8): Projected linear size of the radio source (References: Akujor & Garrington 1991; Bridle et al. 1994; Feng et al. 2005; Gopal-Krishna & Wiita 2000; Gower & Hutchings 1984; Kellermann et al. 1994; Stocke et al. 1985). Cols. (9)–(11): Observed flux densities in the MIPS 24, 70, and 160 m bands. Col. (12): Interpolated luminosity at rest wavelength 60 m from MIPS photometry. Col. (13): Observed luminosity and upper limits of the PAH 7.7m feature from IRS spectra. The reference for Cols. (4)–(6) is Stockton & MacKenty (1987). Data in Col. (7) are compiled from the NASA/IPAC Extragalactic Database (NED).
2. Sample Selection and Spitzer Observations
Our sample of quasars has been selected from the Stockton & MacKenty (1987) survey for extended emission around low-redshift QSOs. We have a principal sample of 12 FR II quasars (which we will refer to as “the FR II sample”), half of which have luminous EELRs and half of which do not, to fairly strong upper limits. The EELR and non-EELR quasars have been paired as closely as possible in both redshift and rest-frame optical continuum luminosity. Characteristics of all of the objects are tabulated in Table 1. For the EELR and non-EELR quasars, the mean redshifts are 0.318 and 0.312, respectively. The continuum luminosities are measured at H, and the mean values for log (erg s-1) are 45.23 and 45.26. The radio powers of the subsamples are also similar, with mean values for log (W Hz-1) of 27.32 and 27.44. We also include 1 EELR quasar with a compact steep-spectrum (CSS) one-sided radio jet, 3C 48, which is a special object in a number of other ways (see, e.g., Canalizo & Stockton 2000; Stockton et al. 2007) and will be discussed apart from the FR II sample.
Deep MIR spectra of all 13 quasars were obtained with the Spitzer Infrared Spectrograph (IRS; Houck et al., 2004) as part of our Cycle 4 GO program (PID 40001). All of the objects were observed in the standard staring mode with the Short Low 1st order module (SL1, 7.514.2 m). The slit width was 3.7″ or 16.5 kpc at . Each observation consisted of a 60 s ramp for 816 cycles with two nod positions. The total integration time was about 1632 minutes. We used the IDL procedure IRSCLEAN111All of the data reduction software mentioned in this section is available at the Spitzer Science Center website at http://ssc.spitzer.caltech.edu/. (ver. 1.9) to remove bad pixels in the pipeline post-BCD coadded nod-subtracted images and extracted the spectra with SPICE (ver. 2.1.2) using the optimal extraction method for point sources.
FIR photometry at 24, 70, and 160 m was obtained with the Multiband Imaging Photometer for Spitzer (MIPS; Rieke et al., 2004) either as part of our GO program or from the archive (PIDs 00049, 00082, 20084). All of the observations were obtained using the small-field default resolution photometry mode. Typical integration time per pixel was 42 s at 24 m (3 s exposure for 1 cycle or 3 s1), 700 s at 70 m (10 s7), and 80 s at 160 m (10 s4). Our data reduction started from the pipeline BCD files. For 24 m observations, final mosaic images were constructed with the MOPEX software after self-flat-fielding and background correction. At 70 and 160 m, we used the pipeline filtered BCDs to construct mosaics for most of the sources. 3C 48 and 3C 351 are so bright at 70 m that they have to be masked out before applying the spatial and temporal filters; we thus used the offline IDL filtering procedures by D. Fadda and D. Frayer to generate filtered BCDs. The non-filtered 160 m BCDs of 3C 48 were used because they result in a better mosaic image than the filtered BCDs. Point sources were extracted with APEX, and point response function (PRF)-fitting photometry was carried out. All of the sources were detected at 24 and 70 m, but only 4 were detected at 160 m. Upper limits at 160 m were estimated from the standard deviation images associated with the mosaics using an aperture of 48″ and corrected for the finite aperture size by multiplying the values by 1.6 (MIPS Data Handbook). The photometry results are listed in Table 1. The systematic uncertainties were estimated to be 4% at 24 m, 5% at 70 m, and 12% at 160 m (Engelbracht et al., 2007; Gordon et al., 2007; Stansberry et al., 2007). Statistical errors from the PRF fitting are much smaller and therefore could be neglected.
3. Results
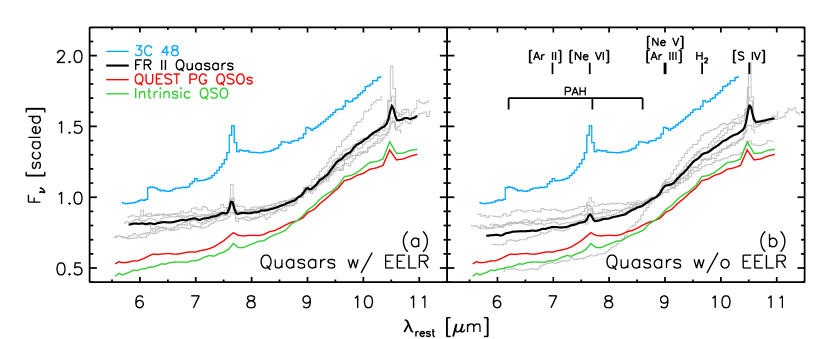
We did not detect PAH emission in any of the FR II quasars, although strong PAH features were clearly seen at 6.2, 7.7, and 8.6 m in the spectrum of the CSS quasar 3C 48. It was already known that the host galaxy of 3C 48 is undergoing intense star formation, with evidence from both its warm IRAS FIR color and the young stellar populations revealed by deep optical spectra (Canalizo & Stockton, 2000). The luminosity of the PAH 7.7 m feature () is about , implying a SFR of 680 yr-1 (SFR[ yr-1] = 283 [1010 ], assuming = 0.0061 and SFR[ yr-1] = 1.73 [1010 ]; Veilleux et al. 2009; Kennicutt 1998. Here, and throughout this paper, refers to the star-forming luminosity in the rest-frame 8–1000 m range). The aromatic features remain undetected even in the stacked spectrum of the FR II sample. In Fig. 1 we show average spectra of two subsamples—FR II quasars with and without EELRs, each containing six objects. The average spectra of the two subsamples do not differ: basically, one sees only narrow high-ionization emission lines superposed on a featureless continuum. Netzer et al. (2007) provided a composite spectrum of 28 PG QSOs with IRS spectra, as well as an “intrinsic” QSO spectral energy distribution (SED) from 1.2 to 70 m, which was constructed by combining 8 FIR-weak PG QSOs (presumably with little star formation) and subtracting a scaled starburst component. The MIR portion of these two SEDs is also shown in Fig. 1 for comparison. Broad PAH emission is clearly seen in the composite PG QSO spectrum, but by design it is absent from the intrinsic QSO spectrum. The average spectra of FR II quasars are consistent with being entirely intrinsic QSO emission.
We compute the upper limits to the PAH 7.7m flux based on the noise in the region between 6.5 and 8.5 m excluding the narrow [Ne vi] line. A low-order polynomial fit to the continuum is subtracted from each individual spectrum and the standard deviation (i.e., noise) of the residual is determined. To obtain the upper limits, we assume that the undetected PAH has a Lorentzian profile with the same width (0.6 m FWHM) as our best fit to the 3C 48 PAH 7.7m feature and that its peak amplitude cannot be greater than 5 times the noise level. This peak-to-noise ratio of 5 corresponds to a total S/N of 14 if we use the optimal aperture of 1.45 FWHM. The PAH upper limits reported in Table 1 are consistent with the upper limits obtained by Schweitzer et al. (2006) for the 3 quasars that are in both samples, once one takes into account the 18 longer integrations of our observations. Furthermore, we found that the PAH feature would have been clearly seen in both stacked spectra and individual spectra if synthetic PAH emission with these upper limits were to be added to every object.
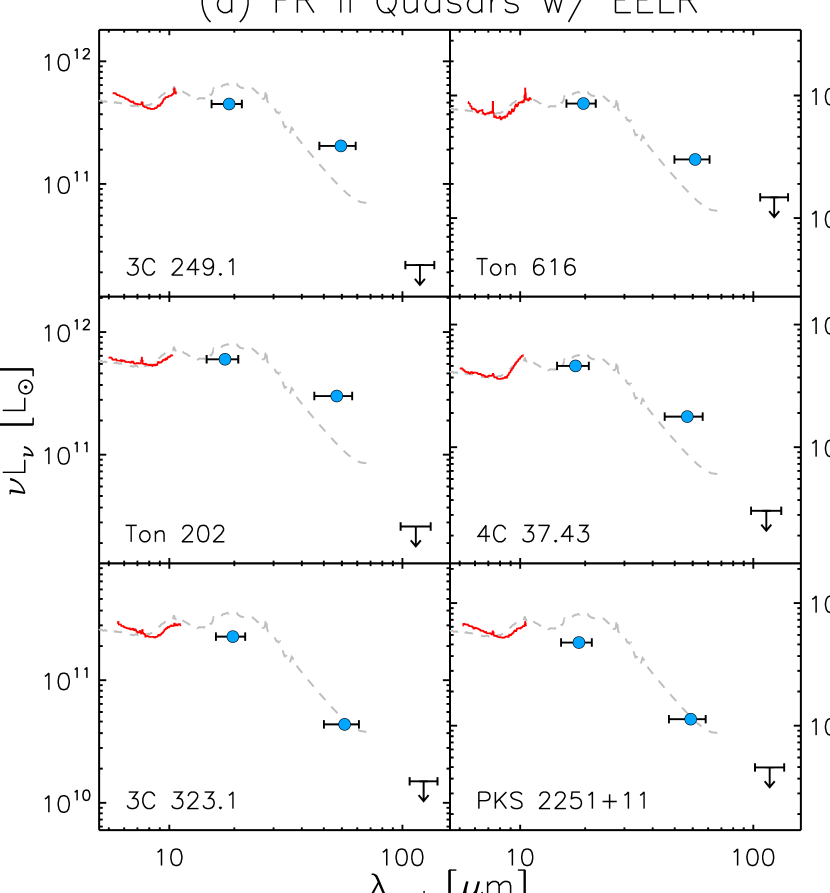
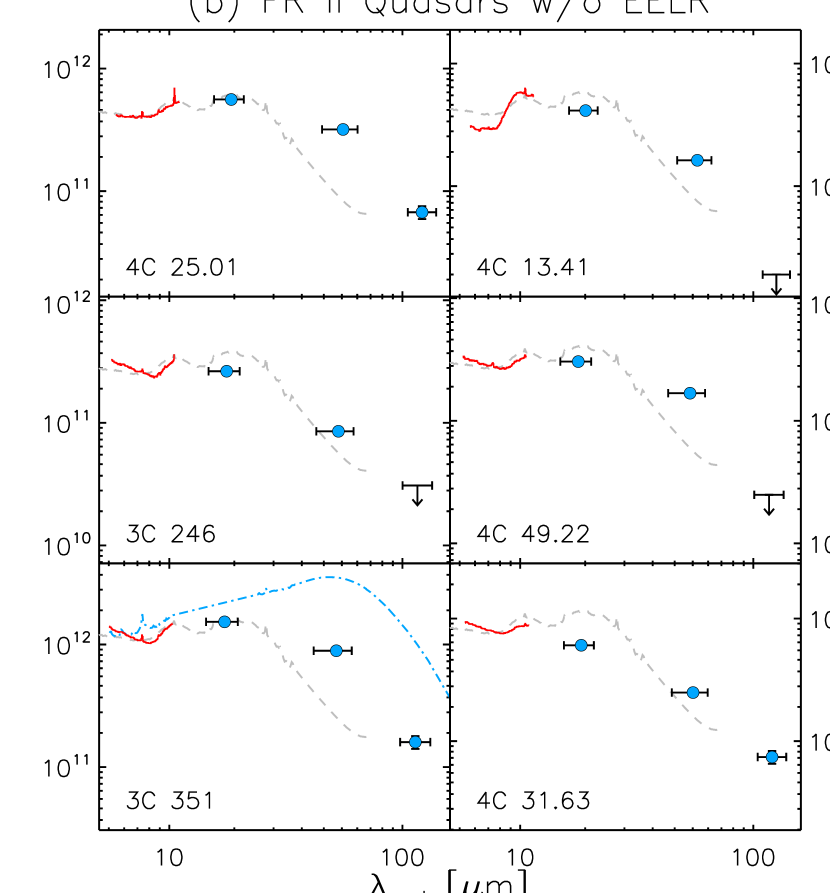
Figure 2 shows the MIR–FIR SEDs of our FR II quasars. A scaled version of the Netzer et al. (2007) intrinsic QSO SED is included in each panel for comparison. Most of the SEDs probed by IRS show steady rises towards both ends of the spectrum and a dip near 8 m; these features are readily seen in the intrinsic QSO SED and can be attributed to a combination of hot dust blackbody emission and silicate emission that peaks near 10 m. As an example of starburst quasars, the SED of 3C 48 is overplotted in the panel of 3C 351, the most FIR luminous FR II quasar in our sample. The SEDs of the FR II quasars can be mostly explained as intrinsic QSO emission without a starburst component. The SEDs of quasars with EELRs and the ones without EELRs are essentially the same. These results are consistent with our PAH measurements, as described in the two preceding paragraphs.
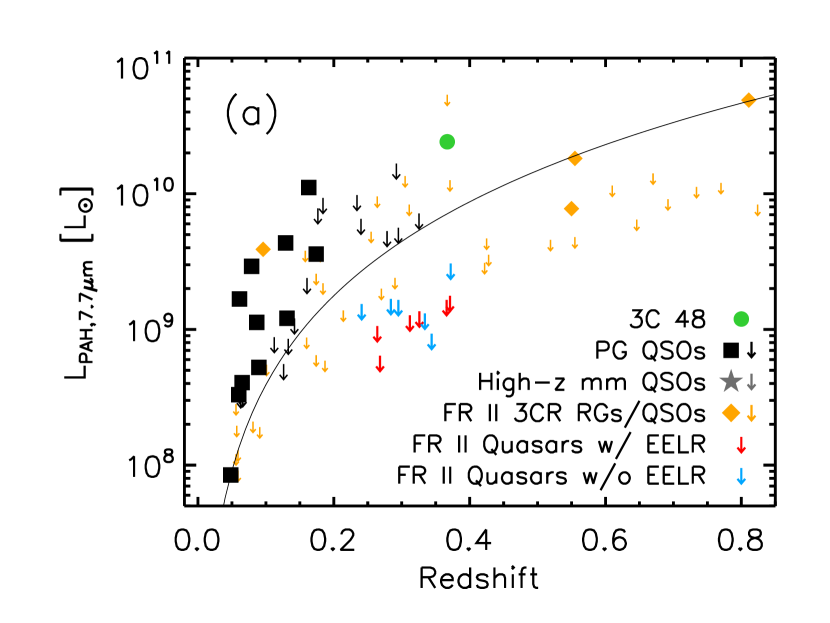
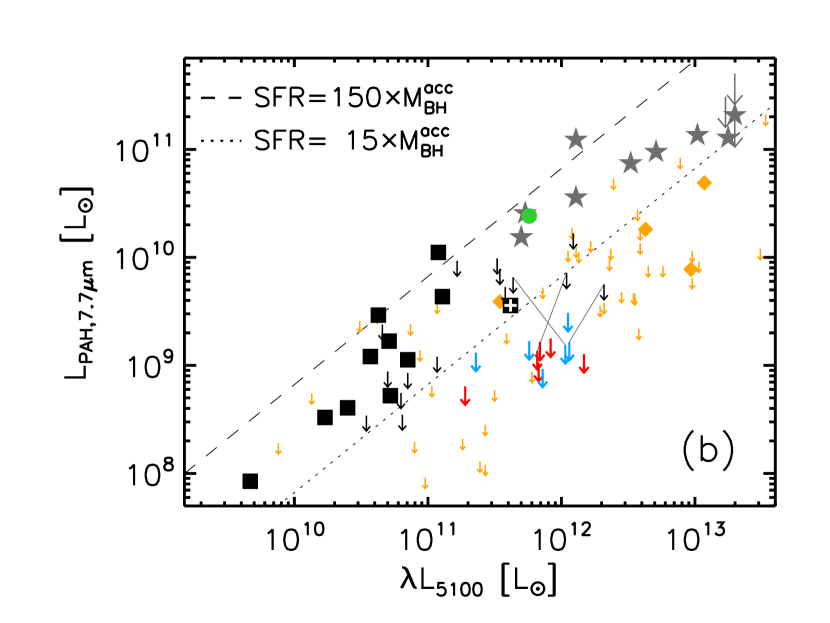
A luminosity correlation between the optical continuum and the PAH emission has been observed in low-redshift PG QSOs and high-redshift millimeter-bright QSOs (Netzer et al., 2007; Lutz et al., 2008). This correlation implies an intimate connection between QSO nuclear activity, as indicated by the strength of the continuum at rest-frame 5100 Å, and star formation in their host galaxies, as traced by the PAH emission. While the median redshift of our sample is significantly above that of the PG sample, our IRS exposures, which are typically times those for the PG sample, are sufficient to give luminosity upper limits that are lower than the detections or upper limits for the bulk of the PG sample (see Fig. 3). Figure 3 examines whether our FR II quasars are consistent with this optical-continuum/PAH correlation. We converted the continuum luminosities under H from Stockton & MacKenty (1987) to by multiplying the values by a factor of 1.74 (after the correction for cosmology), which was determined by comparing the two continuum luminosities of the three quasars in both our sample and the Netzer et al. (2007) sample. Also plotted in Figure 3 are the 32 FR II radio galaxies and 15 FR II quasars from the 3CR sample of Shi et al. (2007), which have both 7.7 m PAH measurements from IRS spectra and [O iii] and/or [O ii] fluxes from the literature (see Jackson & Rawlings 1997 and references therein222An electronic version of the catalog is available at http://www.science.uottawa.ca/cwillott/3crr/3crr.html). We converted their [O iii] or [O ii] luminosities into based on the observed [O iii]-continuum correlation for type-1 QSOs (; Zakamska et al., 2003; Heckman et al., 2004) and assuming [O iii]/[O ii] = 3.3, as measured from sources where fluxes of both lines are available. It is evident that the FR II quasars/radio galaxies fall systematically below the correlation established by the PG QSOs and the Lutz et al. (2008) mm-bright QSOs.
Five of the QSOs in the Netzer et al. (2007) sample are radio-loud, among which three are also in our sample (4C 13.41, 4C 31.63, and PKS 2251+11). The remaining two are PG 1302102 and PG 2349014. PG 1302102 has a flat radio spectrum and PAH was not detected ( ; Schweitzer et al. 2006). PG 2349014 has a steep radio spectrum and an FR II radio morphology. Although the aromatic 7.7m feature has been claimed to be detected in PG 2349014 ( ; Schweitzer et al. 2006), the low PAH luminosity places it at the transitional region between the FR II sources and the radio-quiet QSOs in Fig. 3b (the black square with a white plus sign).
The optical continuum luminosity at 5100 Å is widely used to estimate the bolometric luminosity for type-1 AGN (), which in turn provides the black hole accretion rate (BHAR) given a typical radiative efficiency of (Martinez-Sansigre & Taylor, 2008). The PAH luminosity can be converted into a SFR. As shown in Fig. 3, most of the PG QSOs in the Netzer et al. (2007) sample and the mm-bright QSOs in the Lutz et al. (2008) sample are within a narrow range of SFR/BHAR ratios, 15 SFR/BHAR 150; while our FR II quasars show significantly lower SFR at any given BHAR (we have conservatively assumed that ; see discussion of this ratio in §4.1). As the referee has pointed out, the observed separation in Figure 3b could also be explained by an on-average 10 higher radiative efficiency, , for FR II sources than for radio-quiet QSOs. However, the theoretically allowed range of is only from 0.054 to 0.42 (non-rotating and maximally rotating black holes, respectively; Shapiro & Teukolsky 1983), and, to make it worse, the presence of a jet can reduce the efficiency (Jolley & Kuncic, 2008). Therefore, a difference in could, at best, partially explain the large offset that we observe in Figure 3b. We note that to explain the Magorrian bulge massblack hole mass relation, under the assumption that star formation and black hole accretion are always coeval, a SFR/BHAR 700 is required (Häring & Rix, 2004). The measured low values have been used to argue for a much longer duration for star formation than that for the AGN activity (Netzer et al., 2007), making the existence of a SFR-BHAR correlation questionable.
4. Implications
4.1. Can Quasar EELRs be Produced by Starburst Superwinds?
Most of our EELR quasars have upper limits to of less than . The non-detection of PAH in the stacked spectrum of the entire sample of 12 FR II quasars shows that such upper limits are quite conservative. These upper limits imply a SFR yr-1. In the above calculation we used a higher ratio of 0.028 than in calculating the SFR of 3C 48 (0.0061, § 3), because it is both observed (e.g., Schweitzer et al., 2006) and theoretically predicted (e.g., Dale & Helou, 2002) that increases with decreasing IR luminosity. Following Shi et al. (2007), we determined for from the star-forming templates of Dale & Helou (2002). However, as discussed in Fu & Stockton (2006), to inject enough momentum into a typical EELR within a dynamical timescale of 10 Myr to explain the observed chaotic velocity field, the SFR of the central star burst must exceed yr-1 (eqs. [2][3] in Veilleux et al. 2005). More importantly, the absence of significant PAH emission in both FR II quasars with EELRs and the ones without strongly suggests that starburst is not a critical factor in the formation of an EELR. This conclusion is also supported by the MIPS photometry, which indicates that the FIR SED is dominated by warm dust directly heated by the quasars (Fig. 2).
4.2. Star Formation in FR II Quasars
Relations among mergers, starbursts and nuclear activities have long been sought after by extragalactic researchers (e.g., Sanders et al., 1988). Such connections are attractive because starbursts and AGN require many common triggering conditions, and gas-rich mergers can in principle provide these necessary conditions. Optical spectroscopy of QSO host galaxies, although technically challenging, has revealed diverse starforming properties. While active/recent star formation ( Myr) have been detected in the host galaxies of certain classes of QSOs, such as FIR-loud QSOs and post-starburst QSOs (e.g., Canalizo & Stockton, 2001), the majority of optically luminous QSOs show signs of past merger events and massive star formation that happened 12 Gyr ago (see Canalizo et al. 2006 for a review; also Canalizo et al. 2007; Bennert et al. 2008). A similar result has been found for the FR II radio galaxy 3C 79, which shows both a luminous EELR and evidence for a luminous quasar hidden from our direct view (Fu & Stockton, 2008).
About 40% of the PG QSOs studied by Schweitzer et al. (2006) show PAH emission in individual Spitzer IRS spectra, and PAH is also present in the average spectrum of the remaining QSOs. In sharp contrast, our considerably deeper IRS spectra of steep-spectrum radio-loud quasars show no evidence for PAH emission, either individually or averaged, except in the case of the CSS quasar 3C 48. In fact, previous Spitzer observations have found that powerful radio galaxies and quasars from the 3CR catalog (Spinrad et al., 1985) generally show FIR colors consistent with hot dust directly heated by the AGN (Shi et al., 2005) and weak or undetectable PAH emission (Haas et al., 2005; Ogle et al., 2006; Cleary et al., 2007; Shi et al., 2007), suggesting a lower level of star formation compared to the QSOs from the PG and 2MASS samples (Schmidt & Green, 1983; Cutri et al., 2001). The fraction of 3CR quasars/radio galaxies that show detectable PAH features is only 18%, compared to 48% for both PG and 2MASS QSOs in the same redshift range () and observed with the same instrument.
There are substantial reasons for believing that radio-loud quasars, at least at low redshifts, are drawn from a population of massive elliptical galaxies that may have suffered mergers in the fairly recent past, while many radio-quiet QSOs are found either in disk galaxies or in ongoing gas-rich mergers (Sikora et al., 2007, 2008; Wolf & Sheinis, 2008). We can test this explanation by looking at the PG QSOs in the Schweitzer et al. (2006) sample that also have morphological determinations by Guyon et al. (2006) or elsewhere in the literature. Of the 9 objects which had individual PAH detections and for which morphological information is available (8 of which are classified by Guyon et al.), all are classified either as having a disk or as “strongly interacting,” a term that almost always implies a gas-rich interaction or merger. It is not at all surprising that such host galaxies should show substantial star formation.
4.3. How Does 3C 48 Fit In?
At first sight, the CSS quasar 3C 48 seems to be a counter-example to the trend both Shi et al. (2007) and we have found for steep-radio-spectrum quasars. In particular, 3C 48 has one of the most luminous EELRs among low-redshift quasars, yet its host galaxy is also undergoing star formation at a prodigious rate (§3). Is 3C 48 simply an anomaly, perhaps related to its status as a CSS source, or can it be understood within the framework we have described? Because of the small size of our sample and the rather large uncertainties in quasar lifetimes and duty cycles, we can do little more than explore some of the possibilities related to these options. First, however, we summarize some of the special characteristics of 3C 48 and its host galaxy (see Stockton et al. 2007 for more detail).
Because 3C 48 shows a one-sided jet, one might suspect that the jet is oriented almost along our line-of-sight and is strongly Doppler boosted; however, Wilkinson et al. (1991) have argued from the weakness of the nuclear radio component that the jet is oriented closer to the plane of the sky and that the radio structure is intrinsically one sided; so the projected jet length of kpc is probably not too far from its actual length. 3C 48 is one of the only two CSS sources among powerful quasars with . Such sources are rare, not because they are intrinsically uncommon, but because the CSS stage of an extended radio source likely lasts only a short time, typically years (de Silva et al., 1999). The host galaxy of 3C 48 is clearly undergoing a major merger (Stockton & MacKenty, 1987; Canalizo & Stockton, 2000; Scharwächter et al., 2004; Stockton et al., 2007). The evidence suggests that the current episode of quasar activity has been triggered only relatively recently.
We consider first the possibility that 3C 48 is simply an earlier stage of the formation of an EELR like those in our FR II EELR subsample. This picture has considerable appeal, because we do see a massive ( M⊙) outflow of ionized gas extending over a large solid angle from a region near the base of the CSS radio jet, with velocities ranging up to km s-1(Chatzichristou et al., 1999; Canalizo & Stockton, 2000; Stockton et al., 2007). This outflow is consistent with the sort of quasar-jet-driven wind we have supposed to be responsible for producing the large-scale EELRs seen in 3C 48 and other quasars. Nevertheless, there are difficulties with this simple evolutionary view. Since 3C 48 also has an EELR on scales much larger than that of the current radio jet, one would have to appeal to a previous episode of quasar activity in order to produce it according to the scenario we have outlined. It is also not clear that the respective lifetimes of the EELR and the starburst would allow evidence for the starburst to die out quickly enough. EELR lifetimes are likely on the order of years, both from their close association with radio sources and from dynamical estimates. Vigorous star formation in 3C 48 is taking place not only in the nuclear region, but also over most of the host galaxy (Canalizo & Stockton, 2000). While we do not have similarly detailed spectroscopy for any of the host galaxies in our FR II sample, our deep spectroscopy of the FR II EELR radio galaxy 3C 79 has shown that its last significant episode of star formation was at least 1 Gyr ago (Fu & Stockton, 2008). This EELR, at least, could not have been produced in conjunction with a starburst like that occurring in 3C 48. While it is clear that some QSOs are triggered more-or-less simultaneously with massive starbursts (e.g., Canalizo & Stockton, 2001), many showing similar levels of QSO activity seem to have been triggered Gyr after major starbursts (Canalizo et al., 2006, 2007; Bennert et al., 2008), although we do not yet have a clear understanding why this should be so.
It seems, then, that 3C 48 is not likely to be an example of a direct precursor to objects like those in our FR II EELR subsample. Nevertheless, it does seem to be a close cousin. Its EELR has a luminosity similar to those of our other EELR quasars, and the massive outflow of ionized gas from the base of the radio jet seems a striking confirmation of the sort of process we have inferred, from less direct evidence, to have produced the massive EELRs in our FR II subsample (Fu & Stockton, 2009, and references therein). The crucial difference between 3C 48 and the rest is in whether a massive starburst is triggered approximately contemporaneously with the formation of the EELR. This difference, in turn, is likely to depend on the details of the mechanism by which gas is supplied to the system. In particular, the uniformly and abnormally low metallicities of the broad-line gas in the EELR quasars for which this measurement can be made (Fu & Stockton, 2007a) indicate an external source for this gas and suggest the mergers of a gas-rich late-type galaxies with massive early-type galaxies with little cold gas of their own. Although we do not have direct metallicity information for the broad-line region in 3C 48, the morphology of the merger, the large amounts of molecular gas present (Wink, Guilloteau, & Wilson, 1997), and the fact that it has , qualifying it as an “ultra-luminous infrared galaxy,” all suggest that it is a merger between two roughly equal-mass gas-rich galaxies.
4.4. Overview
Our deep Spitzer IRS spectra and MIPS photometry of matched subsamples of FR II quasars with and without luminous EELRs give tight upper limits to current SFRs for all of the quasars in both subsamples, supporting and extending earlier results on FR II quasars and radio galaxies by Shi et al. (2007). These upper limits indicate that SFRs, relative to BHARs, are generally much lower in FR II quasars than they are in optically selected QSO samples. In the FR II quasars, then, very little bulge mass is being added via star formation during the current episode of black-hole growth. Our star-formation upper limits are also sufficiently low that we can discount the possibility of galactic-scale superwinds resulting from star formation in the host galaxies of these quasars. As we mentioned in §1, the most luminous EELRs are always associated with quasars with strong radio jets, yet there is little significant morphological correspondence between the EELRs and the radio structure. This fact indicates a mechanism connected with the production of the radio jet that is much less strongly collimated than the jet itself. We have suggested in this context that the initiation of an FR II jet is accompanied by a nearly hemispherical blast wave (Fu & Stockton, 2007b). In the usual case of two jets, these blast waves can be capable, at least in some cases, of clearing most of the interstellar medium from the host galaxy. Although, as we have emphasized, 3C 48 is atypical in several ways, it is not unreasonable to suppose that it gives us a fairly typical picture of a very young radio jet; and in this case we see a massive, high-velocity, wide-solid-angle outflow coming from a region near the base of the radio jet, tending to corroborate the picture we have suggested for the FR II quasars with luminous EELRs.
References
- Akujor & Garrington (1991) Akujor, C. E., & Garrington, S. T. 1991, MNRAS, 250, 644
- Barthel (1989) Barthel, P. D. 1989, ApJ, 336, 606
- Bennert et al. (2008) Bennert, N., Canalizo, G., Jungwiert, B., Stockton, A., Schweizer, F., Peng, C. Y., & Lacy, M. 2008, ApJ, 677, 846
- Bridle et al. (1994) Bridle, A. H., Hough, D. H., Lonsdale, C. J., Burns, J. O., & Laing, R. A. 1994, AJ, 108, 766
- Canalizo et al. (2007) Canalizo, G., Bennert, N., Jungwiert, B., Stockton, A., Schweizer, F., Lacy, M., & Peng, C. 2007, ApJ, 669, 801
- Canalizo & Stockton (2000) Canalizo, G., & Stockton, A. 2000, ApJ, 528, 201
- Canalizo & Stockton (2001) —. 2001, ApJ, 555, 719
- Canalizo et al. (2006) Canalizo, G., Stockton, A., Brotherton, M. S., & Lacy, M. 2006, New Astronomy Review, 50, 650
- Chatzichristou et al. (1999) Chatzichristou, E. T., Vanderriest, C., & Jaffe, W. 1999, å, 343, 407
- Cleary et al. (2007) Cleary, K., Lawrence, C. R., Marshall, J. A., Hao, L., & Meier, D. 2007, ApJ, 660, 117
- Condon (1992) Condon, J. J. 1992, ARA&A, 30, 575
- Croft et al. (2006) Croft, S., van Breugel, W., de Vries, W., Dopita, M., Martin, C., Morganti, R., Neff, S., Oosterloo, T., Schiminovich, D., Stanford, S. A., & van Gorkom, J. 2006, ApJ, 647, 1040
- Cutri et al. (2001) Cutri, R. M., Nelson, B. O., Kirkpatrick, J. D., Huchra, J. P., & Smith, P. S. 2001, in ASP Conf. Ser. 232: The New Era of Wide Field Astronomy, Vol. 232, 78
- Dale & Helou (2002) Dale, D. A., & Helou, G. 2002, ApJ, 576, 159
- de Silva et al. (1999) de Silva, E., Saunders, R., Baker, J., & Hunstead, R. 1999, ASP Conf. Ser., 193, 79
- Engelbracht et al. (2007) Engelbracht, C. W., et al. 2007, PASP, 119, 994
- Fanaroff & Riley (1974) Fanaroff, B. L., & Riley, J. M. 1974, MNRAS, 167, 31
- Feng et al. (2005) Feng, W. X., An, T., Hong, X. Y., Zhao, J.-H., Venturi, T., Shen, Z. Q., & Wang, W. H. 2005, A&A, 434, 101
- Fu & Stockton (2006) Fu, H., & Stockton, A. 2006, ApJ, 650, 80
- Fu & Stockton (2007a) —. 2007, ApJ, 664, L75
- Fu & Stockton (2007b) —. 2007, ApJ, 666, 794
- Fu & Stockton (2008) —. 2008, ApJ, 677, 79
- Fu & Stockton (2009) —. 2009, ApJ, 690, 953
- Gopal-Krishna & Wiita (2000) Gopal-Krishna, & Wiita, P. J. 2000, A&A, 363, 507
- Gordon et al. (2007) Gordon, K. D., et al. 2007, PASP, 119, 1019
- Gower & Hutchings (1984) Gower, A. C., & Hutchings, J. B. 1984, AJ, 89, 1658
- Guyon et al. (2006) Guyon, O., Sanders, D., & Stockton, A. 2006, ApJS, 166, 89
- Häring & Rix (2004) Häring, N., & Rix, H.-W. 2004, ApJ, 604, L89
- Haas et al. (2005) Haas, M., Siebenmorgen, R., Schulz, B., Krügel, E., & Chini, R. 2005, A&A, 442, L39
- Heckman et al. (2004) Heckman, T. M., Kauffmann, G., Brinchmann, J., Charlot, S., Tremonti, C., & White, S. D. M. 2004, ApJ, 613, 109
- Ho & Keto (2007) Ho, L. C., & Keto, E. 2007, ApJ, 658, 314
- Houck et al. (2004) Houck, J. R., et al. 2004, ApJS, 154, 18
- Jackson & Rawlings (1997) Jackson, N., & Rawlings, S. 1997, MNRAS, 286, 241
- Jolley & Kuncic (2008) Jolley, E. J. D., & Kuncic, Z. 2008, MNRAS, 386, 989
- Kellermann et al. (1994) Kellermann, K. I., Sramek, R. A., Schmidt, M., Green, R. F., & Shaffer, D. B. 1994, AJ, 108, 1163
- Kennicutt (1998) Kennicutt, R. C., Jr. 1998, ARA&A, 36, 189
- Kewley et al. (2004) Kewley, L. J., Geller, M. J., & Jansen, R. A. 2004, AJ, 127, 2002
- Lutz et al. (2008) Lutz, D., et al. 2008, ApJ, 684, 853
- Martinez-Sansigre & Taylor (2008) Martinez-Sansigre, A., & Taylor, A. M. 2008, ArXiv e-prints, 0810, 3920
- Mould et al. (2000) Mould, J. R. et al. 2000, ApJ, 536, 266
- Netzer et al. (2007) Netzer, H., et al. 2007, ApJ, 666, 806
- Ogle et al. (2006) Ogle, P., Whysong, D., & Antonucci, R. 2006, ApJ, 647, 161
- Rieke et al. (2004) Rieke, G. H., et al. 2004, ApJS, 154, 25
- Rowan-Robinson et al. (1997) Rowan-Robinson, M., et al. 1997, MNRAS, 289, 490
- Sanders et al. (1988) Sanders, D. B., Soifer, B. T., Elias, J. H., Madore, B. F., Matthews, K., Neugebauer, G., & Scoville, N. Z. 1988, ApJ, 325, 74
- Scharwächter et al. (2004) Scharwächter, J., Eckart, A., Pfalzner, S., Zuther, J., Krips, M., & Straubmeier, C. 2004, A&A, 414, 497
- Schmidt & Green (1983) Schmidt, M., & Green, R. F. 1983, ApJ, 269, 352
- Schweitzer et al. (2006) Schweitzer, M., et al. 2006, ApJ, 649, 79
- Shapiro & Teukolsky (1983) Shapiro, S. L., & Teukolsky, S. A. 1983, Research supported by the National Science Foundation. New York, Wiley-Interscience, 1983, 663 p.
- Shi et al. (2007) Shi, Y., et al. 2007, ApJ, 669, 841
- Shi et al. (2005) —. 2005, ApJ, 629, 88
- Sikora et al. (2007) Sikora, M., Stawarz, L., & Lasota, J.-P. 2007, ApJ, 658, 815
- Sikora et al. (2008) Sikora, M., Stawarz, L., & Lasota, J.-P. 2008, New Astronomy Review, 51, 891
- Spinrad et al. (1985) Spinrad, H., Marr, J., Aguilar, L., & Djorgovski, S. 1985, PASP, 97, 932
- Stansberry et al. (2007) Stansberry, J. A., et al. 2007, PASP, 119, 1038
- Stocke et al. (1985) Stocke, J. T., Burns, J. O., & Christiansen, W. A. 1985, ApJ, 299, 799
- Stockton & MacKenty (1987) Stockton, A., & MacKenty, J. W. 1987, ApJ, 316, 584
- Stockton et al. (2002) Stockton, A., MacKenty, J. W., Hu, E. M., & Kim, T.-S. 2002, ApJ, 572, 735
- Stockton et al. (2007) Stockton, A., Canalizo, G., Fu, H., & Keel, W. 2007, ApJ, 659, 195
- Veilleux et al. (2005) Veilleux, S., Cecil, G., & Bland-Hawthorn, J. 2005, ARA&A, 43, 769
- Veilleux et al. (2009) Veilleux, S., et al. 2009, ApJ, submitted
- Veron-Cetty & Veron (2006) Veron-Cetty, M. P., & Veron, P. 2006, A&A, 455, 773
- Wilkinson et al. (1991) Wilkinson, P. N., Tzioumis, A. K., Benson, J. M., Walker, R. C., Simon, R. S., & Kahn, F. D. 1991, Nature, 352, 313
- Wink, Guilloteau, & Wilson (1997) Wink, J. E., Guilloteau, S., & Wilson, T. L. 1997, A&A, 322, 427
- Wolf & Sheinis (2008) Wolf, M. J., & Sheinis, A. I. 2008, AJ, 136, 1587
- Zakamska et al. (2003) Zakamska, N. L., et al. 2003, AJ, 126, 2125