References

Frank E. Walter    Stefano Battiston    and Frank Schweitzer Chair of Systems Design, ETH Zurich, Kreuzplatz 5, 8032 Zurich, Switzerland
fewalter@ethz.ch, sbattiston@ethz.ch, fschweitzer@ethz.ch

Personalised and Dynamic Trust in Social Networks

Frank E. Walter    Stefano Battiston    and Frank Schweitzer Chair of Systems Design, ETH Zurich, Kreuzplatz 5, 8032 Zurich, Switzerland
fewalter@ethz.ch, sbattiston@ethz.ch, fschweitzer@ethz.ch
Abstract

We propose a novel trust metric for social networks which is suitable for application to recommender systems. It is personalised and dynamic, and allows to compute the indirect trust between two agents which are not neighbours based on the direct trust between agents that are neighbours. In analogy to some personalised versions of PageRank, this metric makes use of the concept of feedback centrality and overcomes some of the limitations of other trust metrics. In particular, it does not neglect cycles and other patterns characterising social networks, as some other algorithms do. In order to apply the metric to recommender systems, we propose 
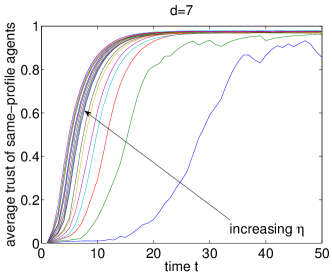
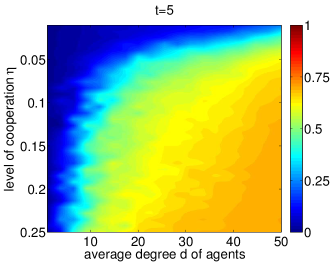
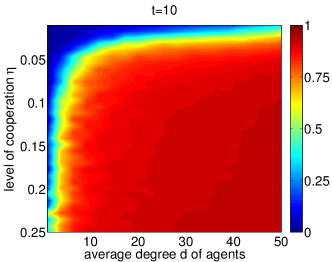
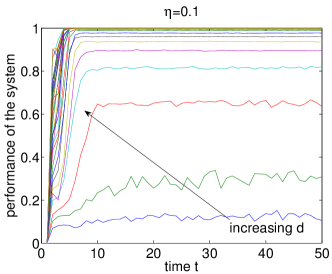
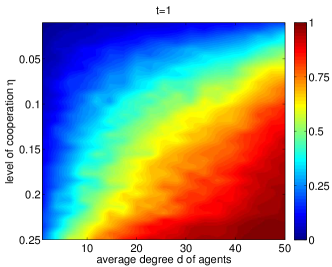
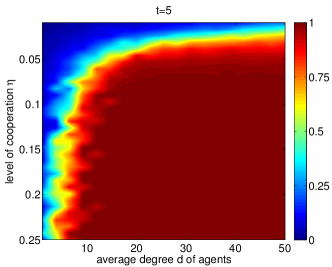
a way to make trust dynamic over time. We show by means of analytical approximations and computer simulations that the metric 
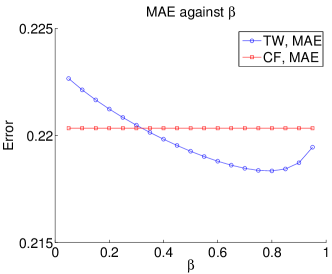
has the desired properties. Finally, we carry out an empirical validation on a dataset crawled from an Internet community and compare the performance of a recommender system using our metric to one using collaborative filtering.

  • [5]
  • [6] Keywords: Trust, Social Networks, Recommender Systems,
  • [7] Personalisation, Information Overload
  • [8]
  • [9]
  • 1 Introduction

  • [10] An increasing number of information technologies focuses on how web users can effectively share opinions about various types of products, services or even other users. These technologies are the basis of several types of Web 2.0 applications such as collaborative tagging, social bookmarking [cattuto07, golder05] and, in particular, also recommender systems. Given the heterogeneity of web users, a major issue is how to appropriately aggregate opinions in order to provide judgements that are useful for each individual user.
  • [11] Most of these applications use collaborative filtering algorithms which compute an index of similarity between users or between items, based on the ratings that users have provided on these items [goldberg92, herlocker99, montaner03a]. When a user belongs to a community with common, shared tastes, these algorithms work well in suggesting new items similar to the ones the users have already rated. There are several other benefits: except providing enough ratings, no further action is required of users; algorithms for collaborative filtering are scalable (when similarities are computed across items [sarwar01]); and, finally, they provide some level of personalisation. A shortcoming is that if users are looking for items which are seldomly rated by their community, the predictions are poor – e.g. people who have rated only travel books may not receive very good recommendations on tools for gardening.
  • [12] To cope with this, a line of research has focused on basing recommendations for users not on their similarity, but on their trust relations to other users. In this context, trust is meant to be the “expectancy of an agent to be able to rely on some other agent’s recommendations” [marsh94, walter08-jaamas]. There has been a body of work on “trust webs” [abdul-rahman00, grandison00, marsh94, sabater05] and on their application to recommender systems [golbeck05, massa06, montaner02b]. The small-world property of social networks [newman02] allows to potentially reach a lot of information, while the trust allows to filter out the relevant pieces [walter08-jaamas]. The benefits of these trust-based algorithms include strong personalisation, no need to have a long rating history in the system because recommendations are not based on similarity, and the ability to receive recommendations on items different from the ones already rated. Some limitations of the trust-based approach concern the scalability and the fact that, in addition to their ratings of items, users have to provide information about their level of trust to some other users.
  • [13] In this paper, we introduce a novel metric for trust in social networks. A trust metric allows to compute the indirect trust between two agents in a social network which are not neighbours, based on the direct trust between agents that are neighbours. While it is intuitive to do this on a chain, e.g. from user A𝐴A via user B𝐵B to user C𝐶C, for instance by multiplying the values of trust along the chain, it is not a priori trivial how to proceed when a graph contains multiple, redundant paths, cycles, or triangles (because of mathematical issues related to uniqueness and consistency). This is a crucial issue because these patterns all play an important role in social networks, in particular for the diffusion of information and the build-up of social capital [wassermann94, vega-redondo07]. Some trust metrics address these issues by reducing the direct trust graph to an acyclic graph before applying their computation of indirect trust [golbeck05, massa06]. Other metrics use only the path of the shortest distance or of the highest trust [walter08-jaamas]. Our trust metric takes all the paths in the graph into account and it is well-defined on any given graph. It provides each user with personalised trust ratings about other users in the network. Our metric also is dynamic, i.e. it evolves in time depending on how useful the information received by users is to them. This makes the metric suitable for application in recommender systems, as we will illustrate in the remainder of the paper.
  • [14]
  • [15]
  • 2 Background and Motivation

  • [16] Consider a scenario in which there is a social network of agents which have trust relationships among each other. This can be described by a graph in which the nodes represent the agents and the links represent the trust relationships. There also is a set of objects which can be rated by agents. Since each agent only knows a few objects, it may want to know other agent’s opinions on unknown objects. However, since there are potentially many opinions of other agents, it needs to be able to determine which of these are trustworthy. This implies that an agent needs to reason about the trustworthiness of other agents [walter08-jaamas]. However, since its time and resources are constrained, an agent can only build and maintain trust relationships with a limited number of other agents.
  • [17] Thus, if Tij[0, 1]subscript𝑇𝑖𝑗01T_{ij}\in[0,\,1] represents the level of direct trust of agent i𝑖i towards j𝑗j, how do we compute the indirect trust T~klsubscript~𝑇𝑘𝑙\tilde{T}_{kl} between two agents k𝑘k and l𝑙l that are not neighbours111Variables expressing indirect trust are as the corresponding ones expressing direct trust, but with a tilde symbol: e.g. T𝑇T and T~~𝑇\tilde{T}.?
  • [18] In the following, we will describe the TrustWebRank metric for computing indirect trust in a network with direct trust. This metric builds on the concept of feedback centrality which assigns a centrality score to the nodes of a network based on the centrality scores of the node’s neighbours. In other words, in feedback centrality, the higher (or lower) the centrality score of a node’s neighbours, the higher (or lower) this node’s own centrality is. These principles can be adapted to define a metric for the trustworthiness of agents in a social network with trust relationships.
  • [19] We briefly review PageRank, one of the most widely known and studied feedback centrality algorithms [brin98, brandes05]. In our scenario this would mean to assign a trustworthiness score cisubscript𝑐𝑖c_{i} to an agent i𝑖i that depends on the trustworthiness of its neighbours j𝑗j (adapted from [brandes05]):
    ci=β{j:iNj}cj|Nj|+(1β)i,subscript𝑐𝑖𝛽subscriptconditional-set𝑗𝑖subscript𝑁𝑗subscript𝑐𝑗subscript𝑁𝑗1𝛽for-all𝑖\displaystyle c_{i}=\beta\sum_{\{j:i\in N_{j}\}}{\frac{c_{j}}{|N_{j}|}}+(1-\beta)\quad\forall i, (1)
    where Nisubscript𝑁𝑖N_{i} is the set of neighbours of i𝑖i, and β𝛽\beta is a damping factor which is chosen around 0.80.80.8 [brin98]. In vector notation:
    c=βPc+(1β)1,𝑐𝛽𝑃𝑐1𝛽1\displaystyle c=\beta Pc+(1-\beta)\mathit{1}, (2)
    where P𝑃P is a stochastic222We will always assume row-stochastic when we state “stochastic”; this does not imply that the matrix need (or not) to be column-stochastic. transition matrix defined as
    Pij={1|Nj|if there exists a link from j to i0otherwise.subscript𝑃𝑖𝑗cases1subscript𝑁𝑗if there exists a link from 𝑗 to 𝑖0otherwise.\displaystyle P_{ij}=\left\{\begin{array}[]{ll}\frac{1}{|N_{j}|}&\textrm{if there exists a link from\ }j\textrm{\ to \ }i\\ 0&\textrm{otherwise.}\\ \end{array}\right. (5)
    Eqs. (1) and (5) can easily be extended to weighted graphs [brandes05]. Solving Eq. (2) for c𝑐c we obtain:
    c𝑐\displaystyle c =\displaystyle= (IβP)1(1β)1,superscript𝐼𝛽𝑃11𝛽1\displaystyle(I-\beta P)^{-1}(1-\beta)\mathit{1}, (6)
    where I𝐼I is the identity matrix and 11\mathit{1} is the vector consisting of ones. Since P𝑃P is, by construction, stochastic and thus, by the Perron-Frobenius theorem [seneta06], the largest eigenvalue is λPF(P)=1subscript𝜆PF𝑃1\lambda_{\mathrm{PF}}(P)=1, it follows that λPF(βP)=β<1subscript𝜆PF𝛽𝑃𝛽1\lambda_{\mathrm{PF}}(\beta P)=\beta<1. This ensures the existence of a unique solution of c𝑐c. Usually, one uses Jacobi iteration to compute such a solution.
  • [20] The result of applying this algorithm to a graph is a vector which gives a score of the trustworthiness cisubscript𝑐𝑖c_{i} for each node i𝑖i in the graph. Note that this is a global metric, i.e. there is one score for each agent. It has been observed in the literature that, for recommender systems, such metrics are often not appropriate and that local metrics, which are personalised for each agent (“how trustworthy is agent i𝑖i from the perspective of agent j𝑗j”), are required [massa06]. EigenTrust, for example, is a PageRank-inspired, global trust metric [kamvar03].
  • [21]
  • [22]
  • 3 A Novel Trust Metric

  • [23]
  • [24]
  • 3.1 From Centrality to Trust

  • [25] Proceeding in analogy to PageRank and using the principles of feedback centrality to construct a personalised metric for trust, one could define the indirect trust of agent i𝑖i to j𝑗j as the indirect trust of the neighbour agents k𝑘k of agent i𝑖i to agent j𝑗j, weighted by the trust of agent i𝑖i towards these neighbour agents k𝑘k. Let T𝑇T be the trust matrix, where Tij[0,1]subscript𝑇𝑖𝑗01T_{ij}\in[0,1] reflects the direct trust from agent i𝑖i to agent j𝑗j (Tij=0subscript𝑇𝑖𝑗0T_{ij}=0 if there is no link between agent i𝑖i and agent j𝑗j). S𝑆S is the stochastic matrix
    Sij=TijkNiTik,subscript𝑆𝑖𝑗subscript𝑇𝑖𝑗subscript𝑘subscript𝑁𝑖subscript𝑇𝑖𝑘\displaystyle S_{ij}=\frac{T_{ij}}{\sum_{k\in N_{i}}T_{ik}}, (7)
    where Nisubscript𝑁𝑖N_{i} is the set of neighbours of agent i𝑖i. S𝑆S is a normalisation of T𝑇T. We define T~ijsubscript~𝑇𝑖𝑗\tilde{T}_{ij} to be the indirect trustworthiness score from i𝑖i to j𝑗j:
    T~ij=kNiSikT~kji,jsubscript~𝑇𝑖𝑗subscript𝑘subscript𝑁𝑖subscript𝑆𝑖𝑘subscript~𝑇𝑘𝑗for-all𝑖𝑗\displaystyle\tilde{T}_{ij}=\sum_{k\in N_{i}}{S_{ik}\tilde{T}_{kj}}\quad\forall i,j (8)
    This allows us to estimate the trust between any two agents i𝑖i and j𝑗j: if there is a link between i𝑖i and j𝑗j, Tijsubscript𝑇𝑖𝑗T_{ij} reflects the trust between them; if there is no link between i𝑖i and j𝑗j, T~ijsubscript~𝑇𝑖𝑗\tilde{T}_{ij} reflects the trust between them. Notice that this definition is similar to to the approaches used in [golbeck05, massa06]. In matrix notation, this is the recursive definition
    T~=ST~~𝑇𝑆~𝑇\displaystyle\tilde{T}=S\tilde{T} (9)
  • [26] Notice that this approach has several limitations:
  • [27] 1) Uniqueness of the solution: Let v~jsubscript~𝑣absent𝑗\tilde{v}_{*j} be one column of T~~𝑇\tilde{T}, i.e. the vector that expresses how much agent j𝑗j is trusted by other agents. Then, Eq. (9) gives
    v~j=Sv~jsubscript~𝑣absent𝑗𝑆subscript~𝑣absent𝑗\displaystyle\tilde{v}_{*j}=S\tilde{v}_{*j} j.for-all𝑗\displaystyle\forall j. (10)
    If S𝑆S is acyclic [seneta06] (i.e. the underlying graph is so), then there is a unique solution of Eq. (10). If S𝑆S is not acyclic, it can be either primitive or non-primitive [horn90]. If S𝑆S is primitive (and stochastic), there is a unique solution of Eq. (10), a vector with all components being identical [seneta06]. This would imply that all agents i𝑖i would trust agent j𝑗j equally, which is obviously not desirable. If S𝑆S is not primitive, there are multiple solutions for Eq. (10), which also is not desirable.
  • [28] One way of dealing with this could be to make S𝑆S acyclic, for example by constructing a tree with a breadth-first search (BFS) from a chosen node, as for example [golbeck05, massa06] do. The BFS selects one node as a root, and from there on, explores the neighbours of the nodes, proceeding in levels 1,2,3,1231,2,3,\ldots and removing links within a level and links from level k𝑘k to level l𝑙l where l<k𝑙𝑘l<k at each step. However, this entails further limitations:
  • [29] Social networks are characterised by a high clustering coefficient [wassermann94, newman02, vega-redondo07]. By making the underlying graph of a social network acyclic, one removes the links within each level and the links from levels k𝑘k to l𝑙l where lk𝑙𝑘l\leq k, thus making the clustering coefficient 00. This implies that, subsequent to this procedure, the trust metric will not be able to differentiate well between regions of high clustering (thus, possibly high trust) and regions with lower clustering (thus, possibly lower trust) as on the original graph.
  • [30] Further, depending on which node is chosen as the root of the BFS, the acyclic graph will be different. This is not a problem in a decentralised scenario, when the computation is spread over many nodes. In this case, each node computes its own set of v~jsubscript~𝑣absent𝑗\tilde{v}_{*j} by being root of its own breadth-first exploration. However, this is a problem in a centralised scenario, where such an approach is not scalable and also not mathematically tractable: as a result of a BFS rooting at each i𝑖i, the computation uses a different matrix T𝑇T for each node.
  • [31] 2) Combination of direct and indirect trust: The metric defined in Eq. (8) is not able to account properly for the following situation: consider an agent i𝑖i that trusts a neighbour agent j𝑗j with intermediate level of trust, e.g. Tij0.5subscript𝑇𝑖𝑗0.5T_{ij}\approx 0.5, because it does not yet know this agent well. If many of the other neighbours of agent i𝑖i trust agent j𝑗j, this should increase the trust between agent i𝑖i and j𝑗j. This does not happen with the current definition of trust.
  • [32] 3) Normalisation of trust: another property, resulting from Eq. (7), is that the normalisation removes knowledge from the system. If an agent i𝑖i trusts n𝑛n neighbours equally, it does not matter whether it trusts them a lot or a little in [0,1]01[0,1] – the normalisation would assign the same value of trust of 1n1𝑛\frac{1}{n} to each of the neighbours. Then, during propagation, only the relative trust compared to other neighbours is considered. Equally, suppose that an agent i𝑖i has just one neighbour agent j𝑗j – no matter whether i𝑖i trusts j𝑗j highly or lowly, in each case the normalisation would cause the trust from i𝑖i to j𝑗j to be 111. The normalisation is necessary, however, to have values of direct and indirect trust which are in the same range.
  • [33]
  • [34]
  • 3.2 The TrustWebRank Metric

  • [35] Thus, given these limitations, can we modify Eq. (8) in such a way that the following requirements are met?
  • [36] Requirement 1: The solution of the equation over graphs with cycles is unique, but not trivial.
  • [37] Requirement 2: The range of indirect trust is the same as for direct trust, i.e. [0,1]01[0,1], so that direct and indirect trust can be compared.
  • [38] Requirement 3: In the metric, direct trust “adds on” to indirect trust (capturing the fact that it complements it).
  • [39] One possibility to address these issues is the following: we compute the indirect value of trust between two agents i𝑖i and j𝑗j based on the direct trust between them, if there is any, but also based on the trust that the neighbours of i𝑖i have in j𝑗j:
    T~ij=Sij+βkNiSikT~kji,j,subscript~𝑇𝑖𝑗subscript𝑆𝑖𝑗𝛽subscript𝑘subscript𝑁𝑖subscript𝑆𝑖𝑘subscript~𝑇𝑘𝑗for-all𝑖𝑗\displaystyle\tilde{T}_{ij}=S_{ij}+\beta\sum_{k\in N_{i}}{S_{ik}\tilde{T}_{kj}}\quad\forall i,j, (11)
    where β[0,1)𝛽01\beta\in[0,1). Now, in matrix form Eq. (11) is
    T~~𝑇\displaystyle\tilde{T} =\displaystyle= S+βST~,𝑆𝛽𝑆~𝑇\displaystyle S+\beta S\tilde{T}, (12)
    and, using elementary algebra, we can derive
    T~~𝑇\displaystyle\tilde{T} =\displaystyle= (IβS)1S.superscript𝐼𝛽𝑆1𝑆\displaystyle(I-\beta S)^{-1}S. (13)
    There exists a unique, non-trivial solution to Eq. (13) if λPF(βS)<1subscript𝜆PF𝛽𝑆1\lambda_{\mathrm{PF}}(\beta S)<1, [horn90]. Since S𝑆S is stochastic, i.e. λPF(S)=1subscript𝜆PF𝑆1\lambda_{\mathrm{PF}}(S)=1, and β[0,1)𝛽01\beta\in[0,1), it follows that λPF(βS)<1subscript𝜆PF𝛽𝑆1\lambda_{\mathrm{PF}}(\beta S)<1 (Requirement 1).
  • [40] The parameter β𝛽\beta has a similar role as the damping factor in PageRank in Eq. (1): given β[0,1)𝛽01\beta\in[0,1), the impact of agents far away in the social network is discounted. This can be seen more clearly when expressing (1βS)1superscript1𝛽𝑆1(1-\beta S)^{-1} as a geometric sum in Eq. (13) [horn90]:
    T~=(1βS)1S=k=0(βS)kS=S+βS2+β2S3+~𝑇superscript1𝛽𝑆1𝑆superscriptsubscript𝑘0superscript𝛽𝑆𝑘𝑆𝑆𝛽superscript𝑆2superscript𝛽2superscript𝑆3\displaystyle\tilde{T}=(1-\beta S)^{-1}S=\sum_{k=0}^{\infty}{(\beta S)^{k}S}=S+\beta S^{2}+\beta^{2}S^{3}+\ldots (14)
    The k𝑘kth power of the adjacency matrix of a graph gives the number of walks of length k𝑘k between any two nodes in the graph. Similarly, the k𝑘kth power of the matrix S𝑆S gives the sum of the products of the weights along all walks of length k𝑘k in the underlying graph of S𝑆S. In Eq. (14), the higher the length of the walks, the stronger the discount (since β<1𝛽1\beta<1). As in PageRank, a reasonable value of β𝛽\beta turns out to be around 0.750.750.75 to 0.850.850.85 (see Section 4.5). Note that T~ij[0,1]subscript~𝑇𝑖𝑗01\tilde{T}_{ij}\notin[0,1]. We can normalise it to
    S~ij=T~ijkNiT~iksubscript~𝑆𝑖𝑗subscript~𝑇𝑖𝑗subscript𝑘subscript𝑁𝑖subscript~𝑇𝑖𝑘\displaystyle\tilde{S}_{ij}=\frac{\tilde{T}_{ij}}{\sum_{k\in N_{i}}{\tilde{T}_{ik}}} (15)
    to ensure the comparability of values of direct and indirect trust (Requirement 2).
  • [41] Furthermore, if agents i𝑖i and j𝑗j are not neighbours, the indirect trust of i𝑖i to j𝑗j is entirely based on how much the neighbours of i𝑖i trust j𝑗j. However, if agent i𝑖i has a neighbour j𝑗j, the indirect trust of i𝑖i to j𝑗j will also incorporate how much the other neighbours of agent i𝑖i trust or do not trust agent j𝑗j (Requirement 3).
  • [42] The definition of Eqs. (11) and (12) naturally takes the real structure of a social network into account without needing to prune any link. Unlike to what would happen during the conversion of the underlying graph to a tree using a BFS, the algorithm preserves the links which, in a social network, lead to a high clustering coefficient, and are not negligible when reasoning about the social network itself [wassermann94, newman02, vega-redondo07].
  • [43] When dealing with huge graphs, however, inverting a matrix as required by Eq. (13) poses an issue of computation time and memory. Yet, instead of inverting a matrix or computing eigenvectors, it is possible to use an iterative method [brandes05] as follows:
    T~ij(k+1)=Sij+βlNiSilT~lj(k)i,j.superscriptsubscript~𝑇𝑖𝑗𝑘1subscript𝑆𝑖𝑗𝛽subscript𝑙subscript𝑁𝑖subscript𝑆𝑖𝑙superscriptsubscript~𝑇𝑙𝑗𝑘for-all𝑖𝑗\displaystyle\tilde{T}_{ij}^{(k+1)}=S_{ij}+\beta\sum_{l\in N_{i}}S_{il}\tilde{T}_{lj}^{(k)}\quad\forall i,j. (16)
    At each step k𝑘k, one only needs the neighbourhood Nisubscript𝑁𝑖N_{i} of a given agent i𝑖i, as well as access to the matrix of T~(k1)superscript~𝑇𝑘1\tilde{T}^{(k-1)} computed at the previous step k1𝑘1k-1. Notice that now we are computing a matrix while, with the centrality, e.g. in PageRank, we were computing a vector. This is natural since the centrality is one value per agent (it is a global notion), while trust is a value per pair of agents (it is a local, personalised notion). Therefore computing trust (O(N2)similar-toabsent𝑂superscript𝑁2\sim O(N^{2})) is inherently more expensive than computing centrality (O(N)similar-toabsent𝑂𝑁\sim O(N)). However, do we really need to compute indirect trust among all agents? In fact, for a given agent i𝑖i, computing the trust to a selected amount of other agents j𝑗j, if well chosen, will be sufficient, as the trust to agents far away in the network will be damped out anyway. So, the scalability of the trust computation rather is (O(mN)similar-toabsent𝑂𝑚𝑁\sim O(mN)), where m𝑚m is the number of other agents j𝑗j to consider for each agent i𝑖i.
  • [44]
  • [45]
  • 4 An Application of the Metric

  • [46] So far, we have described a trust metric which allows to compute a measure of trust between two agents which are not necessarily neighbours in a social network. We will now construct a simple model which applies this metric in the context of a recommender system. The purpose is to show how it is possible to compute predictions of how an agent i𝑖i likes a particular object o𝑜o (suppose a book, CD, or movie) based on how other agents j𝑗j liked that item combined with how much i𝑖i trusts j𝑗j.
  • [47]
  • [48]
  • 4.1 A Simple Model

  • [49] Suppose we have a system of agents embedded in a social network, defined by a graph and associated to an adjacency matrix A𝐴A. Each agent i𝑖i keeps track of its trust relationships to neighbours j𝑗j. These are reflected in the matrix of direct trust T𝑇T. Obviously, Tij>0subscript𝑇𝑖𝑗0T_{ij}>0 only if Aij=1subscript𝐴𝑖𝑗1A_{ij}=1. For the moment, we take the network to be described by a random graph [erdos59, bollobas85] in which each agent roughly has the degree d𝑑d.
  • [50] Let each agent i𝑖i be characterised by a profile πisubscript𝜋𝑖\pi_{i}. The profile expresses which ratings an agent would give to all possible objects; however, agents only know a subset of their ratings on objects. Given an object o𝑜o, rio{1,1}superscriptsubscript𝑟𝑖𝑜11r_{i}^{o}\in\{-1,1\} is the rating of agent i𝑖i on object o𝑜o. If an agent is willing to share all its opinions with other agents, then the set of all of its ratings corresponds to its profile; however, there may be agents which are not willing (because they want to keep their secrets) or able (because they simply do not know particular objects) to share ratings. This can be captured by a parameter η𝜂\eta which reflects the probability of an agent to share – i.e. signal – its rating with other agents. E.g., a value of η=0.1𝜂0.1\eta=0.1 would imply that, on average, at each time step 10 agents. At the moment, η𝜂\eta is the same value for all agents, but it could also be set differently for each agent i𝑖i or even for each pair of agents i𝑖i and j𝑗j.
  • [51] If an agent i𝑖i is not willing or able to share its rating for an object o𝑜o, the system computes a prediction piosuperscriptsubscript𝑝𝑖𝑜p_{i}^{o} as follows:
    pio=jNiS~ijrjo,superscriptsubscript𝑝𝑖𝑜subscript𝑗subscript𝑁𝑖subscript~𝑆𝑖𝑗superscriptsubscript𝑟𝑗𝑜\displaystyle p_{i}^{o}=\sum_{j\in N_{i}}{\tilde{S}_{ij}r_{j}^{o}}, (17)
    so pio[1,1]superscriptsubscript𝑝𝑖𝑜11p_{i}^{o}\in[-1,1], since jNiS~ij=1subscript𝑗subscript𝑁𝑖subscript~𝑆𝑖𝑗1\sum_{j\in N_{i}}\tilde{S}_{ij}=1 and rjo{1,1}superscriptsubscript𝑟𝑗𝑜11r_{j}^{o}\in\{-1,1\}. In vector notation,
    p=S~r,𝑝~𝑆𝑟\displaystyle p=\tilde{S}r, (18)
    i.e. the prediction for an agent i𝑖i is the sum of the ratings of all neighbours j𝑗j weighted by the indirect, normalised trust that agent i𝑖i has in these neighbours j𝑗j.
  • [52] Note that this bears resemblance to Collaborative Filtering (CF) [goldberg92, herlocker99] in which the prediction for an agent i𝑖i is also computed as a weighted sum of the ratings of all neighbours j𝑗j (not neighbours in a graph-theoretic sense, but neighbours in terms of similarity of ratings). The more similar a neighbour, the more influential its rating will be for the prediction. In our case, making a prediction based on the ratings of the trusted neighbours implies that we make the assumption that agents who are connected by trust have similar mind-sets. Notice that this does not imply that they have rated the same items – for example, one user could appreciate the knowledge of another user in gardening, even though his own domain are travel books. Thus, unlike the similarity that could be computed e.g. by Pearson correlation, this notion of similarity extends not just across rated items, but rather is an “expected” similarity reflecting a similar mind-set of two agents.
  • [53]
  • [54]
  • 4.2 Trust Dynamics

  • [55] So far, we have a static model which, based on the trust web of a particular agent i𝑖i and the ratings rjosuperscriptsubscript𝑟𝑗𝑜r_{j}^{o} of its neighbours j𝑗j, is able to compute predictions piosuperscriptsubscript𝑝𝑖𝑜p_{i}^{o} for that agent. We now would like to model the evolution of the trust network over time in the sense that, based on the quality of a particular recommendation, agent i𝑖i can update its trust to its neighbours j𝑗j. This adds a time dimension to the model and requires a mechanism to update the trust between neighbours. This can be done by adding a utility function: agents experience a utility by using the ratings or predictions of neighbours and then the trust update is coupled with the utility experienced. We define each agent i𝑖i to experience a utility uij(t)subscript𝑢𝑖𝑗𝑡u_{ij}(t) by following the recommendation from each neighbour j𝑗j at time t𝑡t as follows:
    uij(t)={1|rio(t)rjo(t)|if j signals to i1|rio(t)pjo(t)|otherwise.subscript𝑢𝑖𝑗𝑡cases1superscriptsubscript𝑟𝑖𝑜𝑡superscriptsubscript𝑟𝑗𝑜𝑡if 𝑗 signals to 𝑖1superscriptsubscript𝑟𝑖𝑜𝑡superscriptsubscript𝑝𝑗𝑜𝑡otherwise\displaystyle u_{ij}(t)=\left\{\begin{array}[]{ll}1-|r_{i}^{o}(t)-r_{j}^{o}(t)|&\textrm{if\ }j\textrm{\ signals to\ }i\\ 1-|r_{i}^{o}(t)-p_{j}^{o}(t)|&\textrm{otherwise}.\\ \end{array}\right. (21)
    Note that uij(t)[1,1]subscript𝑢𝑖𝑗𝑡11u_{ij}(t)\in[-1,1]. If the neighbour j𝑗j signals to agent i𝑖i, it knows the rating rjo(t)superscriptsubscript𝑟𝑗𝑜𝑡r_{j}^{o}(t); otherwise, it only knows a prediction pjo(t)superscriptsubscript𝑝𝑗𝑜𝑡p_{j}^{o}(t). The closer the recommendation of agent j𝑗j for agent i𝑖i to the rating of agent i𝑖i is, the greater the agents’ similarity is and thus the higher the utility uij(t)subscript𝑢𝑖𝑗𝑡u_{ij}(t) that agent i𝑖i experiences from the recommendation of agent j𝑗j at step t𝑡t is. Note that because of the level of cooperation η𝜂\eta – which affects whether agent j𝑗j signals to i𝑖i – the utility takes into account not only similarity [ziegler06], but also cooperation between agents. Based on the utility, agent i𝑖i can update the trust towards its neighbour agents j𝑗j. We distinguish four cases, based on the sign and the magnitude of the utility:
  • [56]
    • If the sign is positive, this means that the rating or prediction of a neighbour was good; if it is negative, it means that the rating or prediction was bad.

    • If the magnitude is large, the neighbour had a lot of trust in the rating/prediction of its own neighbours; if it is small, the neighbour had little trust in the rating/prediction of its own neighbours.

  • [57] This leads us to the following definition of how an agent i𝑖i updates its trust to agent j𝑗j from time t𝑡t to t+1𝑡1t+1:
    T˘ij(t+1)={γTij(t)+(1γ)|uij(t)|if uij(t)>uthr or uthruij(t)0γTij(t)(1γ)|uij(t)|if uij(t)<uthr or 0<uij(t)uthrsubscript˘𝑇𝑖𝑗𝑡1cases𝛾subscript𝑇𝑖𝑗𝑡1𝛾subscript𝑢𝑖𝑗𝑡if subscript𝑢𝑖𝑗𝑡subscript𝑢𝑡𝑟 or subscript𝑢𝑡𝑟subscript𝑢𝑖𝑗𝑡0𝛾subscript𝑇𝑖𝑗𝑡1𝛾subscript𝑢𝑖𝑗𝑡if subscript𝑢𝑖𝑗𝑡subscript𝑢𝑡𝑟 or 0subscript𝑢𝑖𝑗𝑡subscript𝑢𝑡𝑟\displaystyle\breve{T}_{ij}(t+1)=\left\{\begin{array}[]{l}\gamma T_{ij}(t)+(1-\gamma)|u_{ij}(t)|\\ \hskip 4.30554pt\textrm{if\ }u_{ij}(t)>u_{thr}\textrm{\ or\ }-u_{thr}\leq u_{ij}(t)\leq 0\\ \gamma T_{ij}(t)-(1-\gamma)|u_{ij}(t)|\\ \hskip 4.30554pt\textrm{if\ }u_{ij}(t)<-u_{thr}\textrm{\ or\ }0<u_{ij}(t)\leq u_{thr}\end{array}\right. (26)
    where we take uthr=0.5subscript𝑢𝑡𝑟0.5u_{thr}=0.5 and γ[0,1]𝛾01\gamma\in[0,1] is a parameter that controls the relative weights of the current history of trust between two agents, Tij(t)subscript𝑇𝑖𝑗𝑡T_{ij}(t), and of the current utility, uij(t)subscript𝑢𝑖𝑗𝑡u_{ij}(t). For γ>0.5𝛾0.5\gamma>0.5, this gives the history of trust more weight than the current utility. In the analysis and simulations (next section), we found that γ=0.75𝛾0.75\gamma=0.75 is a reasonable value. Since T˘ij[1,1]subscript˘𝑇𝑖𝑗11\breve{T}_{ij}\in[-1,1], but we want Tij[0,1]subscript𝑇𝑖𝑗01T_{ij}\in[0,1], we cap it to [0,1]01[0,1]:
    Tij(t+1)=max(0,min(1,T˘ij)).subscript𝑇𝑖𝑗𝑡101subscript˘𝑇𝑖𝑗\displaystyle T_{ij}(t+1)=\max(0,\min(1,\breve{T}_{ij})). (27)
  • [58]
  • Refer to caption
    Refer to caption
    Refer to caption
    Refer to caption
    Figure 1: Social network of agents and trust build-up over time in case of a fraction of agents not signalling as well as cycles in the underlying network: there are two profiles, red and blue, indicated by the cores of the node. Only square nodes are signalling; e.g., nodes 2, 3, and 4 are not signalling. There are two cycles from 4 to 7 and 8, respectively, to 9 and then to 4. After a few steps, the nodes learn which other nodes to trust.
  • [59] As an example, the effects of these dynamics are illustrated in Figure 1: this is an example of a network of agents having two profiles (red and blue). Some nodes are signalling (squares), others are not (circles). The network contains cycles. At t=1𝑡1t=1, the agents are just connected, the trust between all agents is equal to zero. At t=2𝑡2t=2, agent 3 and agent 4 have received recommendations from agents 5 and 6, and from agents 7 and 8, respectively. Since agent 3 (4) has the same profile as agents 5 and 6 (7 and 8), namely red (blue), it perceives a high positive utility from the recommendation and thus increases its trust to the recommending agents. At t=3𝑡3t=3, the system can now provide a recommendation to agent 2, even though agents 3 and 4 are not signalling their own rating. Since agent 2 has the same profile as agent 3, trust between these two agents increases. Agent 2 perceives a high negative utility from the recommendation of agent 4, thus its trust remains zero. At the same time, the links from 3 to 5 and 6 reinforce. The same happens in the cycles. These mechanisms continue and we see that at t=5𝑡5t=5, paths of trust have developed between agents of the same profile. Although agent 1 has no agents of its profile that are signalling in one or two levels of distance, it is still able to discover a path to two agents of its profile that are signaling and further away in the network.
  • [60]
  • [61]
  • 4.3 Analysis of the Model

  • [62] In this section we derive a self-consistent equation for the matrix of trust which allows to investigate the dynamics of trust. We analyse the case of a population of agents with only two opposite profiles (see Section 4.1) which provide ratings on objects as +11+1 or 11-1, respectively.
  • [63] We want to compute the expected value of trust at the equilibrium of the dynamics defined in Eqs. (26) and (27). We do so by a mean-field approximation in which we replace the utility uij(t)subscript𝑢𝑖𝑗𝑡u_{ij}(t) in Eq. (26) with the expected utility over time, denoted by uij:=E(uij(t))assignsubscript𝑢𝑖𝑗𝐸subscript𝑢𝑖𝑗𝑡u_{ij}:=E(u_{ij}(t)) (without the time dependency). We impose Tij(t)=Tij(t+1)subscript𝑇𝑖𝑗𝑡subscript𝑇𝑖𝑗𝑡1T_{ij}(t)=T_{ij}(t+1) at the equilibrium, obtaining
    Tij=max(min(uij,1),0),subscript𝑇𝑖𝑗subscript𝑢𝑖𝑗10\displaystyle T_{ij}=\max(\min(u_{ij},1),0), (28)
    which requires us to estimate uijsubscript𝑢𝑖𝑗u_{ij}. Given the definition of uij(t)subscript𝑢𝑖𝑗𝑡u_{ij}(t) in Eq. (21) and the fact that agents signal a rating with probability η𝜂\eta and they do not with probability 1η1𝜂1-\eta, it follows that the expected utility uijsubscript𝑢𝑖𝑗u_{ij} is
    uij=η(1|πiπj|)+(1η)(1|πikS~jkπk|).subscript𝑢𝑖𝑗𝜂1subscript𝜋𝑖subscript𝜋𝑗1𝜂1subscript𝜋𝑖subscript𝑘subscript~𝑆𝑗𝑘subscript𝜋𝑘\displaystyle u_{ij}=\eta(1-|\pi_{i}-\pi_{j}|)+(1-\eta)(1-|\pi_{i}-\sum_{k}\tilde{S}_{jk}\pi_{k}|). (29)
    Since we are considering the simple case in which agents signal faithfully, the expected rating provided by an agent j𝑗j coincides with its profile: E(rjo)=πj𝐸superscriptsubscript𝑟𝑗𝑜subscript𝜋𝑗E(r_{j}^{o})=\pi_{j}. We can thus express the expected prediction for agent j𝑗j as E(pjo)=kS~jkπk𝐸superscriptsubscript𝑝𝑗𝑜subscript𝑘subscript~𝑆𝑗𝑘subscript𝜋𝑘E(p_{j}^{o})=\sum_{k}\tilde{S}_{jk}\pi_{k}. In future work, we will also consider more complicated cases, e.g. including non-faithful (selfish or malicious) behaviour. Substituting into Eq. (28), we get:
    Tij=max(0,min(1,η(1|πiπj|)+(1η)(1|πikS~jkπk|))).subscript𝑇𝑖𝑗01𝜂1subscript𝜋𝑖subscript𝜋𝑗1𝜂1subscript𝜋𝑖subscript𝑘subscript~𝑆𝑗𝑘subscript𝜋𝑘T_{ij}=\max(0,\min(1,\eta(1-|\pi_{i}-\pi_{j}|)\\ +(1-\eta)(1-|\pi_{i}-\sum_{k}\tilde{S}_{jk}\pi_{k}|))). (30)
    Since the profiles π𝜋\pi are given, T𝑇T is a function of S~~𝑆\tilde{S}. Notice that by combining Eqs. (14-15-7), we can express S~jksubscript~𝑆𝑗𝑘\tilde{S}_{jk} in terms of the components Tjksubscript𝑇𝑗𝑘T_{jk}, (T2)jksubscriptsuperscript𝑇2𝑗𝑘(T^{2})_{jk}, (T3)jk,subscriptsuperscript𝑇3𝑗𝑘(T^{3})_{jk},\ldots as well as Tjlsubscript𝑇𝑗𝑙T_{jl}, (T2)jlsubscriptsuperscript𝑇2𝑗𝑙(T^{2})_{jl}, (T3)jl,subscriptsuperscript𝑇3𝑗𝑙(T^{3})_{jl},\ldots where l𝑙l are the other neighbours of j𝑗j:
    S~jksubscript~𝑆𝑗𝑘\displaystyle\tilde{S}_{jk} =\displaystyle= Tjk+β(T2)jk+β2(T3)jk+lm=0(Tm)jl.subscript𝑇𝑗𝑘𝛽subscriptsuperscript𝑇2𝑗𝑘superscript𝛽2subscriptsuperscript𝑇3𝑗𝑘subscript𝑙subscriptsuperscript𝑚0subscriptsuperscript𝑇𝑚𝑗𝑙\displaystyle\frac{T_{jk}+\beta(T^{2})_{jk}+\beta^{2}(T^{3})_{jk}+\dots}{\sum_{l}\sum^{\infty}_{m=0}(T^{m})_{jl}}. (31)
    It follows that we can express the value of trust Tijsubscript𝑇𝑖𝑗T_{ij} between any pair of agents in terms of the value of trust among the other pairs. This leads to a self-consistent equation for T𝑇T, where the only parameters are the initial values of trust T(0)𝑇0T(0), the probability to signal, η𝜂\eta, the discount factor along the walks of the graphs, β𝛽\beta, and the profiles of the agents, π𝜋\pi:
    Tij=f(T,T(0),η,β,π)i,j.subscript𝑇𝑖𝑗𝑓𝑇𝑇0𝜂𝛽𝜋for-all𝑖𝑗\displaystyle T_{ij}=f(T,T(0),\eta,\beta,\pi)\ \forall i,j. (32)
    Notice that Eq. (32) is obtained without any assumption on the structure of the network that is reflected in T𝑇T.
  • [64] One is, of course, interested in the fixed points of Eq. (32), their stability and whether they are attained by the dynamics. On the one hand, it is trivial to check that the matrix T𝑇T with Tij=1subscript𝑇𝑖𝑗1T_{ij}=1 among agents with the same profile and Tij=0subscript𝑇𝑖𝑗0T_{ij}=0 among agents with opposite profile is a fixed point of Eq. (32). Denote this configuration as {T+=1,T=0}formulae-sequencesuperscript𝑇1superscript𝑇0\{T^{+}=1,T^{-}=0\}. On the other hand, the configuration with trust equal zero among all pairs {T+,=0}superscript𝑇0\{T^{+,-}=0\} is not a fixed point.
  • [65] In the next section, we find, by means of computer simulations, that the system, starting from a configuration with no trust among the agents, {T+,=0}superscript𝑇0\{T^{+,-}=0\}, always evolves to a configuration in which agents with similar profile trust each other {T+=1,T=0}formulae-sequencesuperscript𝑇1superscript𝑇0\{T^{+}=1,T^{-}=0\}. This is true even if agents do not signal all the time (i.e. η<1𝜂1\eta<1). A formal investigation of the stability of all the fixed points of Eq. (32) will be performed in future work.
  • [66]
  • [67]
  • 4.4 Simulations

  • [68] The simulations that we carried out were done on an agent population of 500500500 agents. We considered two opposite profiles with ratings on objects as +11+1 or 11-1. The agents are connected in a random graph [erdos59, bollobas85]. Initially, Tij=0i,jsubscript𝑇𝑖𝑗0for-all𝑖𝑗T_{ij}=0\quad\forall i,j, i.e. the agents have to learn who to trust. We varied the average degree d𝑑d of each agent, as well as the level of cooperation η𝜂\eta in the system. The following figures illustrate the system behaviour over 505050 steps; all results were averaged over 100100100 runs.
  • [69]
  • Refer to caption
    Figure 2: Trust between agents of the same profile over time, for a fixed average degree of agents but variable level of cooperation.
  • [70] Figure 2 illustrates the average trust between agents of the same profile over time: the average degree of agents is fixed, d=7𝑑7d=7, and the level of cooperation η𝜂\eta is variable, ranging from 0.010.010.01 to 0.250.250.25 in steps of 0.010.010.01. The average trust between agents of the same profile converges to 111 for almost all η𝜂\eta. For larger η𝜂\eta, this process takes place much faster than for smaller η𝜂\eta. Given a sufficient level of cooperation in the system, the agents develop trust to the agents that have the same profile. Furthermore (this is not shown in the figure), agents of opposite profiles do not develop trust between each other.
  • [71]
  • Refer to caption
    Refer to caption
    Figure 3: Trust between agents of the same profile as a function of level of cooperation and average degree of agents at t=5𝑡5t=5 (left), and t=10𝑡10t=10 (right).
  • [72] Figure 3 illustrates the trust between agents of the same profile as a function of the level of cooperation and the average degree of agents at t=5𝑡5t=5, and t=10𝑡10t=10. Initially, at t=0𝑡0t=0, agents still have to learn who to trust (and the whole figure would be blue, corresponding to zero trust between everyone). At t=5𝑡5t=5, trust is already developing; for larger average degrees of agents d𝑑d as well as for larger levels of cooperation η𝜂\eta, this happens faster. At t=10𝑡10t=10, trust between agents of the same profile has developed for an average degree of agents d>5𝑑5d>5 and a level of cooperation η>0.05𝜂0.05\eta>0.05.
  • [73] The obvious consequence of the evolution of trust is that predictions tend to match the profiles. We test this by measuring the performance of the system. Let the performance be defined as the sum of the products of the utility and the trust between all pairs of agents i𝑖i and j𝑗j:
    Φ=1nijuijTijkTik,Φ1𝑛subscript𝑖subscript𝑗subscript𝑢𝑖𝑗subscript𝑇𝑖𝑗subscript𝑘subscript𝑇𝑖𝑘\displaystyle\Phi=\frac{1}{n}\sum_{i}\sum_{j}u_{ij}\frac{T_{ij}}{\sum_{k}T_{ik}}, (33)
    where n𝑛n is the number of agents, e.g. in our case n=500𝑛500n=500. Agents are exposed to ratings which lead to both positive or negative utility. By building trust, they give more weight to the positive utility and less weight to the negative utility. Therefore, this measures “how well agents use their trust”.
  • [74]
  • Refer to caption
    Figure 4: Performance over time, for a variable average degree of agents, but a fixed level of cooperation.
  • [75] Figure 4 illustrates the performance over time: again, the average degree of agents is fixed, d=7𝑑7d=7, and the level of cooperation η𝜂\eta is variable, ranging from 0.010.010.01 to 0.250.250.25 in steps of 0.010.010.01. The performance converges to 111 for almost all d𝑑d. The similarity to Figure 2 is due to the fact that agents who have developed trust to other agents of the same profile are provided with good recommendations from their neighbours; thus, these agents perceive high utility which leads to high performance.
  • [76]
  • Refer to caption
    Refer to caption
    Figure 5: Performance as a function of level of cooperation and average degree of agents at t=1𝑡1t=1 (left) and at t=5𝑡5t=5 (right).
  • [77] Finally, Figure 5 illustrates the performance as a function of the level of cooperation and the average degree of agents at t=1𝑡1t=1 and at t=5𝑡5t=5. Again, just as the trust between agents of the same profile increases in Figure 3, the performance increases with increasing average degree of agents and level of cooperation. One might wonder how, at t=1𝑡1t=1, the performance can already be nonzero – this is due to the fact that there are only two opposite profiles; this implies that half of the neighbours of an agent are of the same profile and, as soon as an agent has developed some trust to one of these neighbours, it will benefit from their recommendations which, again, drives the performance up.
  • [78]
  • [79]
  • 4.5 Empirical Validation

  • [80] To support the analytical approximations of the model and the results of the computer simulations, we empirically tested the performance of a recommender system using our TrustWebRank (TW) metric against one using a standard Collaborative Filtering (CF) approach, similarly to what has been done in [massa07]. We crawled Epinions.com, an on-line platform which allows consumers to read and write reviews about products. The unique feature of Epinions is that users can also form a “web-of-trust” and specify other users that they trust with respect to their reviews. The crawling was performed in mid-2007 and led to a dataset of 60,918 users with 896,969 reviews on 223,687 products and with 518,505 relationships. We cleaned this dataset and removed users that either had not written any reviews or had no relationships to other users because no reasonable validation can be done with these users. Furthermore, we focus on the greatest strongly connected component (SCC) because a) there is only one large SCC and many small SCC (1-3 users) and b) membership in this SCC can be seen as a proxy for having a properly formed web of trust. Having applied this procedure, we are left with 29,478 users, 731,220 reviews on 201,674 products, and 471,888 relationships. The data sparsity is 99.9877 stars (max). There is a bias to review favourably, as 75 ratings are either 4 or 5 stars and only 25 or 3 stars – probably because users are more likely to spend time to write a review when they like a product.
  • [81] We split the reviews into a training set RTrainingsubscript𝑅TrainingR_{\mathrm{Training}} and a test set RTestsubscript𝑅TestR_{\mathrm{Test}}. We then compare the performance of TW and CF by training the algorithms on RTrainingsubscript𝑅TrainingR_{\mathrm{Training}} and testing with RTestsubscript𝑅TestR_{\mathrm{Test}}. TW, in general, has comparable performance to CF, and performs better in particular situations, as we will describe in the following. The complete empirical validation will, together with some statistical analyses of the Epinions community, be reported on in a separate paper [walter09-epinions].
  • [82] Mean Absolute Error: the mean absolute error (MAE) is defined as
  • [83]
    eMAE=1|RTest|RTest|riopio|.subscript𝑒MAE1subscript𝑅Testsubscriptsubscript𝑅Testsuperscriptsubscript𝑟𝑖𝑜superscriptsubscript𝑝𝑖𝑜\displaystyle e_{\mathrm{MAE}}=\frac{1}{|R_{\mathrm{Test}}|}\sum_{R_{\mathrm{Test}}}|r_{i}^{o}-p_{i}^{o}|. (34)
  • [84] Figure 6 shows the MAE of TW for changing β𝛽\beta and CF. Depending on the value of β𝛽\beta, TW performs (marginally) better than CF. There is an optimal βopt0.8subscript𝛽opt0.8\beta_{\mathrm{opt}}\approx 0.8.
  • [85]
  • Refer to caption
    Figure 6: Mean Absolute Error of TW (blue/circles) against β𝛽\beta and CF (red/squares). The MAE is normalised to a scale in [0,1]01[0,1], i.e. it reflects percentages.
  • [86] However, the fact that most ratings are 4 or 5 limits the meaning of the MAE as a measure of performance. Indeed, predictions based on the Simple Average (SA) of ratings on a product, a global algorithm which is not personalised for users, outperform both TW and CF: eMAE(SA)=0.21subscript𝑒MAE𝑆𝐴0.21e_{\mathrm{MAE}}(SA)=0.21. Similar results were found in [massa07] using a different dataset of Epinions (from 2003). An explanation for this is that reviews are very homogeneous and almost all ratings are positive. Other datasets, such as the commonly used MovieLens dataset, are more heterogeneous and SA performs worse than CF on such datasets. Unfortunately, at the moment, Epinions is the only available dataset which combines rating data and a social network – and which is thus suitable to test the performance of TW.
  • [87] Coverage: coverage measures the percentage of elements that can be predicted from the training set. Both TW and CF cannot compute predictions for all elements in the test set. For example, if there is no similar or trusted user who has rated a particular product, CF or TW are not able to compute a prediction for that product. CF was able to compute 41.65 75.11 with CF. The reason for this is that TW is able to reach a large neighbourhood even when the neighbourhood based on co-ratings, as in CF, is small.
  • [88] Top-N Set Overlap: as noted, the value of ratings in Epinions does not seem to carry a lot of meaning – probably because people tend to rely more on the text of reviews than on the rating. Therefore, it makes sense to compare the performance based on the ability to predict the subset of products rated by a user. We define the following measures of overlap between sets:
  • [89]
    oiN=|PiRN|min(|Pi|,N)andoX,iN=|PiRX,iN|min(|Pi|,N)formulae-sequencesuperscriptsubscript𝑜𝑖𝑁subscript𝑃𝑖superscript𝑅𝑁subscript𝑃𝑖𝑁andsuperscriptsubscript𝑜𝑋𝑖𝑁subscript𝑃𝑖superscriptsubscript𝑅𝑋𝑖𝑁subscript𝑃𝑖𝑁\displaystyle o_{i}^{N}=\frac{|P_{i}\cap R^{N}|}{\min(|P_{i}|,N)}\quad\mathrm{and}\quad o_{X,i}^{N}=\frac{|P_{i}\cap R_{X,i}^{N}|}{\min(|P_{i}|,N)} (35)
  • [90] where Pisubscript𝑃𝑖P_{i} is the set of products rated by a user i𝑖i; RNsuperscript𝑅𝑁R^{N} is the set of the N most rated products overall in the system; X𝑋X denotes either CF or TW and thus RCF,iNsuperscriptsubscript𝑅𝐶𝐹𝑖𝑁R_{CF,i}^{N} and RTW,iNsuperscriptsubscript𝑅𝑇𝑊𝑖𝑁R_{TW,i}^{N} are the sets of the N most rated products in the neighbourhood of a user i𝑖i constructed by CF and TW. Note that RNsuperscript𝑅𝑁R^{N} is a global set which is the same for all users i𝑖i. Thus, oiNsuperscriptsubscript𝑜𝑖𝑁o_{i}^{N} is the counterpart of eMAE(SA)subscript𝑒MAE𝑆𝐴e_{\mathrm{MAE}}(SA) in this context. RCF,iNsuperscriptsubscript𝑅𝐶𝐹𝑖𝑁R_{CF,i}^{N} and RTW,iNsuperscriptsubscript𝑅𝑇𝑊𝑖𝑁R_{TW,i}^{N} are personalised sets which depend on the neighbourhood of user i𝑖i and thus are different for any two users. We define the average overlap across all users as ONsuperscript𝑂𝑁O^{N}, OCFNsubscriptsuperscript𝑂𝑁𝐶𝐹O^{N}_{CF}, and OTWNsubscriptsuperscript𝑂𝑁𝑇𝑊O^{N}_{TW}. For N=100𝑁100N=100, we obtain ON0.0819superscript𝑂𝑁0.0819O^{N}\approx 0.0819, OCFN0.2526superscriptsubscript𝑂𝐶𝐹𝑁0.2526O_{CF}^{N}\approx 0.2526 and OTWN0.1724superscriptsubscript𝑂𝑇𝑊𝑁0.1724O_{TW}^{N}\approx 0.1724. Since a larger overlap signifies a better prediction, the larger the values, the better the performance. This implies that the global measure ONsuperscript𝑂𝑁O^{N} performs worse than both OCFNsuperscriptsubscript𝑂𝐶𝐹𝑁O_{CF}^{N} and OTWNsuperscriptsubscript𝑂𝑇𝑊𝑁O_{TW}^{N}. In addition, CF performs better than TW. However, it should be emphasised that this measure is obviously biased in favour of CF: by definition, PiRCF,iNsubscript𝑃𝑖subscriptsuperscript𝑅𝑁𝐶𝐹𝑖P_{i}\cap R^{N}_{CF,i}\neq\emptyset. In contrast, PiRTW,iNsubscript𝑃𝑖subscriptsuperscript𝑅𝑁𝑇𝑊𝑖P_{i}\cap R^{N}_{TW,i} can be empty, as a user does not necessarily declare trust to people who are have rated the same items. Still, TW performs significantly better than the global measure ONsuperscript𝑂𝑁O^{N}.
  • [91] This illustrates the difficulty to compare the performance of TW with CF. In fact, the most appropriate way to measure performance would be based on user-provided feedback subsequent to having followed a recommendation.
  • [92] In conclusion, we found that TW and CF have comparable performance. TW seems mostly useful for recommendations of items different from those a user has already rated – e.g. recommendations on travel books for people usually interested in tools for gardening.
  • [93]
  • [94]
  • 5 Extensions and Conclusion

  • [95] We introduced a novel metric for computing indirect trust in social networks. We derived this metric from feedback centrality measures in graphs and illustrated how it addresses some limitations of other trust metrics; most importantly, that it takes cycles in the underlying graph into account. We constructed a simple model of a recommender system that makes use of our metric and showed how indirect trust can be used to generate recommendations. We performed analytical approximations and computer simulations to characterise the system behaviour. Finally, we also tested the model by validating it with empirical data of an Internet community devoted to product reviews.
  • [96] Some extensions to this model could involve changing the trust dynamics:
  • [97] Trust update as a slow-positive, fast-negative dynamics. It has been observed in the literature that trust follows a slow-positive, fast-negative dynamics [abdul-rahman00, grandison00, marsh94, sabater05, walter08-jaamas]. This means that trust builds up slowly, but gets torn down quickly and this behaviour could be implemented by modifying Eq. (26).
  • [98] Coupling the utility with the level of cooperation η𝜂\eta. In real applications, if, initially, the utility for users is zero, then nobody will signal and this is a fixed point – and a social dilemma [hardin68]. Thus, we could couple the probability of signalling to the utility and investigate how to make the system escape from this undesirable fixed point.
  • [99] With this work, we have shown that incorporating this novel trust metric in recommender systems is a promising and viable approach.
  • [100]
  • [101]