Modulation-free pump-probe spectroscopy of strontium atoms
Abstract
We have performed polarization spectroscopy and sub-Doppler DAVLL on the transition of atomic strontium. Both techniques generated a dispersion-type lineshape suitable for laser stabilization, without the need for frequency modulation. In both cases the signal is generated primarily by saturation effects, rather than optical pumping. The dependence of the amplitude and gradient on intensity and magnetic field were also investigated.
pacs:
32.30.Jc, 42.62.Fi1 Introduction
The stabilization, or “locking”, of a laser frequency to an atomic transition is an essential technique for experiments in laser cooling and precision metrology. The starting point for laser locking is a spectroscopic technique which produces a lineshape with a zero crossing at the atomic resonance, providing an “error signal” that can be used to correct for frequency deviations. Suitable lineshapes with sub-Doppler spectroscopic resolution can be produced by using frequency modulated laser light, as in FM spectroscopy [1] or modulation transfer spectroscopy [2, 3]. However it is not always straightforward, or desirable, to use frequency modulated light. If the modulation is generated by modulating the injection current of a diode laser, then it is present on all the laser beams used in the experiments, which can cause problems for some experiments. For other laser sources, or where residual frequency modulation cannot be tolerated, a costly external modulator must be used. To get around this, spectroscopic techniques that generate a suitable lineshape directly, without the need for frequency modulation, have been developed.
In this paper we apply two of these techniques, polarization spectroscopy [4, 5] and sub-Doppler DAVLL (Dichroic Atomic Vapour Laser Locking) [6], to the alkaline earth metal strontium. There is increasing interest in the spectroscopy and laser cooling of alkaline-earth elements such as strontium, motivated by applications in precision frequency metrology [7] and ultra-cold Rydberg and plasma physics [8]. We perform spectroscopy on the cooling transition at 461 nm, where frequency-doubled laser sources must be used and FM methods are difficult to implement. In previous work with strontium, polarization spectroscopy was used to observe the narrow intercombination line at 689 nm [9]. Both techniques have been extensively characterized for the alkali metals Rb and Cs [10, 11, 12]. We find that the electronic structure of strontium leads to important differences. Notably, for the bosonic isotopes, the state has no degeneracy. The polarization spectroscopy signal is due only to the anisotropic saturation of the transition by the pump beam. This is in contrast to the alkali metals, where optical pumping is the dominant mechanism for generating the circular birefringence. We show that this technique produces a dispersion profile suitable for laser locking, and compare this with the signal produced by the sub-Doppler DAVLL technique. The stability of the zero crossing is evaluated by comparison with saturated absorption spectroscopy.
2 Polarization spectroscopy
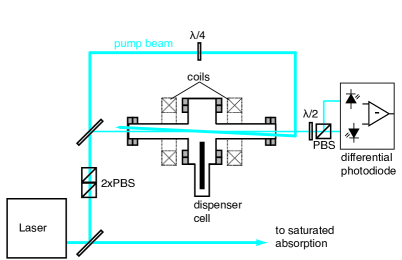
In polarization spectroscopy a circularly polarized pump beam induces a birefringence in the medium, which is interrogated using a counterpropagating, linearly polarized probe beam at the same frequency. The experimental arrangement is shown in figure 1. The output signal is the intensity difference between the two outputs of the polarizing beamsplitter cube. The probe beam is initially linearly polarized at to the axes of the cube such that the difference signal is zero in the absence of the pump beam. In the presence of the pump beam, the birefringence induced in the medium causes the probe beam polarization to be rotated through a small angle , giving rise to a non-zero output signal. Expressions for the polarization spectroscopy signal in this configuration were obtained in [10]. Neglecting the birefringence of the cell windows 111Birefringence in the windows leads to a small additional rotation that can be compensated by adjusting slightly away from . Variations can cause a slow drift of the laser lock point., the polarization spectroscopy signal after passing through a length of the medium is
| (1) |
with the rotation angle given by
| (2) |
where is the on-resonance difference in absorption coefficient between the left- and right-hand circularly polarized components of the probe beam, and is the detuning in units of half the power-broadened linewidth 222The natural linewidth of the transition is MHz..
The important parameter that sets the size of the polarization spectroscopy signal is the difference in line centre absorption induced by the pump beam. In the alkali metals, this difference in absorption arises from two distinct mechanisms: saturation and optical pumping. At high intensity () , the circularly polarized pump beam saturates the (or ) transition, leading to reduced absorption of the corresponding component of the probe beam. At low intensity () , optical pumping can redistribute the ground state population among the magnetic sublevels, which then do not couple equally to the two circularly polarized components of the probe. With increasing intensity, the dispersion signal can actually change sign as the saturation mechanism dominates over optical pumping [10, 11]. In the alkaline earths, the situation is different. The even isotopes have no nuclear spin, and the transition is a simple transition. In this case the polarization spectroscopy signal arises uniquely from saturation as there is no optical pumping. For the odd isotopes, hyperfine structure and magnetic sublevels play a role, and optical pumping can take place.
Our experiment was set up as shown in figure 1. The 461 nm laser light was produced by a commercial frequency doubled diode laser system (Toptica-SHG). A novel dispenser-based vapour cell [13] was used for the measurements. A broad, weakly collimated jet of strontium atoms is produced by electrically heating a commercial vapour source. The pump and probe beams had radii of mm and mm in the horizontal and vertical directions respectively and were overlapped inside the cell with a small crossing angle ( mrad). The probe beam power was fixed at 41 . An amplified differential photodiode was used to detect the light in the output arms of the PBS. A pair of coils placed symmetrically around the cell allowed a magnetic field to be applied along the direction of the laser beams. We also performed simultaneous saturated absorption spectroscopy using a second dispenser cell. The frequency axis of the laser scan was calibrated by fitting these saturated absorption spectra and using the known natural abundances, isotope shifts and hyperfine splittings [14].
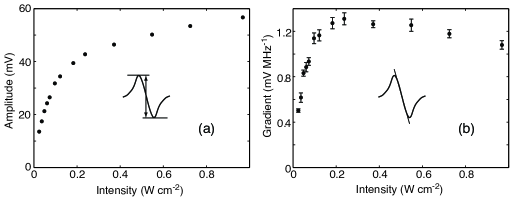
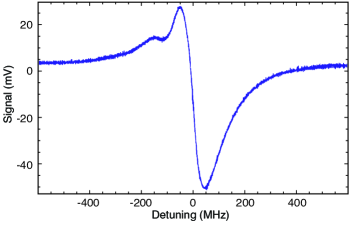
An example of the polarization spectroscopy signal that we obtained is shown in figure 2. A sharp dispersion shaped feature associated with the dominant (83 abundant) isotope is clearly visible. This strong feature is ideal for laser locking. On the negative detuning side, contributions from the other isotopes are also visible. The peak signal is also lower on this side of resonance. The shape of the signal here is very dependent on the pump and probe polarization, and is probably due to optical hyperfine pumping effects in the 87Sr isotope. The zero-crossing is displaced from the centre of the 88Sr resonance by approximately 10 MHz. This offset is important for laser locking, and it can be varied (and brought to zero) by making slight adjustments to the angle of the plate. We have investigated the stability of this offset, and we find that the RMS variation of the offset during a hour period is 0.8 MHz. The variation of the amplitude and gradient of the polarization spectroscopy signal is shown in figure 3. At high pump intensity (), the amplitude saturates as expected, while the gradient reaches a maximum before decreasing again as power broadening becomes important.
To make a quantitative model of the polarization spectroscopy signal we must take into account the spatial profile of the beam and the time-dependence of the anisotropy. For rubidium vapour in thermal equilibrium, the time-dependent anisotropy has recently been calculated analytically and numerically [15]. In our experiment, the velocity distribution of atoms in the jet from the dispenser source is not well characterized, and so a quantitative simulation is beyond the scope of this work. However, we can use (1) to estimate the rotation angle. From the peak signal at positive detuning, we estimate the maximum rotation angle to be mrad.
3 Sub-Doppler DAVLL
In order to obtain sub-Doppler DAVLL signals, the half-wave plate before the analyzer cube is replaced with a quarter-wave plate. The axes of this waveplate are adjusted to be at with respect to the initial linear polarization. In this configuration, the two circular components of the linearly polarized probe beam exit from different ports of the analyzer cube. Therefore the difference in intensity between the two outputs corresponds to the difference in absorption on the and transitions (circular dichroism). A magnetic field applied along the axis of the probe beam lifts the degeneracy between the sublevels of the excited state, Zeeman shifting the centres of the and transitions equally but in opposite directions. Hence above or below the zero-field resonance one circular component is absorbed more than the other, while exactly on resonance the difference signal is zero. Conventional DAVLL [16, 17] uses a probe beam only, and it is the Doppler-broadened absorption line that must be Zeeman split by the magnetic field. In sub-Doppler DAVLL, a linearly polarized pump beam is added (by removing the quarter-wave plate in figure 1), and sharp dispersion features are obtained at much lower magnetic fields by splitting the sub-Doppler spectral lines. In strontium, these sub-Doppler features originate solely from saturation, whereas in the alkali metals hyperfine pumping is the dominant mechanism [18].
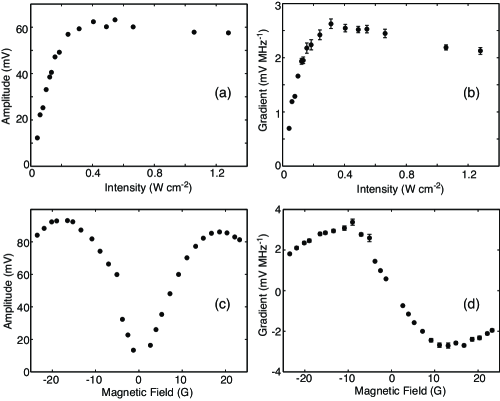
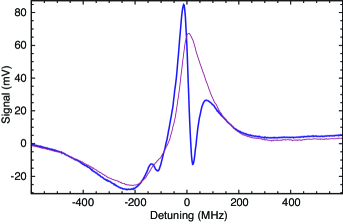
An example of the sub-Doppler DAVLL signal that we obtained is shown in figure 4. Again, a sharp sub-Doppler feature with a zero-crossing close to the atomic resonance frequency is obtained. However, this steep sub-Doppler feature is superimposed on a background Doppler-broadened DAVLL signal, in contrast to the polarization spectroscopy where the Doppler-broadened background absorption is cancelled completely in the difference signal. The variation of the amplitude and gradient with magnetic field and pump beam intensity is shown in figure 5. The amplitude and gradient are comparable to that obtained from polarization spectroscopy with the same pump and probe power (figure 3), and follow the same trends. Both the amplitude and gradient depend strongly on the size of the applied magnetic field, increasing to a maximum as the field is increased before decreasing again at very high fields. The optimum gradient should occur when the differential Zeeman shift between the and transitions is equal to the power-broadened linewidth. Here, the maximum gradient is reached at approximately 12 G, which corresponds to a differential Zeeman shift of 34 MHz, indicating a small power-broadening of the line at this pump beam intensity. The maximum amplitude occurs at slightly higher magnetic field than the maximum gradient. We have also characterized the variation in the offset between the zero-crossing of the sub-Doppler DAVLL signal and the atomic line centre. This offset depends slightly on the applied magnetic field, varying between 10 and 30 MHz. At a fixed magnetic field, the offset is slightly less stable than for polarization spectroscopy, varying by less than 3 MHz over a similar 1 hour period.
4 Discussion and Conclusions
We have applied polarization spectroscopy and sub-Doppler DAVLL to the transition in atomic strontium. Both techniques generate dispersion-shaped lines with sub-Doppler resolution that are suitable for laser locking. With this application in mind, it is instructive to compare the two techniques. For a given laser power, the two techniques produce signals with a similar amplitude and gradient. However, the sub-Doppler DAVLL signal is superimposed on a large Doppler-broadened background, whereas the polarization spectroscopy signal has no Doppler-broadened component. This flat background may contribute to the greater stability in the zero-crossing position that we observed for polarization spectroscopy. Polarization spectroscopy also has the slight advantage that no magnetic field is required. A significant advantage of both techniques is that unlike FM spectroscopy or modulation transfer spectroscopy, neither requires modulation of the laser frequency. In our laboratory we find that polarization spectroscopy provides a robust and reliable lock for our laser, that is sufficiently stable for us to routinely produce laser cooled strontium atoms.
References
- [1] G. C. Bjorklund. Frequency-modulation spectroscopy: a new method for measuring weak absorptions and dispersions. Optics Letters, 5:15, 1980.
- [2] J. H. Shirley. Modulation transfer processes in optical heterodyne saturation spectroscopy. Optics Letters, 7:537, 1982.
- [3] D. J. McCarron, S. A. King, and S. L. Cornish. Modulation transfer spectroscopy in atomic rubidium. Meas. Sci. Technol., 19:105601, 2008.
- [4] C. Wieman and T. W. Hänsch. Doppler-free laser polarization spectroscopy. Phys. Rev. Lett., 36:1170, 1976.
- [5] W. Demtroder. Laser Spectroscopy: Basic Concepts and Instrumentation, pages 454–465. Springer-Verlag, second edition, 1996.
- [6] G. Wasik, W. Gawlik, J. Zachorowski, and W. Zawadzki. Laser frequency stabilization by Doppler-free magnetic dichroism. Appl. Phys. B, 75:613, 2002.
- [7] S. Blatt, A. D. Ludlow, G. K. Campbell, J. W. Thomsen, T. Zelevinsky M. M. Boyd, J. Ye, X. Baillard, M. Fouché, R. Le Targat, Brusch, P. Lemonde, M. Takamoto, F. L. Hong, H. Katori, and V. C. Flambaum. New limits on coupling of fundamental constants to gravity using 87Sr optical lattice clocks. Phys. Rev. Lett., 100:140801, 2008.
- [8] C. E. Simien, Y. C. Chen, P. Gupta, S. Laha, Y. N. Martinez, P. G. Mickelson, D. B. Nagel, and T. C. Killian. Using absorption imaging to study ion dynamics in an ultracold neutral plasma. Phys. Rev. Lett., 92:143001, 2004.
- [9] G. M. Tino, M. Barsanti, M. de Angelis, L. Gianfrani, and M. Inguscio. Spectroscopy of the 689nm intercombination line of strontium using an extended-cavity InGaP/InGaAlP diode laser. Appl. Phys. B, 55:397, 1992.
- [10] C. P. Pearman, C. S. Adams, S. G. Cox, P. F. Griffin, D. A. Smith, and I. G. Hughes. Polarization spectroscopy of a closed atomic transition: applications to laser frequency locking. J. Phys. B, 35:5141, 2002.
- [11] M. L. Harris, C. S. Adams, S. L. Cornish, I. C . McLeod, E. Tarleton, and I. G. Hughes. Polarization spectroscopy in rubidium and cesium. Phys. Rev. A, 73:062509, 2006.
- [12] M. L. Harris, S. L. Cornish, A. Tripathi, and I. G. Hughes. Optimization of sub-Doppler DAVLL on the rubidium D2 line. Phys. Rev. A, 73:062509, 2006.
- [13] E. M. Bridge, J. Millen, C. S. Adams, and M. P. A Jones. A vapor cell based on dispensers for laser spectroscopy. Rev. Sci. Instr., 80:013101, 2009.
- [14] S. Mauger, J. Millen, and M. P. A Jones. Spectroscopy of strontium Rydberg states using electromagnetically induced transparency. J. Phys B, 40:F319, 2007.
- [15] H. Do, G. Moon, and H.-R. Noh. Polarization spectroscopy of rubidium atoms: Theory and experiment. Phys. Rev. A, 77:032513, 2008.
- [16] B. Chéron, H. Gilles, J. Hamel, O. Moreau, and H. Sorel. Laser frequency stabilization using Zeeman effect. J. Phys. III, 4:401, 1994.
- [17] K. L. Corwin, Z.-T Lu, C. F. Hand, R. J. Epstein, and C. E. Wieman. Frequency-stabilized diode laser with the Zeeman shift in an atomic vapor. Appl. Opt., 37:3295, 1998.
- [18] D. A. Smith and I. G. Hughes. The role of hyperfine pumping in multilevel systems exhibiting saturated absorption. Am J. Phys., 72:631, 2004.