Stellar and Circumstellar Properties of Class I Protostars
Abstract
We present a study of the stellar and circumstellar properties of Class I sources using low-resolution (R1000) near-infrared - and -band spectroscopy. We measure prominent spectral lines and features in 8 objects and use fits to standard star spectra to determine spectral types, visual extinctions, -band excesses, and water ice optical depths. Four of the seven systems studied are close binary pairs; only one of these systems, Haro 6-10, was angularly resolvable. For certain stars some properties found in our analysis differ substantially from published values; we analyze the origin of these differences. We determine extinction to each source using three different methods and compare and discuss the resulting values. One hypothesis that we were testing, that extinction dominates over the -band excess in obscuration of the stellar photospheric absorption lines, appears not to be true. Accretion luminosities and mass accretion rates calculated for our targets are highly uncertain, in part the result of our inexact knowledge of extinction. For the six targets we were able to place on an H-R diagram, our age estimates, 2 Myr, are somewhat younger than those from comparable studies. Our results underscore the value of low-resolution spectroscopy in the study of protostars and their environments; however, the optimal approach to the study of Class I sources likely involves a combination of high- and low-resolution near-infrared, mid-infrared, and millimeter wavelength observations. Accurate and precise measurements of extinction in Class I protostars will be key to improving our understanding of these objects.
1 Introduction
Class I sources represent one of the earliest stages of star formation and are identified by a rising spectral energy distribution (SED) at wavelengths longer than 2 m (Lada 1987). These sources are deeply embedded within molecular clouds and are very faint or undetectable at visible wavelengths because of a thick envelope of circumstellar dust. This material effectively envelops the whole star and as a result, the light from these young stellar objects (YSOs) is absorbed and re-radiated in the infrared (IR). Therefore, most studies of Class I objects employ observations in the near-IR or longer wavelength regimes where these sources are relatively bright (e.g., Greene & Lada, 1996, 2002; Doppmann et al., 2005; Beck, 2007).
Following the suggestion of Lada (1987), it has been commonly thought that Class I objects inhabit an earlier evolutionary stage relative to Class II sources (classical T Tauri stars, or CTTSs). However, showing that the central YSOs in Class I sources display signatures indicative of an earlier evolutionary phase compared to CTTSs has not been straightforward. Kenyon et al. (1998) conducted a visible light, low spectral resolution survey of Class I YSOs in the Taurus star forming region (SFR). They identified preliminary spectral types and luminosities and determined that for Class I sources these properties were similar to those of the Class II objects in Taurus. However, these investigators did find a greater frequency and intensity of outflows as deduced from forbidden line emission in the Class I objects. White & Hillenbrand (2004) used high spectral resolution data in the visible to measure the stellar properties of several dozen Class I objects and reached similar conclusions, although they argue that the larger equivalent width values observed in forbidden emission lines from Class I sources might be attributable to the effect of circumstellar disk orientation causing obscuration of the central continuum source (White et al., 2007) rather than to a higher incidence of strong jets. White & Hillenbrand (2004) also found that the veiling and derived accretion rates were similar for Class I and Class II sources; however, using high-resolution IR spectra, Doppmann et al. (2005) found that the veiling and associated accretion rates of Class I and flat-spectrum YSOs are higher than those of the Class II objects. As a result of these discrepancies, it is unclear how much of the final mass of a YSO is accreted during the Class I phase. Episodic events have been proposed to account for significant growth over short periods (e.g., Kenyon et al., 1998); however, White et al. (2007) argue that the process by which protostars acquire the majority of their mass is still unconfirmed.
From an evolutionary point of view, another property that is expected to differ between the two classes of YSOs is their rotation rates, but again unambiguous observational evidence for this is lacking. White & Hillenbrand (2004) determined that their sample of Class I objects in Taurus is rotating at sin35 km s-1 on average, which makes them generally indistinguishable from Class II sources in this SFR. However, Covey et al. (2005) found that Class I and flat-spectrum objects (apparently transitioning from Class I to Class II; Greene & Lada, 1997) in the Taurus and Ophiuchus SFRs do rotate more quickly than Class II objects in the same regions. To account for rotational slowing between the Class I and Class II phases, Montmerle et al. (2000) invoked the onset of magnetic disk braking (e.g., Koenigl, 1991; Shu et al., 1994) over the protostellar lifetime. In the framework of this paradigm, once disk locking has fully engaged, the star has evolved to the Class II stage and its rotation has slowed accordingly. Alternatively, Matt & Pudritz (2005) proposed accretion driven winds to account for angular momentum changes in young stars.
It seems unlikely that all Class I objects could be Class II systems with irregular appearances attributable to geometric effects. Some Class I sources no doubt are simply CTTSs seen through edge on disks, but the rest may well be part of an overall evolutionary sequence from Class 0/I to Class I/II YSOs. Untangling the evolutionary state and geometric effects influencing these classifications is, however, apparently quite complex.
Following the early, low-resolution (600) near-IR spectroscopy studies of Greene & Lada (1996, 1997) on Class I sources there has been a shift to primarily high spectral resolution (R18,000) studies of protostars (e.g., Greene & Lada, 2000, 2002; White & Hillenbrand, 2004; Doppmann et al., 2005; Covey et al., 2005, 2006) as the requisite instrumentation has become available on large telescopes. High-resolution spectra permit the measurement of sin, magnetic fields, and other detailed properties. Although this work has proved valuable, the wide wavelength coverage available with low dispersion spectrographs provides unique leverage in the study of these very embedded young stars, allowing for the simultaneous determination of the extinction and the examination and characterization of many spectral features. For objects in common with high dispersion studies, the results we obtain here, based on low-resolution IR data, are not always the same, suggesting that the two approaches are complementary.
While a number of continuum and line emission processes likely play a role in shaping the emergent spectra of Class I objects, we undertook the current study to test the hypothesis that extinction is the dominant factor, as indicated by analysis of the protostar YLW 15A (Prato et al., 2003). In this current paper, we determine the properties of a small sample of 8 Class I YSOs using a number of techniques such as measuring the equivalent width of key spectral absorption and emission line features, placing sources in a color-color diagram using photometric data obtained from the literature, and fitting our observed spectra to standard star spectra to determine effective temperature (Teff), extinction, and -band excess. Our goal is to understand better the properties of protostars and the characteristics of their surrounding environments using photometry in combination with low-resolution spectroscopy of atomic and molecular lines, as well as of solid state features such as water ice absorption at 3.1 m (Beck, 2007). We examine several approaches to measuring extinction in our targets and compare these with each other and with estimates found in the literature. In this study we find a wide range in the strength and shape of protostar spectral features, both emission and absorption lines, from source to source, even in our relatively small sample of 8 objects. The principal unifying feature to the entire set is a rising spectrum across the -band. The observations and data reduction procedures are described in §2. In §3 we present the analysis of the data. A discussion appears in §4 and the results are summarized in §5.
2 Observations and Data Reduction
Our sample consists of 8 Class I YSOs in the Taurus star-forming region, two of which comprise a relatively wide binary, Haro 6-10. Three of the YSOs were unresolved binaries, IRAS 042392456, L1551 IRS 5, and IRAS 043612547. The objects are listed in Table 1, along with coordinates and observing dates. The coordinates reported here were determined using the Two Micron All Sky Survey (2MASS) interactive image service. Initially, using coordinates in SIMBAD, 2MASS images were found to show a displacement of sometimes 10′′ or more between the coordinate center and the stellar image. By iterating the coordinates until these matched, we determined the best values for our sample targets. Haro 6-10 is unresolved in 2MASS images. The sample was drawn from the study of Greene & Lada (1996) and selected on the basis of steeply rising -band spectra; Greene & Lada identified 7 of the 8 systems as Class Is and IRAS 044893042 as a flat spectrum source. In addition, 13 spectral type standard stars were observed and are listed in Table 2 along with their spectral types, -band magnitudes, and dates of observation. These standards were selected to cover a wide range of low-mass spectral types for use in the model fitting described below.
The data were obtained at the NASA Infrared Telescope Facility on Mauna Kea in 2000 November 1820 (UT), using SpeX, the facility low-resolution near-IR spectrograph (Rayner et al., 2003). A 10241024 InSb array was used to record the spectra. Simultaneous observations of the - and -bands (2.04.2 m) were acquired by means of a prism cross-disperser. A slit width of 08 was used for all observations, yielding a spectral resolution of R = 1000. The seeing ranged from 05 to 09. The data were acquired in pairs, nodded along the slit between frames. Exposure times varied between 0.51 s and 30 s, and multiple exposures were taken in each nod position. Stars of spectral type A0 were also observed for removal of telluric features. Exposures of an argon lamp were taken for wavelength calibration. Flat field and dark exposures were also acquired.
Data were reduced using the REDSPEC code111See http://www2.keck.hawaii.edu/inst/nirspec/redspec. Normalized flat fields were created by taking the median of the set of three flat field exposures taken for each star. The effects of subtracting median dark frames from the flat were insignificant so this differencing was not performed. Target exposures were medianed to create a single image of the spectrum of each star at each nod position. For each object these medianed nod pairs were differenced and divided by the corresponding flat. The images were spatially rectified using fourth-order fits to bright A0 star traces in each order. When the REDSPEC code could not fit the traces automatically, as occurred in an -band order where there was significant atmospheric contamination, manual fits to the traces were performed. Wavelength calibration was accomplished by fitting a second-order polynomial to the positions of identified lines in the argon lamp line spectrum. Several rows containing the stellar spectral data in the rectified, differenced image, one positive trace and one negative trace, were then summed. By subtracting the resulting negative spectrum from the positive, we accomplished a double-difference procedure that eliminated OH night sky emission line residuals. A0 calibrator star spectra, observed at similar airmasses as the standard and target stars, were used for the removal of telluric absorption lines. Intrinsic atomic hydrogen lines were interpolated over in the calibrator star spectrum, which was then divided into the standard and target star spectra. The ratio was multiplied by a featureless 9500 K blackbody curve to restore the original shape of the continuum of the standard or target star. After reduction, cosmetic improvements (such as interpolation over bad pixels) were made to the spectra. The reduced -band spectra of the standard stars appear in Figures 1 and 2. The reduced - and -band spectra of the Class I objects appear in Figures 3 and 4.
Four of our target systems are binaries; however, only Haro 6-10 was angularly resolvable. When extracting the Haro 6-10 S and N spectra, the number of extracted rows was chosen so as to avoid contamination by the companion star. The spectra of IRAS 042392436, L1551 IRS 5, and IRAS 043612547 are composed of the blended light of their primary and secondary components.
3 Analysis
3.1 Target Colors and Corresponding Extinction
Near-IR magnitudes for the Class I sample (Table 3) were obtained from the 2MASS point source catalogue (Skrutskie et al., 2006) and used to construct a JH versus HK color-color diagram (Figure 5). Haro 6-10 N lacks a -band measurement and hence is not shown. The location of Haro 6-10 S on the diagram implies strong contamination from circumstellar scattered light. All other targets show evidence for a large near-IR excess and most are highly extinguished.
To measure the extinction from the color-color diagram, we used the relation , derived in Prato et al. (2003). This dereddens the targets to the classical T Tauri locus, i.e. the intrinsic colors of a young star plus circumstellar disk system (Meyer et al., 1997), although it does not take into account the effects of disk geometry (e.g., flaring), disk inclination, or the accretion rate of disk material onto the star(s). Also, the classical T Tauri locus was determined for K and M stars only and thus is only strictly applicable to these spectral types. This process assumes that the envelope surrounding the Class I system contributes only reddening and that the intrinsic colors of the stardisk system are those of a classical T Tauri star. The extinction results appear in the last column of Table 3 and do not include Haro 6-10 N because of the missing J band data.
3.2 Equivalent Widths and Surface Gravity
Equivalent widths for spectral features in the -band were measured for the standard stars and for the Class I YSOs and are given in Tables 4 and 5, respectively. The equivalent width of the Br emission line for the Class I sources is also given in Table 5. Equivalent width uncertainties were determined by varying the location at which the relative continuum was measured. For the -band, this yielded uncertainties of 0.5 Å and for the -band, 2 Å. When no value is given in Tables 4 or 5, the equivalent width is less than the uncertainty or the line is not detected at all.
Only two targets in our sample, L1551 IRS 5 and IRAS 044893042, showed NaI, CaI, and CO (20) all in absorption. We compared the locations of these two stars with the dwarf (from our data) and giant (from Wallace & Hinkle, 1997) star NaICaI versus CO (20) equivalent width loci (similar to the loci data in Prato et al. 2003) and find that the Class I sources are consistent with giant star surface gravities. We conclude that, for Class I protostars, at least in some cases, low surface gravity standards would be preferable as spectroscopic templates.
3.3 Spectral Types, -band Excess, and Extinction Revisited
To determine the underlying spectral type, -band excess, , and extinction down to the protostellar photosphere, we compared the -band YSO spectra to a suite of dwarf, subgiant, and giant spectral type standards (Figures 1 and 2). We initially followed the same procedure described in Prato et al. (2003) which we briefly review. For a range of trial and values, the Class I target spectra are dereddened using the reddening law of Rieke and Lebofsky (1985) and the veiling continuum is removed. This modified spectrum is then fit to spectral type standard templates by determining the multiplicative scale factor that minimizes . The combination that gives the lowest overall value of then gives us an estimate of , , and the spectral type approptiate for each Class I source. This procedure provided initial estimates of these key properties; however, additional experimentation with wavelength dependent veiling and visual examination of the resulting fits was used to arrive at the final values shown in Table 6. Crude uncertainties on the order of 515% were estimated from visual inspection of the YSO fits to the comparison standard stars. Some comments on the fitting process for each target follow.
3.3.1 IRAS 040162610
White & Hillenbrand (2004) and Doppmann et al. (2005) identify a K star spectral type and Doppmann et al. (2005) find a large -band excess for this protostar. Given the similar depths of the CaI, MgI, and first CO bandhead evident in the spectrum of IRAS 040162610, an early K spectral type appears to provide the best match. The -band excess has a positive slope of 0.5 and a y-intercept of 0.1. Unfortunately, the subtraction of such a large -band excess from the observed spectrum results in a noisier spectrum that the original; higher signal to noise data would improve the accuracy of the fit. Experimenting with multiple spectral type standard spectra, a range of extinctions from 4353 mag, and veiling at 2.2 m of 0.51.5, we conclude that IRAS 040162610 is best fit with a K3 spectral type, mag, and . This spectral type and excess are consistent with the results of Doppmann et al. (2005) using high-resolution (R18,000) -band spectra.
3.3.2 IRAS 041812654A
The data of Beck (2007) taken of this source 3 years after our spectra, and at higher signal to noise, show better-defined stellar absorption features. However, both the shape of the continuum and the depth of absorption lines, shown in Figure 3, provide important limits from which to determine the best fit. The presence of water vapor in the atmospheres of M type objects produces a break in the slope of the spectrum at about 2.3 m (Wilking et al., 1999). Thus, objects with such a break (Figures 1 and 3) are unambiguously of later spectral type. In lieu of clearly detectable stellar absorption lines, we estimated an upper bound for the extinction by assuming a zero -band excess and fitting the slope of the continuum to an M star. The continuum spectrum of IRAS 041812654A is consistent with an early M star and an upper limit of 34 mag. Beck (2007) found an of 18 mag and an M3 spectral type.
3.3.3 IRAS 042392436
All spectral features, including Na I and CO, observed in the band for this target are in emission. No break in the continuum is detected, thus a spectral type later than K7 (Figure 1) is unlikely. Using a K0 V standard and setting the -band excess to zero we estimate an upper limit for the visual extinction of 45 mag.
3.3.4 Haro 6-10 S
We found a constant -band excess of 0.5 for Haro 6-10 S and an extinction of 30 mag. No break in the continuum was observed, implying a spectral type earlier than M0. Small absorption lines of NaI, CaI, and MgI are clearly visible; however, the CO is probably in emission, filling in what would otherwise be fairly deep absorption features (see Doppmann et al., 2008). We assign Haro 6-10 S an early K spectral type and use a K3 type to estimate an approximate temperature, although this is highly uncertain.
3.3.5 Haro 6-10 N
Setting the -band excess to zero we estimated an upper limit for the extinction and the spectral type of the emission line object Haro 6-10 N. We find an upper limit of 59 mag for the extinction and a spectral type consistent with an early K or G type star.
3.3.6 L1551 IRS 5
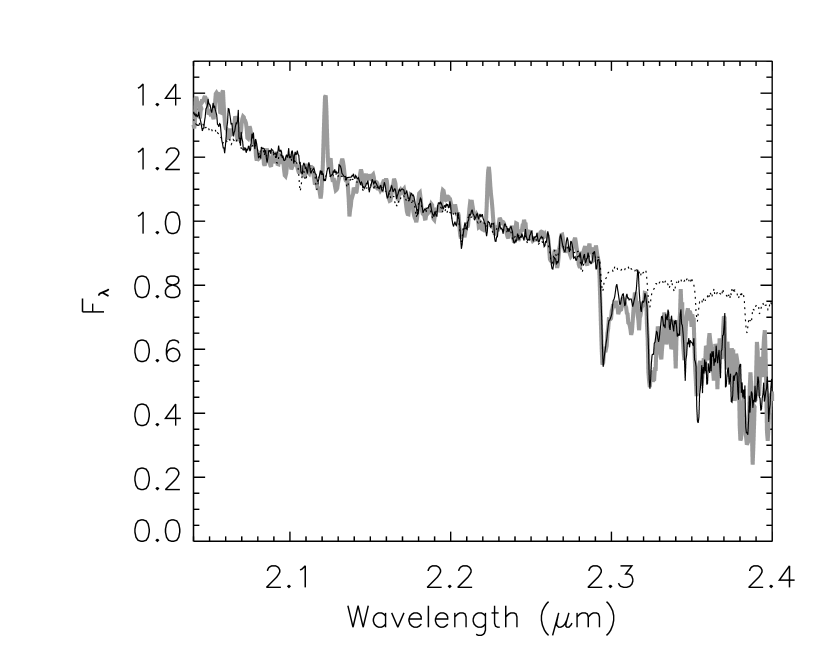
Figure 6 shows our fit of L1551 IRS 5 to an M3 giant standard after acccounting for an extinction of 28 magnitudes and a constant excess of 1.0 across the -band.
3.3.7 IRAS 043612547
With a -band excess of zero we find an upper limit of 30 magnitudes for the extinction to IRAS 043612547; the curvature in the spectral continuum implies a spectral type later than M3.
3.3.8 IRAS 044893042
A hybrid standard star spectrum obtained by averaging the M3III and M4V spectral type standards provided the best fit to this source after accounting for a constant -band excess of 1.4 and 18 magnitudes of extinction. The deep CO bandheads and characteristic M star break at 2.28 m support this conclusion. We find a negative slope of 0.5 for the excess across the band and a y-intercept of 2.5.
3.4 Ice Band Absorption and a Third Extinction Estimate
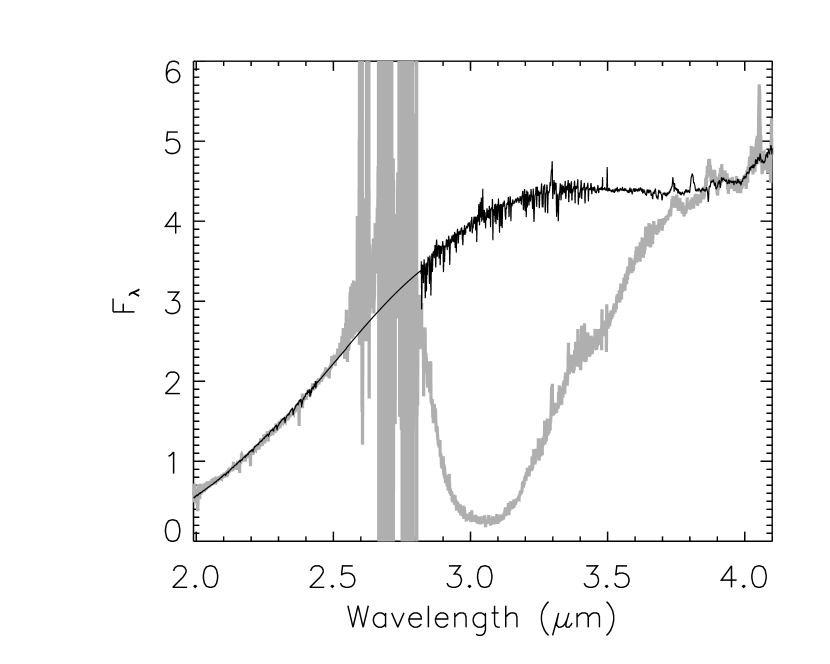
The most obvious feature in the -band spectra of Class I YSOs is the wide, deep, water ice absorption at 3.1 m (Figure 4). This feature appears in all 8 of the target sources to varying degrees. In order to use the 3 m ice feature to estimate the optical depth through the envelope, it is necessary to isolate the ice absorption profile from the overall shape of the spectral energy distribution (SED) in the 2 – 4 m range. To do this, we construct a simple model which is fit to each source. The model consists of a template standard star to which we add continuuum veiling; this sum is then subjected to reddening. The reddened spectrum is then scaled by a multiplicative factor to account for the distance to and size of each source. The template star spectrum is our observed spectrum of either HR 753 (K3V) or GJ 876 (M4V), depending on which is closer in spectral type to our estimate for each Class I source. The reddening law is again that of Rieke & Lebofsky (1985). The veiling emission is taken to be quadratic in wavelength. We then use the technique of Marquardt (Bevington & Robinson, 1992) to determine the best fitting parameters which match our model spectrum to the spectrum of each Class I source. In the fitting procedure, we fit only the spectral regions shortward of 2.5 m and between 3.65 and 4.1 m. For Haro 6-10 N, we also ignore two strong absorption features, likely artifacts of the reduction, which appear at 3.76 and 3.88 m. Once we have fit each observed spectrum, we divide that spectrum by the fit and set the minimum value of the ratio equal to and solve for . An example of our fit to IRAS 040162610 appears in Figure 7.
Whittet et al. (1988) found a linear correlation between and the visual extinction, , for the interstellar medium. Sato et al. (1990) examined this correlation for a sample of protostars, assuming the ice to be in the circumstellar material surrounding the star itself, and used the same relation as Whittet et al. (1988), , adopting a critical visual extinction of mag. We use this modified relation to calculate the extinction as traced by the circumstellar ice feature. The results appear in Table 7.
The combination of near-simultaneous moderate resolution spectroscopy from the near to the mid-IR allows for the comparison of solid state features and hence reveals physical and compositional properties of Class I envelopes (e.g., Furlan et al., 2008). We examined the correlation of the 10 m silicate absorption feature strength, from Kessler-Silacci et al. (2005), calculated from a Gaussian fit to the normalized mid-IR spectra, with optical depths we determined for the 3.1 m water ice feature (Table 7). Figure 8 shows a trend towards higher ice optical depths for strong silicate absorption sources only; no significant correlation is obvious.
3.5 H-R Diagram
To compare the relative masses and ages of our Class I sources with those of Class II objects, we plotted stars for which we have the most reliable spectral types, determined from both absorption lines and continuum shape, on the H-R diagram (Figure 9). For four targets we used luminosity estimates from Furlan et al. (2008). For two others, IRAS 040162610 and Haro 6-10 S, we used values from Doppmann et al. (2005) either because the value from Furlan et al. (2008) was anomalously low (implying a main sequence age for IRAS 040162610) or because Furlan et al. (2008) did not observe the source (Haro 6-10 S). We used our spectral type estimates (Table 6) combined with the dwarf conversion (Table 2) given in Johnson (1966), to determine Teff. Interestingly, Johnson’s spectral type to Teff conversions closely parallel those derived for young stars by Luhman et al. (2003), from G through mid-M spectral types. In Table 8 we list our Teff, and for comparison the luminosity of each star given by Furlan et al. (2008), Doppmann et al. (2005), and/or White & Hillenbrand (2004). The resulting mass and age from the pre-main sequence tracks of Palla & Stahler (1999) are provided in Table 8 for the six targets for which these data were possible to derive.
Of the seven systems studied in this paper (taking Haro 6-10 S and N as one system), four are close binaries (Table 1). The three single systems in our sample along with Haro 6-10 S and two of the unresolved binaries appear in Figure 9. There is an inherent overestimate of the stellar luminosity for the unresolved pairs, which are treated as single objects by Furlan et al. (2007). Also, geometrical effects produced by the relative orientations of the circumstellar disks of each binary component could lead to anomalous measurements of extinction and excesses, for example, in the case of a configuration in which one star is obscured by the disk of the other. To the extent that circumstellar disks (flared or seen nearly edge on) contribute to the extinction, it is quite possible the extinction is very different to the two members of the binary. Without angularly resolved observations of the component objects in these systems, the degree to which binarity distorts the results of Class I studies, specifically the effective temperature and luminosity estimates and thus a source’s location in the H-R diagram, is unknown. The unresolved binaries are located far above the evolutionary model tracks in Figure 9, suggesting unrealistically young ages for these systems.
3.6 Accretion Luminosity and Mass Accretion Rate
For comparison with other studies of Class I objects as well as with Class II targets, we calculated the accretion luminosity, , of the eight stars in our sample using the correlation between and Br line luminosity found by Muzerolle et al. (1998). Our calculation is based on the -band magnitude, the Br emission line strength, and the overall extinction, for which we used the value determined by model fitting to standard stars as described in §3.3. The results appear in column 2 of Table 9. In most cases, the measurement is significant only at the one sigma level because the inherent uncertainties in the relationship between the accretion luminosity and the Br line luminosity (Muzerolle et al., 1998) are large. For half our sample we use upper limits for the extinction; if instead we use the values for extinction determined from the ice feature (Table 7) we obtain lower values for in the cases of IRAS 041812654A (log()0.841.12), IRAS 042392436 (log()0.191.06), and Haro 6-10 N (log()0.941.14). For IRAS 043612547, the other system with an upper limit only for in Table 6, the ice feature (24.2 mag) is similar to the upper limit (30 mag).
For the six targets in our sample for which we have estimates of both Teff and the luminosity (Furlan et al., 2008), we calculated the stellar radius, R∗, and hence the mass accretion rate, Ṁ, following Gullbring et al. (1998): (Table 9). Stellar mass (M∗) was estimated from the location of the targets in the H-R diagram. Primarily as a result of the very large uncertainties in the calculated accretion luminosity, Lacc, uncertainties in our mass accretion rates are all approximately an order of magnitude.
4 Discussion
4.1 Comparison with Previous Results from Literature
4.1.1 Extinction
As demonstrated here and also shown in Beck (2007), different approaches to measuring the extinction along the line of sight to Class I protostellar photospheres produce widely different results. We have used the position of sources in a near-IR color-color diagram, fitting to absorption features and the continuum shape of the -band spectra, and fitting to the -band water ice feature to determine and have found values that differ significantly. Figure 10 shows the extinctions determined from de-reddening objects plotted on the color-color diagram and from -band spectral fitting as a function of determined from fitting the -band water ice feature (Figure 7). Color-color diagram determined extinctions appear to scatter randomly, whereas extinctions measured from our -band spectra, excluding the upper limits, show some positive correlation with the ice . This suggests that the color-color diagram approach does not trace the same material along the line of sight. The color-color approach was based on the possibly flawed premise that the circumstellar envelope present in a Class I system contributes only reddening and assumes that the intrinsic colors of Class I protostars are the same as those of classical T Tauri stars. As a counterexample, consider objects that fall below the classical T Tauri star locus in the color-color diagram, i.e. IRAS 040162610 and Haro 6-10 S. These are no doubt extinguished; however, the effect of scattered light in the surrounding circumstellar environment yields unusual colors. Measurements of the extinction from the optical depth of the water ice feature in the -band probes the extinction through the region where this feature forms, while possibly missing extinction caused by dust in inner, warmer regions of an envelope or disk where it is too hot for water ice to survive. This could explain the systematically higher values from the -band spectroscopic fit approach (again, excluding the upper limits) which show a similar slope as the one-to-one correlation and presumably take into account all sources of extinction along the entire line of sight to the target system.
Comparison of our extinction results with those of White & Hillenbrand (2004) and Beck (2007) reveals that these studies are generally consistent with our smaller estimates of extinction based on fitting of the -band ice absorption feature. White & Hillenbrand (2004) provide extinctions determined from JH colors and Beck (2007) derives extinctions using several different approaches, including a spectral fitting procedure similar to the -band fits employed here. In their §3.8, Doppmann et al. (2005) describe an approach to estimating extinction, based on -band magnitudes, in order to derive stellar luminosities; however, they do not provide values of extinction in their paper. It is difficult to know which approach yields the “correct” extinction to a protostar. Ideally, a combination of near-simultaneous high- and low-resolution spectroscopy could provide careful measurements of underlying absorption line ratios as well as a measurement of the continuum slope. Even relatively small uncertainties in extinction can have a strong impact on derived Class I object properties, particularly accretion rates, and hence studies of these targets can be significantly improved with more attention to this problem.
4.1.2 Spectral Types, Surface Gravity, and -band Excesses
Three of our targets, IRAS 040162610, Haro 6-10 S, and IRAS 044893042, for which we determined Teff, , and were also analyzed by White & Hillenbrand (2004), Doppmann et al. (2005), Luhman (2006), and Doppmann et al. (2008). Another, L1551 IRS 5, was analyzed by Doppmann et al. (2005). Our results for spectral types, surface gravities, and -band excesses typically agree to within 12 with those from the literature with the exception of Haro 6-10 S and L1551 IRS 5, discussed below. For IRAS 044893042, Luhman (2006) found a spectral type of M3.5M4.5 on the basis of visible light observations, and M3M4 on the basis of IR observations, in excellent agreement with our determination of an M3.5 spectral type for this source.
For Haro 6-10 S, Doppmann et al. (2008) used high-resolution, high-signal to noise -band spectra to derive a Teff of 3800 K, cooler than our value of 4800 K, a surface gravity (log ) of 4.0, and a -band excess of 2.5, substantially larger than our uncertain estimate of 0.5. Based on the appearance of their spectra, these values for Haro 6-10 S are more reliable than our findings and result in a mass estimate smaller than ours by a factor of 3; both studies result in similar ages (23 Myr).
For L1551 IRS 5, we find an excellent match to an M3 III spectral type. Doppmann et al. (2005) find a Teff of 4800 K, corresponding to an early K spectral type, and a log of 4.0. In both our analysis and theirs, the -band veiling is 1. Figure 6 shows our M3 III fit of the modified young star spectrum, with 28 mag and a constant -band excess taken into account. Inspection of the spectra presented in Doppmann et al. (2005) shows an inconsistency with their earlier spectral type and higher gravity, possibly as the result of a degeneracy between the equivalent widths of the Na I and Mg I/Al I lines as a function of Teff and log (Doppmann 2007, priv. comm.). The lower surface gravity found in our fit is also consistent with our comparison of the location of L1551 IRS 5 on a plot of the Na I Ca I versus CO (2-0) equivalent widths (§3.2): it clearly lies along the giant star locus.
In general, from our -band spectral fits we find higher extinctions and lower excesses than those derived in previous Class I studies. We have used arbitrary slopes for fitting the -band excess, with no physical basis in a realistic model of circumstellar disk and/or envelope radiation. A combination of high signal-to-noise ratio low- and high-resolution spectra and detailed modeling of the spectral energy distribution, as in Furlan et al. (2008), will be necessary to improve these uncertain results.
4.1.3 Accretion Luminosities and Mass Accretion Rates
For six of our targets, published accretion luminosities are available for comparison in Muzerolle et al. (1998) and Beck (2007); these are provided in Table 9. Although the procedure for measuring the mass accretion rates followed in this paper and in the work of Muzerolle et al. (1998) and Beck (2007) was the same, i.e. based on the Br emission line, our values are all larger by 12 . Four objects have upper limits only for the spectroscopically determined . We recalculated the accretion luminosities for the three largest upper limits using the values based on the 3.1 m ice feature (see §3.6). The recalculated values are much closer to the values found by Muzerolle et al. (1998) and Beck (2007) for the same targets, illustrating that the relatively large values and upper limits for the extinction determined from our -band spectra are responsible for our relatively large accretion luminosities (Table 6). The impact of these larger accretion luminosities propagates into our calculation of the mass accretion rates, which range from M⊙ yr-1 to M⊙ yr-1 (Table 9), calculable for six of our targets. For the targets with published accretion rates, our estimates are equivalent or larger by up to two orders of magnitude (Table 9), however, with an uncertainty of approximately an order of magnitude. Given this large uncertainty, our small sample size, and the ambiguity in the determination of , it is impossible to draw definitive conclusions regarding potential enhanced accretion in Class I versus Class II objects. Class II mass accretion rates are typically 10-8 (Herczeg & Hillenbrand, 2008). Our results point to larger accretion luminosities and mass accretion rates than those of Class II objects, suggesting an evolutionary progression from protostars to classical T Tauri stars, as discussed in Doppmann et al. (2005) for example, but without the signal to noise to support this conclusion at a significant level.
4.2 Accreting Protostars or Misclassified T Tauris?
Recent studies of Class I protostars differ in their conclusions regarding the nature of these objects. White & Hillenbrand (2004) suggest that most Class Is have moved beyond their main accretion phase and might actually be Class II stars seen edge on through circumstellar accretion disks. Doppmann et al. (2005) conclude that Class I objects are indeed actively accreting protostars, albeit spanning a range of accretion activity. Since the publication of both papers, their authors have reached some consensus and conclude in White et al. (2007) that, at least for the Taurus SFR, one-third to one-half of the Class I objects are likely to be misclassified Class II stars seen through optically thick disks. White et al. (2007) also conclude that most Class I sources posses disk accretion rates below the expected envelope infall rates. Misclassified T Tauri stars would certainly show low disk accretion rates; however, such objects would typically be sub-luminous by a factor of five compared to bona fide Class Is (Whitney et al., 2003).
Another possibility raised in White et al. (2007) is that our knowledge of disk accretion rates and mass infall rates is incomplete. The uncertainties in these calculations are significant: in this paper as well as in the literature these values are only known to a precision of about an order of magnitude. Our finding of relatively large accretion rates (Table 9) compared to previously derived values for Class I objects is not significant. Objects that are found to be highly extinguished, such as our results suggest, naturally have large accretion luminosities. However, the large uncertainties associated with the mass accretion rate estimates mean that we cannot be confident that our results indicate that these protostars are currently experiencing a particularly active accretion phase. Our targets do, however, lie relatively far up on the evolutionary tracks in the H-R diagram (Figure 9), with ages 2 Myr, consistent with a population younger than that of the Class II T Tauri stars with ages of 1 to several Myr.
Another source of uncertainty in the determination of Class I protostar properties is their variability. Class I YSOs show considerable variation in their spectra, fluxes, colors, and excess IR emission. Leinert et al. (2001) studied the variability of the Haro 6-10 system over a twelve year period and found substantial change in the magnitudes and colors of the two components, especially at shorter wavelengths. -band veiling measurements for the Class I protostar YLW 15A (IRS 43) varied significantly over 5 years, possibly on time scales as short as weeks (Luhman & Rieke, 1999; Greene & Lada, 2002; Prato et al., 2003). These results suggest that the geometry of the obscuring material in front of the protostellar surface may be shifting rapidly, perhaps producing variations in the extinction along the line of sight to the protostar (e.g., Leinert et al., 2001; Beck et al., 2001).
Consistent with a younger evolutionary stage for the Class I sources is the ubiquitous atomic and molecular hydrogen emission in all but one of our targets (Figure 3 and Doppmann et al. 2005). The atomic hydrogen emission is likely associated with disk accretion onto the central star and the molecular emission with shocks created by infalling or outflowing gas interacting with the circumstellar environment. IRAS 044893042 shows only a small Br emission line and does not reveal any molecular hydrogen emission, either in our study or in that of Doppmann et al. (2005). All other targets have the H2 S(1) line in emission and about half also show emission in the H2 S(0) line.
5 Summary
We obtained - and -band spectra of a sample of eight Class I sources in the Taurus SFR with the SpeX spectrometer on the NASA IRTF 3 m telescope. We measured absorption and emission line equivalent widths, determined the optical depth of the -band water ice feature, and, where possible, estimated the spectral type, visual extinction, and -band excesses for each of our targets. Our analysis and results are summarized below.
– Using our derived spectral types in combination with 2MASS photometry and luminosity estimates available in the literature, we placed our targets in the H-R diagram and used evolutionary tracks of Palla & Stahler (1999) to estimate stellar masses and ages. In addition, we calculated accretion luminosities from the Br line luminosity and determined the associated mass accretion rate for our targets. The six objects which we were able to place on the H-R diagram show ages of 2 Myr and clump into two groups with masses 0.2 M⊙ and 1.9 M⊙.
– For two objects we obtain significantly different results from those presented in the literature, Haro 6-10 S and L1551 IRS 5. The majority of our targets are multiples; although we resolved Haro 6-10 S and N, Doppmann et al. (2008) suggest that the southern component is a spectroscopic binary. The high-resolution, very high signal to noise data of Doppmann et al. (2008) indicate a later spectral type, closer to M0, than the early K type found by us. The companion to L1551 IRS 5 is seen only at very long wavelengths (submillimeter; Looney et al., 1997) and it is thus unlikely that this component contaminates the primary spectrum in our analysis. However, we found a robust fit for this target to an M3III spectral type standard, a significantly lower gravity and later spectral type than the K3V type of Doppmann et al. (2005).
– Our experimental hypothesis, that obscuration of the photospheric absorption lines in Class I targets is dominated by extinction local to the sources, is not correct. Veiling of lines from the near-IR excess also plays a key role. It is likely that emission, for example from warm CO in a circumstellar disk, also fills in spectral absorption lines in some cases, hampering the determination of the underlying protostellar characteristics.
– We compared our derived properties with values from the literature and find that our larger estimates of extinction lead to larger accretion luminosities and larger mass accretion rates. We stress that the very large uncertainties, inherent in the relationship between emission line luminosities and accretion luminosities (Muzerolle et al., 1998) as well as in our observations, render these estimates highly uncertain, not only in our study but also in numerous examples in the literature.
– The higher mass accretion rates we find are more consistent with the interpretation that Class I protostars are undergoing a relatively active mass accretion phase; however, because of the large uncertainties in these results, additional observations are required to confirm this interpretation. High-resolution, high signal to noise IR spectroscopy provides a promising approach, however, low-resolution data across the near-IR may be particularly useful for the evaluation of extinction.
– The visual extinction to protostars appears to be an extremely important and poorly determined property, impacting estimates of all the key stellar properties including luminosity, mass, age, accretion luminosity, and mass accretion rate. It therefore represents a critical area for improvement.
We thank G. Doppmann, E. Furlan, E. Gibb, and T. Greene for useful information and discussions about various sources in our sample. KEL acknowledges K. Eastwood and the Northern Arizona University Research Experience for Undergraduates program through NSF grant AST-0453611. These observations benefitted from the expert telescope operating skills of B. Golisch. We are grateful for a detailed and timely anonymous referee report which improved the presentation of this paper. The authors extend special thanks to those of Hawaiian ancestry on whose sacred mountain we are privileged to be guests. This work made use of the SIMBAD reference database, the NASA Astrophysics Data System, and the data products from the Two Micron All Sky Survey, which is a joint project of the University of Massachusetts and the Infrared Processing and Analysis Center/California Institute of Technology, funded by the National Aeronautics and Space Administration and the National Science Foundation.
References
- Beck et al. (2001) Beck, T. L., Prato, L., & Simon, M. 2001, ApJ, 551, 1031
- Beck (2007) Beck, T. L. 2007, AJ, 133, 1673
- Benson et al. (1984) Benson, P. J., Myers, P. C. & Wright, E. L. 1984, ApJ, 279, L27
- Bergin et al. (2004) Bergin, E., et al. 2004, ApJ, 614, L133
- Bevington & Robinson (1992) Bevington, P. R., & Robinson, D. K. 1992, New York: McGraw-Hill, 1̧992, 2nd ed.
- Cohen & Schwartz (1983) Cohen, M. & Schwartz, R.D. 1983, ApJ, 265, 877
- Covey et al. (2005) Covey, K. R., Greene, T. P, Doppmann, G. W., Lada, C. J. 2005, AJ, 129, 2765
- Covey et al. (2006) Covey, K. R., Greene, T. P., Doppmann, G. W., & Lada, C. J. 2006, AJ, 131, 512
- Doppmann et al. (2005) Doppmann, G. W., Greene, T. P., Covey, K. R., Lada, C. J. 2005, AJ, 130, 1145
- Doppmann et al. (2008) Doppmann, G. W., Najita, J. R., & Carr, J. S. 2008, ArXiv e-prints, 805, arXiv:0805.2426
- Elias (1978) Elias, J. H. 1978, ApJ, 224, 857
- Furlan et al. (2008) Furlan, E., et al. 2008, ApJS, 176, 184
- Greene & Lada (1996) Greene, T. P., Lada, C. J. 1996, AJ, 112, 2184
- Greene & Lada (1997) Greene, T. P., Lada, C. J. 1997, AJ, 114, 2157
- Greene & Lada (2000) Greene, T. P., & Lada, C. J. 2000, AJ, 120, 430
- Greene & Lada (2002) Greene, T. P., & Lada, C. J. 2002, AJ, 124, 2185
- Gullbring et al. (1998) Gullbring, E., Hartmann, L., Briceno, C., & Calvet, N. 1998, ApJ, 492, 323
- Herczeg et al. (2004) Herczeg, G. J., Wood, B. E., Linsky, J. L., Valenti, J. A., & Johns-Krull, C. M. 2004, ApJ, 607, 369
- Herczeg & Hillenbrand (2008) Herczeg, G. J., & Hillenbrand, L. A. 2008, ArXiv e-prints, 801, arXiv:0801.3525
- Johnson (1966) Johnson, H. L. 1966, ARA&A, 4, 193
- Kenyon et al. (1998) Kenyon, S. J., Brown, D. I., Tout, C. A., Berlind, P. 1998, AJ, 115, 2491
- Kenyon et al. (1990) Kenyon, S. J., Hartmann, L. W., Strom, K. M., Strom, S. E. 1990, AJ, 99, 869
- Kessler-Silacci et al. (2005) Kessler-Silacci, J. E., Hillenbrand, L. A., Blake, G. A., & Meyer, M. R. 2005, ApJ, 622, 404
- Koenigl (1991) Koenigl, A. 1991, ApJ, 370, L39
- Lada (1987) Lada, C. J. 1987, in IAU Symp. 115, Star Forming Regions, ed. M. Peimbert & J. Jugaku (Dordrecht: Reidel), 1
- Leinert et al. (2001) Leinert, C., Beck, T. L., Ligori, S., Simon, M., Woitas, J., & Howell, R.R. 2001, A&A, 369, 215
- Leinert & Haas (1989) Leinert, C. & Haas, M. 1989, ApJ, 342, L39
- Looney et al. (1997) Looney, L. W., Mundy, L. G., & Welch, W. J. 1997, ApJ, 484, L157
- Luhman & Rieke (1999) Luhman, K. L., & Rieke, G. H. 1999, ApJ, 525, 440
- Luhman et al. (2003) Luhman, K. L., Stauffer, J. R., Muench, A. A., Rieke, G. H., Lada, E. A., Bouvier, J., & Lada, C. J. 2003, ApJ, 593, 1093
- Luhman (2006) Luhman, K. L. 2006, ApJ, 645, 676
- Matt & Pudritz (2005) Matt, S., & Pudritz, R. E. 2005, ApJ, 632, L135
- Meyer et al. (1997) Meyer, M. R., Calvet, N., & Hillenbrand, L. A. 1997, AJ, 114, 288
- Myers et al. (1987) Myers, P. C., Fuller, G. A., Mathieu, R. D., Beichman, C. A., Benson, P. J., Schild, R. E, & Emerson, J. P. 1987, ApJ, 319, 340
- Moneti et al. (1988) Moneti, A., Forrest, W. J., Pipher, J. L., & Woodward, C. E. 1988, ApJ, 327, 870
- Montmerle et al. (2000) Montmerle, T., Grosso, N., Tsuboi, Y., & Koyama, K. 2000, ApJ, 532, 1097
- Muzerolle et al. (1998) Muzerolle, J., Hartmann, L., & Calvet, N. 1998, AJ, 116, 2965
- Najita et al. (2003) Najita, J., Carr, J. S., & Mathieu, R. D. 2003, ApJ, 589, 931
- Palla & Stahler (1999) Palla, F., & Stahler, S. W. 1999, ApJ, 525, 772
- Prato (1998) Prato, L., 1998, Ph.D. thesis, SUNY Stony Brook
- Prato et al. (2003) Prato, L., Greene, T. P., & Simon, M. 2003, ApJ, 584, 853
- Price & Murdock (1983) Price, S. D., & Murdock, T. L. 1983, NASA STI/Recon Technical Report N, 84, 15005
- Rayner et al. (2003) Rayner, J. T., Toomey, D. W., Onaka, P. M., Denault, A. J., Stahlberger, W. E., Vacca, W. D., Cushing, M. C., & Wang, S. 2003, PASP, 115, 362
- Reipurth et al. (2000) Reipurth, B., Yu, K. C., Heathcote, S., Bally, J., & Rodríguez, L. F. 2000, AJ, 120, 1449
- Rice et al. (2006) Rice, E. L., Prato, L., & McLean, I. S. 2006, ApJ, 647, 432
- Rieke & Lebofsky (1985) Rieke, G. H., & Lebofsky, M. J. 1985, ApJ, 288, 618
- Rudy et al. (1991) Rudy, R., Erwin, P., Rossano, G. S., & Puetter, R. C. 1991, ApJ, 383, 344
- Sato et al. (1990) Sato, S., Nagata, T., Tanaka, M., & Yamamoto, T. 1990, ApJ, 359, 192
- Shu et al. (1994) Shu, F., Najita, J., Ostriker, E., Wilkin, F., Ruden, S., & Lizano, S. 1994, ApJ, 429, 781
- Skrutskie et al. (2006) Skrutskie, M. F., et al. 2006, AJ, 131, 1163
- Terebey et al. (1990) Terebey, S., Beichman, C. A., Gautier, T. N., & Hester, J. J. 1990, ApJ, 362, L63
- Terebey et al. (1998) Terebey, S., van Buren, D., Padgett, D. L., Hancock, T., & Brundage, M. 1998, ApJ, 507, L71
- Tokunaga (2000) Tokunaga, A. T. 2000, in Astrophysical Quantities, ed. A.N. Cox (New York: Springer), 143
- Wallace & Hinkle (1997) Wallace, L., & Hinkle, K. 1997, ApJS, 111, 445
- White & Hillenbrand (2004) White, R. J. & Hillenbrand, L. A. 2004, ApJ, 616, 998
- White et al. (2007) White, R. J., Greene, T. P., Doppmann, G. W., Covey, K. R., & Hillenbrand, L. A. 2007, Protostars and Planets V, 117
- Whitney et al. (2003) Whitney, B. A., Wood, K., Bjorkman, J. E., & Cohen, M. 2003, ApJ, 598, 1079
- Whittet et al. (1988) Whittet, D. C. B., Bode, M. F., Longmore, A. J., Adamson, A. J., McFadzean, A. D., Aitken, D. K., & Roche, P. F. 1988, MNRAS, 233, 321
- Wilking et al. (1999) Wilking, B. A., Greene, T. P., & Meyer, M. R. 1999, AJ, 117, 469
| Object | UT Date of | ||
|---|---|---|---|
| Name | (J2000.0) | (J2000.0) | Observation |
| IRAS 04016+2610 | 04 04 43.0 | +26 18 57 | 2000 Nov 18 |
| IRAS 04181+2654A | 04 21 11.5 | +27 01 09 | 2000 Nov 18 |
| IRAS 04239+2436aaBinary of separation 030 (Reipurth et al., 2000). | 04 26 57.1 | +24 43 36 | 2000 Nov 18 |
| Haro 6-10bbBinary of separation 12 (Leinert & Haas, 1989); listed as Haro 6-10 S (visible light primary) and N in subsequent tables. Haro 6-10 S is a radial velocity variable and thus possibly a spectroscopic binary (Doppmann et al., 2008). | 04 29 24.2 | +24 33 00 | 2000 Nov 19 |
| L1551 IRS 5ccBinary of separation 035 (Looney et al., 1997). | 04 31 34.0 | +18 08 05 | 2000 Nov 18 |
| IRAS 04361+2547ddBinary of separation 031 (Terebey et al., 1998). | 04 39 13.9 | +25 53 21 | 2000 Nov 19 |
| IRAS 04489+3042 | 04 52 06.7 | +30 47 18 | 2000 Nov 20 |
| Object | Spectral | UT Date of | |
|---|---|---|---|
| Name | Type | (mag) | Observation |
| HR 996 | G5 V | 3.0 | 2000 Nov 19 |
| HR 995 | G6 IV | 4.1 | 2000 Nov 20 |
| HR 7957 | K0 IV | 1.4 | 2000 Nov 20 |
| HR 166 | K0 V | 4.0 | 2000 Nov 19 |
| HR 753 | K3 V | 3.5 | 2000 Nov 19 |
| GL 846 | M0.5 V | 5.3 | 2000 Nov 18 |
| GL 908 | M1 V | 5.0 | 2000 Nov 18 |
| GL 15A | M1.5 V | 4.0 | 2000 Nov 20 |
| GL 806 | M2 V | 6.5 | 2000 Nov 19 |
| GL 752A | M3 V | 4.7 | 2000 Nov 18 |
| HR 9064 | M3 III | -0.1 | 2000 Nov 20 |
| GL 876 | M4 V | 5.0 | 2000 Nov 20 |
| GL 83.1 | M4.5 V | 6.6 | 2000 Nov 18 |
| Object | -band | Color-Color | ||||
|---|---|---|---|---|---|---|
| Name | (mag) | (mag) | (mag) | (mag) | References | Diagram (mag) |
| IRAS 04016+2610 | 14.010.07 | 12.160.08 | 9.84aaNo uncertainty available. | 6.8aaNo uncertainty available. | 1 | 0 1.6 |
| IRAS 04181+2654A | 16.220.08 | 12.650.02 | 10.340.03 | 8.5bb magnitude. | 2 | 22.8 1.2 |
| IRAS 04239+2436 | 15.750.09 | 12.350.04 | 9.990.02 | 7.2bb magnitude. | 2 | 20.0 1.4 |
| Haro 6-10 Scc, , and magnitudes quoted for the highly variable Haro 6-10 system are from reference (3) and correspond to the date of their observations closest in time to our spectroscopy. | 11.540.03ddAll -band flux from Haro 6-10 is assumed to come from the “primary”, southern component; the J magnitude is from 2MASS and was not observed concurrently with the H, K, and L data. | 10.60.1 | 8.60.1aaNo uncertainty available. | 6.10.1bb magnitude. | 3 | 0 1.9 |
| Haro 6-10 Ncc, , and magnitudes quoted for the highly variable Haro 6-10 system are from reference (3) and correspond to the date of their observations closest in time to our spectroscopy. | 13.50.1 | 8.70.1aaNo uncertainty available. | 4.90.1bb magnitude. | 3 | ||
| L1551 IRS 5 | 13.710.06 | 11.510.05 | 9.820.04 | 7.4aaNo uncertainty available. | 4 | 9.1 1.2 |
| IRAS 04361+2547 | 16.440.12 | 13.020.04 | 10.720.03 | 8.9aaNo uncertainty available. | 5 | 20.8 1.8 |
| IRAS 04489+3042 | 14.430.03 | 12.020.02 | 10.380.02 | 1.5aaNo uncertainty available. | 6 | 12.3 0.6 |
Note. — Data are from 2MASS unless otherwise specified.
References. — (1) Benson et al. (1984), (2) Beck (2007), (3) Leinert et al. (2001), (4) Cohen & Schwartz (1983), (5) Kenyon et al. (1990), (6) Myers et al. (1987)
| Spectral | 2.166m | 2.208m | 2.264m | 2.281m | 2.294m | 2.323m | |
|---|---|---|---|---|---|---|---|
| Name | Type | H I | Na I | Ca I | Mg I | CO(20) | CO(31) |
| HR 996 | G5 V | 3.2 | 1.3 | 1.2 | 1.1 | 1.5 | 2.1 |
| HR 995 | G6 IV | 2.2 | 0.9 | 1.1 | 0.7 | 4.7 | 5.0 |
| HR 7957 | K0 IV | 2.1 | 0.9 | 1.4 | 5.9 | 7.1 | |
| HR 166 | K0 V | 2.1 | 1.5 | 1.6 | 1.7 | 4.5 | 6.5 |
| HR 753 | K3 V | 1.4 | 2.2 | 2.1 | 1.9 | 6.6 | 6.6 |
| GL 846 | M0.5 V | 4.4 | 4.3 | 1.1 | 7.4 | 6.2 | |
| GL 908 | M1 V | 1.9 | 2.7 | 4.8 | 5.1 | ||
| GJ 15A | M1.5 V | 3.3 | 3.2 | 5.6 | 5.3 | ||
| GL 806 | M2 V | 3.8 | 3.9 | 6.6 | 6.3 | ||
| GL 752A | M3 V | 4.6 | 4.5 | 7.4 | 7.1 | ||
| HR 9064 | M3 III | 2.2 | 2.8 | 2.0 | 20.9 | 13.7 | |
| GJ 876 | M4 V | 6.2 | 4.2 | 4.5 | 6.2 | ||
| GL 83.1 | M4.5 V | 5.1 | 2.4 | 6.0 | 4.3 |
| 2.059m | 2.122m | 2.166m | 2.208m | 2.264m | 2.281m | 2.294m | 2.323m | 4.052m | |
|---|---|---|---|---|---|---|---|---|---|
| Name | He I | H2 | H I | Na I | Ca I | Mg I | CO(20) | CO(31) | Br |
| IRAS 040162610 | 2.2 | 2.3 | 1.0 | 1.0 | 2.0 | 2.3 | 11.5 | ||
| IRAS 041812654A | 1.4 | 1.9 | 9.9 | 1.3 | 1.6 | 0.8 | 4.0 | 23.0 | |
| IRAS 042392436 | 2.6 | 2.3 | 15.3 | 2.4 | 1.4 | 11.9 | 10.5 | 25.0 | |
| Haro 6-10 S | 2.1 | 4.1 | 1.0 | 1.0 | 33.0 | ||||
| Haro 6-10 N | 2.5 | 3.1 | 1.1 | 6.7 | 2.2 | ||||
| L1551 IRS 5 | 2.5 | 1.7 | 2.4 | 1.9 | 16.7 | 14.8 | 4.5 | ||
| IRAS 043612547 | 2.8 | 2.6 | 0.5 | 1.4 | 2.0 | ||||
| IRAS 044893042 | 2.6 | 2.7 | 2.0 | 1.7 | 4.6 | 4.5 |
| Spectral | Log(Lacc) | |||
|---|---|---|---|---|
| Name | Type | L⊙ | ||
| IRAS 04016+2610 | K3 V 2aaUncertainties in spectral type refer to number of spectral subclasses. | 45 2 | 1.3 0.2 | 0.54 0.99 |
| IRAS 04181+2654A | M1 M4 | 34 | 0.35 1.04 | |
| IRAS 04239+2436 | G early K? | 45 | 1.36 0.95 | |
| Haro 6-10 S | early K | 30 2 | 0.5 0.1 | 0.37 1.04 |
| Haro 6-10 N | G early K? | 59 | 2.06 0.91 | |
| L1551 IRS 5 | M3 III 1 | 28 2 | 1.0 0.2 | 0.69 1.12 |
| IRAS 04361+2547 | M4 V 2 | 30 | 0.80 1.13 | |
| IRAS 04489+3042 | M3.5 IV 2 | 18 1 | 1.4 0.4 | 1.26 1.17 |
| Name | ||
|---|---|---|
| IRAS 04016+2610 | 2.8 | 31.7 |
| IRAS 04181+2654A | 1.0 | 12.4 |
| IRAS 04239+2436 | 1.4 | 16.7 |
| Haro 610 S | 0.7 | 9.1 |
| Haro 610 N | 0.5 | 7.0 |
| L1551 IRS 5 | 1.7 | 19.9 |
| IRAS 04361+2547 | 2.1 | 24.2 |
| IRAS 04489+3042 | 0.7 | 9.1 |
Note. — Uncertainties in are 0.1 and in are 1.1 mag.
| Teff | L∗ (L⊙) | L∗ (L⊙) | L∗ (L⊙) | AgeaaAge uncertainties are 1 Myr. | MassbbMass uncertainties are 0.10.2 M⊙. | |
|---|---|---|---|---|---|---|
| Name | (K) | Furlan et al. (2008) | White & Hillenbrand (2004) | Doppmann et al. (2005) | (years) | (M⊙) |
| IRAS 04016+2610 | 4800 200 | 0.45 0.23 | 0.45 | 4.9 | 1e6ccBased on luminosities from Doppmann et al. (2005); all other results based on luminosities from Furlan et al. (2008). | 2.0ccBased on luminosities from Doppmann et al. (2005); all other results based on luminosities from Furlan et al. (2008). |
| IRAS 04181+2654A | 3350 100 | 0.14 0.04 | 2 | 0.2 | ||
| IRAS 04239+2436 | 0.15 0.51 | |||||
| Haro 6-10 S | 4800 200 | 1.8 | 3.3 | 2e6ccBased on luminosities from Doppmann et al. (2005); all other results based on luminosities from Furlan et al. (2008). | 1.8ccBased on luminosities from Doppmann et al. (2005); all other results based on luminosities from Furlan et al. (2008). | |
| Haro 6-10 N | ||||||
| L1551 IRS 5 | 3300 200 | 7.50 1.46 | 2.6 | 1e6 | 0.2 | |
| IRAS 04361+2547 | 3200 200 | 3.60 0.41 | 1e6 | 0.2 | ||
| IRAS 04489+3042 | 3250 200 | 0.21 0.03 | 0.2 | 0.3 | 1e6 | 0.2 |
| log(Lacc/L⊙) | log(Lacc/L⊙) | log(Lacc/L⊙) | (M⊙) | (M⊙) | |
|---|---|---|---|---|---|
| Name | this work | Muzerolle et al. (1998) | Beck (2007) | this work | other |
| IRAS 04016+2610 | 0.54 0.99 | 1.52 | 2.2e7 | 7.1e8aaWhite & Hillenbrand (2004). | |
| IRAS 04181+2654A | 0.35 1.04 | 1.22 | 4.9e7 | 9.0e9bbBeck (2007). | |
| IRAS 04239+2436 | 1.36 0.95 | 0.62 | 0.15 | ||
| Haro 6-10 S | 0.37 1.04 | 1.4e7 | 2.0e7aaWhite & Hillenbrand (2004). | ||
| Haro 6-10 N | 2.06 0.91 | 1.34 | |||
| L1551 IRS 5 | 0.69 1.12 | 3.4e7 | |||
| IRAS 04361+2547 | 0.80 1.13 | 1.10 | 0.70 | 1.9e7 | |
| IRAS 04489+3042 | 1.26 1.17 | 1.70 | 1.6e8 | 4.1e10aaWhite & Hillenbrand (2004). |