Density-matrix renormalization study of the frustrated fermions on the triangular lattice
Abstract
We show that the two-dimensional density-matrix renormalization analysis is useful to detect the symmetry breaking in the fermionic model on a triangular lattice. Under the cylindrical boundary conditions with chemical potentials on edge sites, we find that the open edges work as perturbation to select the strongest correlations only in the presence of a long range order. We also demonstrate that the ordinary size scaling analysis on the charge gap as well as that of the local charge density under this boundary condition could determine the metal-insulator phase boundary, which scales almost perfectly with the density of states and the exact solutions in the weak and strong coupling region, respectively.
pacs:
71.10.Hf, 71.27.+a, 71.10.-wGeometrically frustrated lattices sometimes provide particular situation where the strong correlation between particles or spins works effectively to give rise to exotic states. The numerical approach to such systems made remarkable progress in recent years; quantum monte carlo method (QMC) is applied to clarify the supersolid state on a triangular and square latticeswessel05 ; mila08 , plaquette state on a quantum dimer model, the nematic orders in the ring exchanged ladderslauhili05 . Also the exact diagonalization by the symmetry analysis gave much information on the low-energy excitation of the Kagome latticemisguish02 , nematic orders in the frustrated square latticenic06 , and so on. In the present paper we apply the density matrix renormalization group (DMRG) method to the two-dimensional(2D) frustrated system. So far, we understand that the systematic treatment to 2D-DMRG is not known to such system where a competition between several orders exists. We give a prototype analysis on how to determine the translational symmetry breaking, to detect the metal-insulator transition and so on. We choose as a representative frustrated system a fermionic system on the triangular lattice. Since the QMC is quite hopeless to such system due to the minus sign problem, the 2D-DMRG approach is useful instead, which can cope with much bigger sizes compared to the exact diagonalization. However, it is relatively quite difficult to get a reasonable results in DMRG when the system is critical or in higher dimension than one, which is demonstrated in the - model on a square latticewhite04 . Recent 2D-DMRG analysis with the cylindrical boundary condition is given by systematically varying the aspect ratio of the finite cluster, which successfully determined the magnetization of the Néel order in the square lattice Heisenberg modelwhite07 . However, the same analysis for the triangular lattice Heisenberg model turned out to be far difficult. In the present paper, we adopt the same cylindrical boundary condition, and demonstrate that the triangular lattice geometry combined with this boundary condition is useful to detect the symmetry breaking in an unbiased manner, which is also possible in the case of other lattices, e.g., the bipartite square lattice.
We mention in advance that even though the present analysis turned out to be successful, there are only few cases where the 2D-DMRG is reasonably adopted; (1) in detecting the Ising type of long range orders (with quantum fluctuation) when the ground state candidates are elucidated, (2) when the numerous number of states (more than the order of ) are kept by e.g., using the parallel computing systemhager05 , (3) analysis on metallic state away from the phase boundary. Still, the difficulty depends on what quantity we measure, and the numerically rigorous data provided by the DMRG would be of help in many occasions as in the present case which is one of the examples of case (1).
We choose as the simplest fermionic model the - model whose Hamiltonian given as,
| (1) |
Here () are creation (annihilation) operators of fermions and (=) are number operators. The interactions act only between neighboring sites . Anisotropies of the hopping amplitudes and repulsion strengths are all positive and are given by for the vertical bond and for the remaining bond directions, as shown in Fig. 1(a)–(c). We focus on half-filling where we have competitive orders due to the commensulability of charges, namely one charge per two sites. We take as the unit of energy and fix if not otherwise stated.
The overall ground state phase diagram of the - model is presented by part of the authors based on the exact diagonalization on a cluster and on a strong coupling analysishotta06-2 . When the interaction is enough large, the phase diagram is characterized by the three different phases according to the anisotropy of and as shown schematically in Fig. 1(d). Around the regular triangular geometry of the interactions, , we have a partially charge ordered liquid called a “pinball liquid”. This phase breaks the translational symmetry as characterized by the wave vector number, , and it originates from the long range order of ”pins”, while still retains a coherent metallic property. If one enters the anisotropic region, , one finds an insulator where the particles align in stripes in the horizontal (or diagonal) direction in order to avoid the energy rise by the stronger interaction, . We also have similar stripes in which extends along the vertical direction. The weakly coupled to intermediate coupling region is, however, not clarified yet, which will be focused in the present paper.
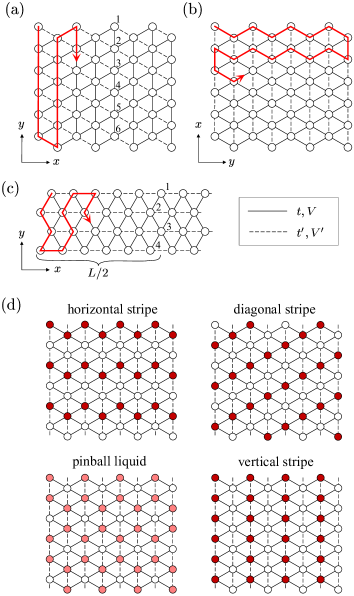
The 2D-DMRG calculation is performed on a cluster shown in Fig. 1(a)–(c). We keep up to 3200 basis for each DMRG block and undergo sweeps until the ground-state energy converges within an error of . Here, we adopt the open (OBC) and periodic (PBC) boundary condition in - and -direction, respectively as shown schematically in Figs. 1(a)–(c). It is well known that if all the boundaries are taken as periodic, the translational symmetry of charge density is always preserved at finite system size since the wave function is the superposition of all the degenerate states with equal weight. However, if we take the the cylindrical topology of the triangular lattice system and opens part of the boundaries, it gives rise to the lifting of the degenerate wave functions in the DMRG calculation. Therefore, we can easily detect translational-symmetry breaking charge-ordered states shown in Fig. 1(d). We additionally place the chemical potentials, or on each open edge site in order to suppress the artificial Friedel oscillation induced by OBC.
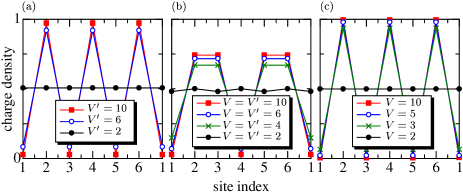
Usually, in the exact diagonalization and other finite size methods, we figure out what kind of structural factor the state has by analyzing the two-point correlation functions. If the considered structure has a true long range order, the amplitude of the structural factor shall remain finite in the thermodynamic limit after the finite scaling analysis. However, in the present 2D-DMRG calculation, each of these phases are detected more simply by the spatial structure of the charge density as follows; as in Fig. 1(a) we take the PBC on one of the -bond directions. Then, the other two open bonds with different interactions, and , artificially lifts the degeneracy of the finite size ground state and enables us to distinguish several translational symmetry broken and also the unbroken phases. Figure 2 shows the charge density of each characteristic state for sites indexed by numbers 1 to 6 in Fig. 1(a). The two-fold periodic structure in Fig. 2(a) and (c) indicate the diagonal and vertical stripes, respectively. We also detect the three fold periodic rich-rich-poor density of charges (denoted as A-A-B structure) in the pinball liquid state in Fig. 2(b). In contrast to those phases, the metallic phase at small or has almost uniform charge density along this periodic boundary. Therefore, the way we assign the boundary conditions should be the one that could efficiently detect the differences between ordered states.
Here, we must note that the horizontal stripe, which is another possible two-fold periodic structure at , is not realized if we take the boundary conditions as in Fig. 1(a). Therefore, we consider another type of cluster shown in Fig. 1(b) where both the diagonal and horizontal stripes are compatible, and compare their energies. The calculations on the cluster confirm that the horizontal order is always the ground state in the insulating phase at at and the diagonal order belongs to a higher state with small excitation energy.
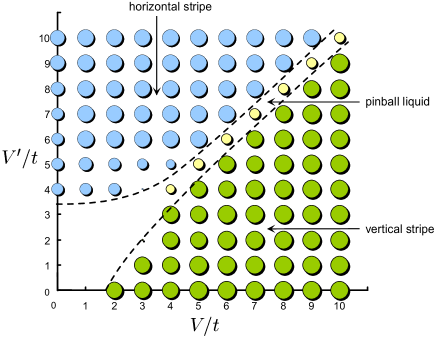
We now present the phase diagram on the plane of and in Fig. 3. As mentioned earlier we find three characteristic phases in the strong interaction region; the pinball liquid phase is sandwiched between two different stripes. As has been discussed in Ref.[hotta06, ; hotta06-2, ], the width of the pinball liquid phase is determined by the absolute value of and , e.g. for . Since these three phases breaks the translational symmetry with different characteristic wave numbers the transition between them are of first order. In the strongly interacting region, the phase boundaries show excellent agreement with the one found in the exact diagonalization. The similar phase diagram has been obtained by the same 2D-DMRG method for -- model nishimoto08 , and by the variational monte carlo (VMC) method watanabe06 . The physics of the charge ordering is essentially the same but the pinball-liquid phase is replaced by the three-fold charge-ordered metallic phase with doubly occupied sites.
In one dimension, the open boundary is regarded as impurities which induces a Friedel oscillation in metals and can be used to analyze the wave number and critical exponent of the Tomonaga-Luttinger liquidshibata96 ; affleck02 . These Friedel oscillations are not a true long range order and shall be suppressed if the proper chemical potentials are placed on open edges. On the other hand, if the system has a true long range order with particular symmetry , the OBC actually lifts the degeneracy of wave functions, regardless of whether the chemical potentials is present or not. We take advantage of this fact in 2D and use the partially open edges which would give rise to the spatial structure of the local quantities (charge density) only when we have long range order. The partially opened edge must be compatible in geometry with the symmetry of the orders to get rid of the the translated counterpart components. We note that the chemical potentials not only suppresses the Friedel oscillation but also helps the variational states not to fall into the local minimum in the case of the Ising-type of orders. Even if we adopt this method to the square lattice system, such breaking of symmetry will also appear. This is because the translational symmetry is broken in a direction with open ends and concomitantly the breaking of symmetry in the other direction which is periodic occurs. From these results, we may argue that the analysis based on the cylindrical boundary condition are useful to detect the breaking of translational symmetry in the two-dimensional lattices. We also confirmed that the same analysis is well adopted to the the Kagome lattice as well nishimoto .
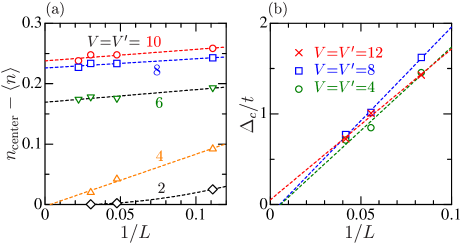
In the above analysis, we only considered the fixed cluster size. However, the phase boundary is usually overestimated by the small system size, particularly when we have finite but long correlation length compared to the size of the cluster. Thus one cannot really discriminate the short range order from the true long range order without the proper size scaling analysis. In order to get the more quantitative information, we give the scaling analysis on these local quantities by using the cluster shown in Fig. 1(c). We focus on the four different sites placed at the center of the cluster (see the sites marked by numbers 1–4 in Fig. 1(c)) which are the least influenced by the open boundary. Figure 4(a) shows the deviation from the average charge density of these sites as a function of inverse system length in the pinball liquid phase at . Here we take with integer , which is a period compatible with both the two-fold and three-fold periodicities. As we can see, at the deviation of charge density is extrapolated to zero, while over they change the slope significantly and become finite. This means that the translational symmetry is broken at , and a three-fold periodic long range order appears. This phase boundary is smaller than the one estimated from the VMC simulations on the same model, miyazaki09 . The VMC estimation based on the Fermi sea slater wave function is an upper bound, and the present results lie just in between the Hartree-Fock estimation and the VMC one.
We also estimate the charge gap, , of the three-fold periodic phase. The charge gap at each system size and particle number is given as, , where is the energy of the corresponding cluster. Figure 4(b) shows the extrapolation of towards with . We see that the system can be regarded as gapless in the thermodynamic limit, which is consistent with the previous studyhotta06 . The estimated phase boundary quantitatively agrees with the one by the charge density in Fig. 2 and guarantees the present analysis on the local quantities.
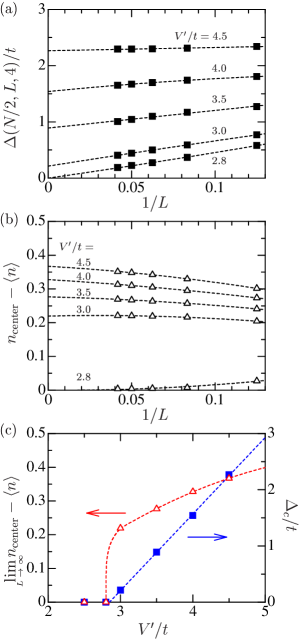
Now we focus on the weak coupling region of the phase diagram which is not well studied yet. In the horizontal stripe phase at , the charge gap opens due to the staggered long range order of particles in the anisotropic direction. The gap is well estimated by extrapolating the system size in that direction. Figure 5(a) shows the -dependence of the gap for several choices of with the fixed . The same scaling of the center site charge density is given in Fig. 5(b). As plotted in Fig. 5(c), the smooth opening of the extrapolated gap suggests the second order transition, while the extrapolated charge density shows a sharp development at the transition point. These are common behaviors in charge ordering induced by long-range interactions nishimoto03 . However, the transition point itself shows an excellent agreement between these two quantities. We note that the -dependence of the gap is very small in the insulating state, which reflects the localized character of the wave function. Resultantly, although the phase boundary of Fig. 3 shifts somewhat to a smaller - or -region after the scaling, the correction is less than .
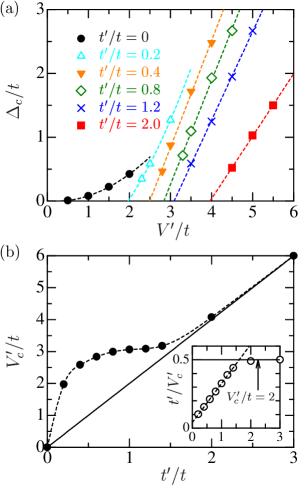
Next, by performing the same analysis, we investigate the effect of varying the geometry of transfer integrals, . Figure 6(a) shows the extrapolated charge gap for several choices of . By fitting the -dependences, the metal-insulator (MI) phase boundary is detected. Here, the gap opens linearly which makes the estimate precise. The -dependence of is plotted in Fig. 6(b). Just off the non-interacting point, , the gap opens since the shape of the Fermi surface at half-filling is a regular square and the perfect nesting takes place. Therefore the obtained insulator is a typical charge-density-wave state with a small gap. The value of significantly changes at , and then saturates to . At , the system is regarded as the one-dimensional chain, where the exact solution of the charge gap is given as hubbardexact . This can be more easily understood in the - plot in the inset, where the value of shows a clear crossover from the -linear term to the constant value at around .
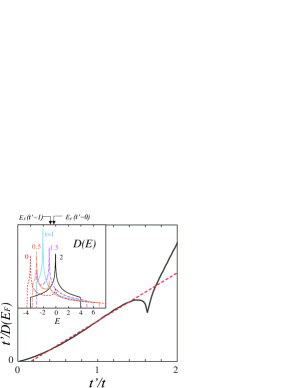
We now try to understand the characteristic -linear behavior of in the weak coupling region. Figure 7 shows the -dependence of the non-interacting density of states of the anisotropic triangular lattice at the Fermi level at half-filling, . We find that scales almost linearly with in the wide region, , which is exactly the region where we find the same linear relation in the inset of Fig. 6(b). By interpolating these two characteristic relations, we obtain the following relation,
where . The two different linear relations found in Fig. 5(c) indicates that the MI transition changes its character from the weak to the strong coupling ones, i.e. from the charge-density-wave to the charge ordered insulator, at , which is also the point where the van Hove singularity touches the Fermi level at half-filling.
To summarize we performed the 2D-DMRG analysis on the fermionic system on an anisotropic triangular lattice. We showed that in the triangular lattice the cylindrical boundary condition with chemical potentials on open edge site, the translational symmetry breaking is detected by measuring the local quantity in a reasonable accuracy. Also the finite scaling analysis is found to give a further quantitative estimation on the phase boundaries. The demonstration is given on the determination of the metal-insulator phase boundary as a function of the degree of the transfer integral, . It is found that at relatively small the phase boundary is scaled by the non-interacting density of states at the Fermi level, which indicates that the phase transition is regarded as a charge-density-wave transition due to the instability if the Fermi surface. On the other hand, at , the phase boundary is scaled to , which means that the system undergoes the phase transition to the charge ordered state in the one-dimensional manner.
The role of on the metal-insulator transition has been discussed previously in some articles related to organic compounds based on the mean-field approachchisa03 . Recently, it is proved by the uniaxial strain experiment that the MI transition temperature of the -ET2CsZn(SCN)4 into the horizontal charge ordered state significantly increases when the geometry of the transfer integral varies as kondo06 . The tendency that the insulator is stabilized due to is contrary to what we get in the present analysis. This might be because the present model deals with the half-filled charge density wave, while the experiments should be better explained in the 3/4-filled extended Hubbard model (which has a different Fermi level and a Fermi surface) instead. We expect that even in this latter model the will be scaled by the density of states. The present paper shows for the first time that the 2D-DMRG provides a reliable way to cope with the difficult parameter region where the electronic correlation and kinetic energy compete with each other, and presented the clear crossover from the weak to strong coupling.
References
- (1) S. Wessel and M. Troyer, Phys. Rev. Lett. 95 (2005) 127205.
- (2) K. P. Schmidt, J. Dorier, A. M. Luchli, and F. Mila, Phys. Rev. Lett. 100 (2008) 090401.
- (3) A. Luchli, J. C. Domenge, C. Lhuillier, P. Sindzingre, M. Troyer, Phys. Rev. Lett. 95 (2005) 137206.
- (4) G. Misguich, D. Serban and V. Pasquier, Phys. Rev. Lett. 89 (2002) 137202.
- (5) N. Shannon, T. Momoi, P. Sindzingre, Phys. Rev. Lett. 96 (2006) 027213.
- (6) S. R. White, D. J. Scalapino, Phys. Rev. B 70, 220506 (2004).
- (7) S. R. White, A. L. Chernyshev, Phys. Rev. Lett. 99, 127004 (2007)
- (8) G. Hager, G. Wellein, E. Jeckelmann, H. Fehske, Phys. Rev. B 71, 075108 (2005).
- (9) C. Hotta, N. Furukawa, A. Nakagawa and K. Kubo, J. Phys. Soc. Jpn. 75 (2006) 123704.
- (10) C. Hotta, N. Furukawa, Phys. Rev. B 74 193107 (2006).
- (11) S. Nishimoto, M. Shingai, Y. Ohta, Phys. Rev. B 78, (2008) 035113.
- (12) H. Watanabe, M. Ogata, J. Phys. Soc. Jpn. 75 (2006) 063702.
- (13) N. Shibata, K. Ueda, T. Nishino, and C. Ishii, Phys. Rev. B 54, 13495 (1996).
- (14) S. R. White, I. Affleck, D. J. Scalapino, Phys. Rev. B 65 165122 (2002).
- (15) A. O’Brien, S. Nishimoto, M. Nakamura, and P. Fulde, in preparation.
- (16) M. Miyazaki, C. Hotta, S. Miyahara, K. Matsuda, N. Furukawa, J. Phys. Soc. Jpn. 78 014707 (2009).
- (17) S. Nishimoto and Y. Ohta, Phys. Rev. B 68, 235114 (2003).
- (18) E. Lieb, F. Y. Wu, Phys. Rev. Lett. 20, 1445 (1968).
- (19) C. Hotta, J. Phys. Soc. Jpn. 72 840 (2003).
- (20) R. Kondo, M. Higa, S. Kagoshima, H. Hoshino, T. Mori, H. Mori, J. Phys. Soc. Jpn. 75 044716 (2006).